Strategy vault / Machine learning
Williams Fractals Combined with ZZ Indicator for Quantitative Trading Strategies
This is a quantitative trading strategy that combines the use of Bill Williams' fractal theory and the ZZ indicator. It judges market trends through the calculation of Williams fractals and identifies potential…
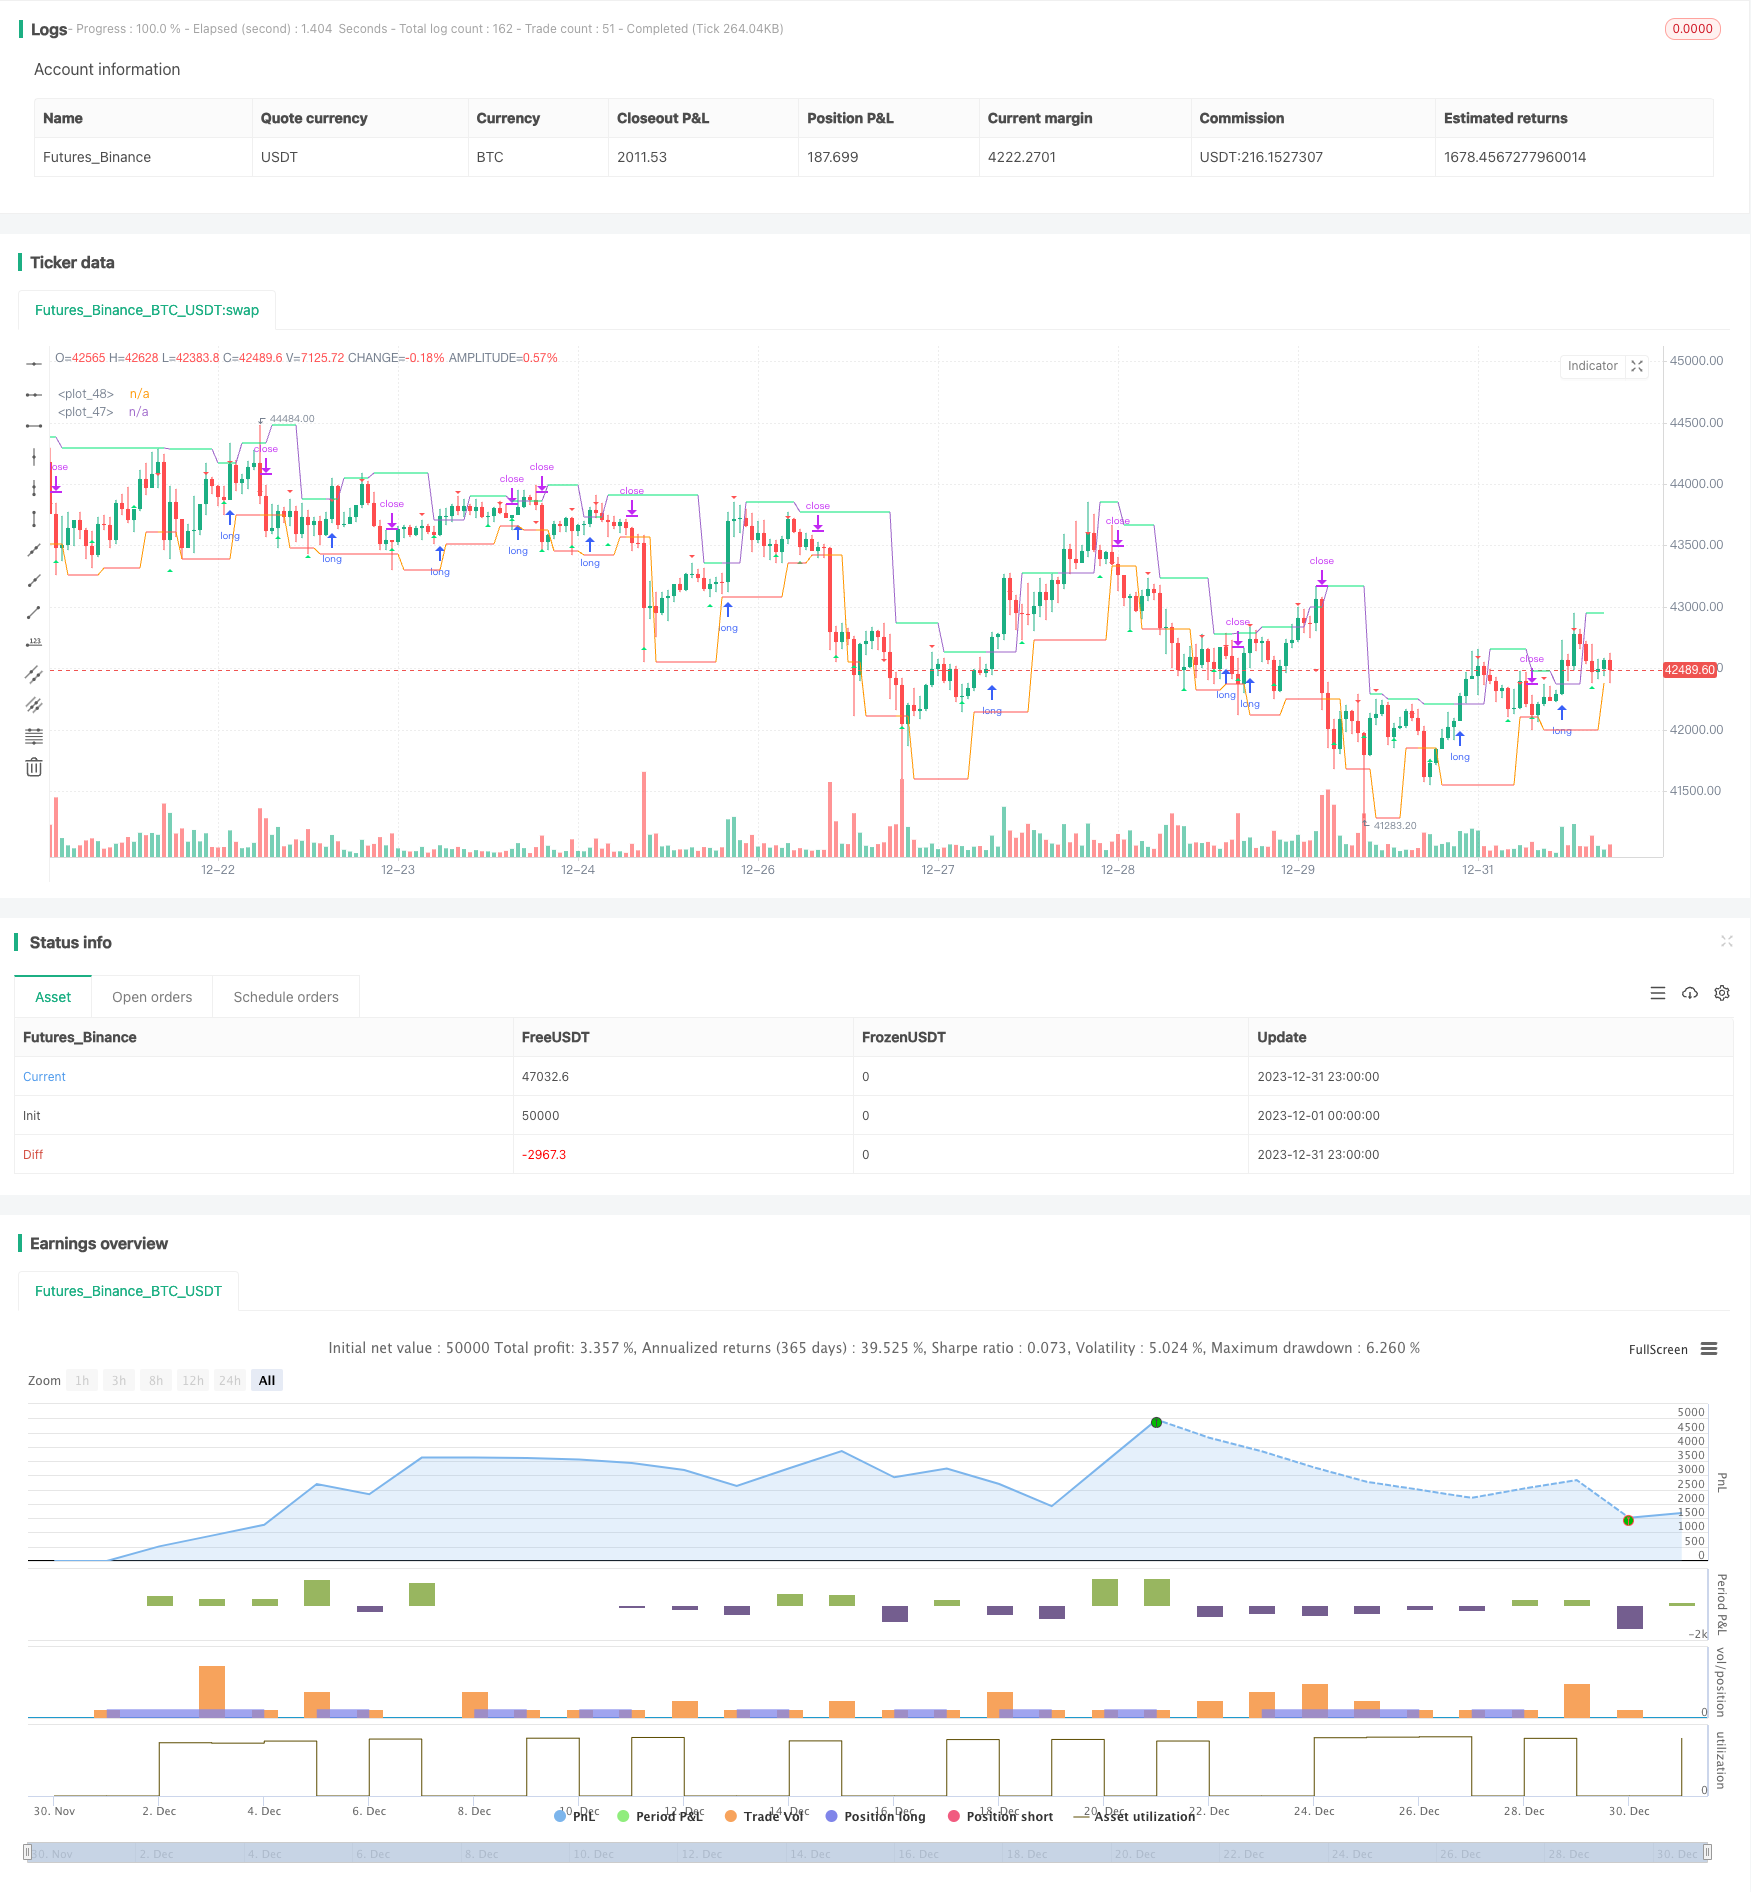
Overview
This is a quantitative trading strategy that combines the use of Bill Williams' fractal theory and the ZZ indicator. It judges market trends through the calculation of Williams fractals and identifies potential breakout points by drawing support/resistance lines using the ZZ indicator to implement trend-following trades.
Strategy Principle
The strategy first calculates the Williams fractals to determine whether the current fractal is rising or falling. If it is a rising fractal, it is believed that the current trend is upward. If it is a falling fractal, it is believed that the current trend is downward.
It then draws ZZ indicator's support and resistance lines based on the fractal points. If the price breaks through the resistance line corresponding to the rising fractal, go long. If the price breaks through the support line corresponding to the falling fractal, go short.
Through such a combination, it is possible to capture changes in trends in a timely manner and implement trend-following trades.
Advantage Analysis
This strategy combines two different technical analysis methods - Williams fractals and ZZ indicators - to uncover more trading opportunities.
It can timely judge the turning point of market trends and has good stop loss/take profit criteria to capture the main trend direction. In addition, the ZZ indicator can filter out some false breakouts to avoid unnecessary losses.
In general, this strategy considers both trend judgment and specific entry point selections to balance risks and returns.
Risk Analysis
The biggest risk of this strategy is that fractal judgments and ZZ indicator may issue wrong trading signals, leading to unnecessary losses. For example, after breaking through the resistance line, prices may quickly fall back, unable to sustain the uptrend.
In addition, the way fractals are calculated can lead to misjudgments if the timeframe is set improperly. Setting the timeframe too short increases the probability of false breakouts.
To reduce these risks, appropriately adjust the calculation parameters of fractals and increase filtering conditions to reduce erroneous signals. Besides, set wider stop loss to control single trade loss size.
Optimization Directions
This strategy can be further optimized in the following aspects:
Add momentum indicator filters such as MACD or Bollinger Bands to avoid some false breakouts.
Optimize fractal parameter settings and adjust the calculation of highs and lows and shorten the timeframe to obtain more accurate trend judgments.
Increase machine learning algorithms to judge trend accuracy and avoid human limitations.
Add adaptive stop loss mechanism based on market volatility.
Use deep learning algorithms to optimize overall parameter settings.
Summary
By skillfully combining Williams' fractal theory and the ZZ indicator, this strategy achieves timely detection and capturing of changes in market trends. It maintains high win rate and expects to obtain long-term excess returns. Next step by introducing more filters and AI capabilities, it is expected to further improve strategy stability and return rate.
Parameters
| Name | Default | What it controls |
|---|---|---|
| v_input_1 | true | Long |
| v_input_2 | false | Short |
| v_input_3 | false | filter Bill Williams Fractals |
| v_input_4 | true | Show levels |
| v_input_5 | true | Show fractals (repaint!) |
| v_input_6 | true | Show dots (repaint!) |
| v_input_7 | false | Show background |
| v_input_8 | false | Show drawdown |
| v_input_9 | timestamp(01 Jan 2000 00:00 +0000) | Start Time |
| v_input_10 | timestamp(31 Dec 2099 23:59 +0000) | Final Time |
Source Pine Script
/*backtest
start: 2023-12-01 00:00:00
end: 2023-12-31 23:59:59
period: 1h
basePeriod: 15m
exchanges: [{"eid":"Futures_Binance","currency":"BTC_USDT"}]
*/

//@version=4
strategy(title = "robotrading ZZ-8 fractals", shorttitle = "ZZ-8", overlay = true, default_qty_type = strategy.percent_of_equity, initial_capital = 100, default_qty_value = 100, commission_value = 0.1)

//Settings
needlong  = input(true, defval = true, title = "Long")
needshort = input(false, defval = true, title = "Short")
filterBW = input(false, title="filter Bill Williams Fractals")
showll = input(true, title = "Show levels")
showff = input(true, title = "Show fractals (repaint!)")
showdd = input(true, title = "Show dots (repaint!)")
showbg = input(false, title = "Show background")
showlb = input(false, title = "Show drawdown")
startTime = input(defval = timestamp("01 Jan 2000 00:00 +0000"), title = "Start Time", type = input.time, inline = "time1")
finalTime = input(defval = timestamp("31 Dec 2099 23:59 +0000"), title = "Final Time", type = input.time, inline = "time1")

//Variables
loss = 0.0
maxloss = 0.0
equity = 0.0
truetime = true

//Fractals
isRegularFractal(mode) =>
    ret = mode == 1 ? high[4] < high[3] and high[3] < high[2] and high[2] > high[1] and high[1] > high[0] : mode == -1 ? low[4] > low[3] and low[3] > low[2] and low[2] < low[1] and low[1] < low[0] : false
isBWFractal(mode) =>
    ret = mode == 1 ? high[4] < high[2] and high[3] <= high[2] and high[2] >= high[1] and high[2] > high[0] : mode == -1 ? low[4] > low[2] and low[3] >= low[2] and low[2] <= low[1] and low[2] < low[0] : false
filteredtopf = filterBW ? isRegularFractal(1) : isBWFractal(1)
filteredbotf = filterBW ? isRegularFractal(-1) : isBWFractal(-1)

//Triangles
plotshape(filteredtopf and showff, title='Filtered Top Fractals', style=shape.triangledown, location=location.abovebar, color= color.red, offset=-2)
plotshape(filteredbotf and showff, title='Filtered Bottom Fractals', style=shape.triangleup, location=location.belowbar, color= color.lime, offset=-2)

//Levels
hh = 0.0
ll = 0.0
hh := filteredtopf ? high[2] : hh[1]
ll := filteredbotf ? low[2] : ll[1]

//Trend
trend = 0
trend := high >= hh[1] ? 1 : low <= ll[1] ? -1 : trend[1]

//Lines
hcol = showll and hh == hh[1] and close < hh ? color.lime : na
lcol = showll and ll == ll[1] and close > ll ? color.red : na
plot(hh, color = hcol)
plot(ll, color = lcol)

//Dots
// var line hline = na
// if hh != hh[1] and showdd
//     hline := line.new(bar_index - 0, hh[0], bar_index - 2, hh[0], xloc = xloc.bar_index, extend = extend.none, style = line.style_dotted, color = color.lime, width = 1)
// var line lline = na
// if ll != ll[1] and showdd
//     lline := line.new(bar_index - 0, ll[0] - syminfo.mintick, bar_index - 2, ll[0] - syminfo.mintick, xloc = xloc.bar_index, extend = extend.none, style = line.style_dotted, color = color.red, width = 1)

//Background
bgcol = showbg == false ? na : trend == 1 ? color.lime : trend == -1 ? color.red : na
bgcolor(bgcol, transp = 80)

//Orders
if hh > 0 and needlong
    strategy.entry("Long", strategy.long, na, stop = hh, when = needlong and truetime)
    strategy.exit("Exit Long", "Long", stop = ll, when = needshort == false)
if ll > 0 and startTime
    strategy.entry("Short", strategy.short, na, stop = ll, when = needshort and truetime)
    strategy.exit("Exit Short", "Short", stop = hh, when = needlong == false)
if time > finalTime
    strategy.close_all()
    strategy.cancel("Long")
    strategy.cancel("Short")

if showlb

    //Drawdown
    max = 0.0
    max := max(strategy.equity, nz(max[1]))
    dd = (strategy.equity / max - 1) * 100
    min = 100.0
    min := min(dd, nz(min[1]))

    //Max loss size
    equity := strategy.position_size != strategy.position_size[1] ? strategy.equity : equity[1]
    loss := equity < equity[1] ? ((equity / equity[1]) - 1) * 100 : 0
    maxloss := min(nz(maxloss[1]), loss)

    //Label
    min := round(min * 100) / 100
    maxloss := round(maxloss * 100) / 100
    labeltext = "Drawdown: " + tostring(min) + "%" + "\nMax.loss " + tostring(maxloss) + "%"
    var label la = na
    label.delete(la)
    tc = min > -100 ? color.white : color.red
    osx = timenow + round(change(time)*50)
    osy = highest(100)
la := label.new(x = osx, y = osy, text = labeltext, xloc = xloc.bar_time, yloc = yloc.price, color = color.black, style = label.style_labelup, textcolor = tc)Published by ChaoZhang on the FMZ strategy square · last modified 2024-01-29. Collected in the Quant Trading Vault. Unvalidated research: re-test with your own data and costs before trusting it.
Build this with AgenKit
A spec is not a trading system. Paste this into your coding agent and AgenKit runs a specialist team — architecture, test-first build, risk gates, review — with paper trading on by default.
/agenkit build a production-grade trading bot with a backtest engine, risk controls and paper trading by default from strategies/Williams-Fractals-Combined-with-ZZ-Indicator-for-Quantitative-Trading-Strategies.md- npx agenkit install engineering-kit in your project
- Paste the command into your agent and approve each phase
- Get tests, backtest, risk controls and a paper-trading switch
Understand it first
Before you run this, read the lesson behind the idea and how to backtest it honestly. Specs like this one are the survivors of an unknown number of trials; deflate their results accordingly.
Related specs
- Multi indicator Assisted StrategyPine Script · Machine learning · 1d
- Multi Level Balanced Quantitative Trading StrategyPine Script · Machine learning · 1d
- EMA and RSI Quantitative Trading StrategyPine Script · Machine learning · 1h
- Fibonacci Retracement Dynamic Stop Loss StrategyPine Script · Machine learning · 1h
- High Frequency Hybrid Technical Analysis Quantitative StrategyPine Script · Machine learning · 15m
- Triple Moving Average Combined with MACD Quantitative StrategyPine Script · Machine learning · 1d