Strategy vault / Machine learning
Williams Fractals Dual Direction Trading Strategy
This strategy uses the Williams new highs and lows indicator to identify reversal signals, with multiple moving averages for breakout trading, and RSI to filter out false signals, enabling efficient dual direction…
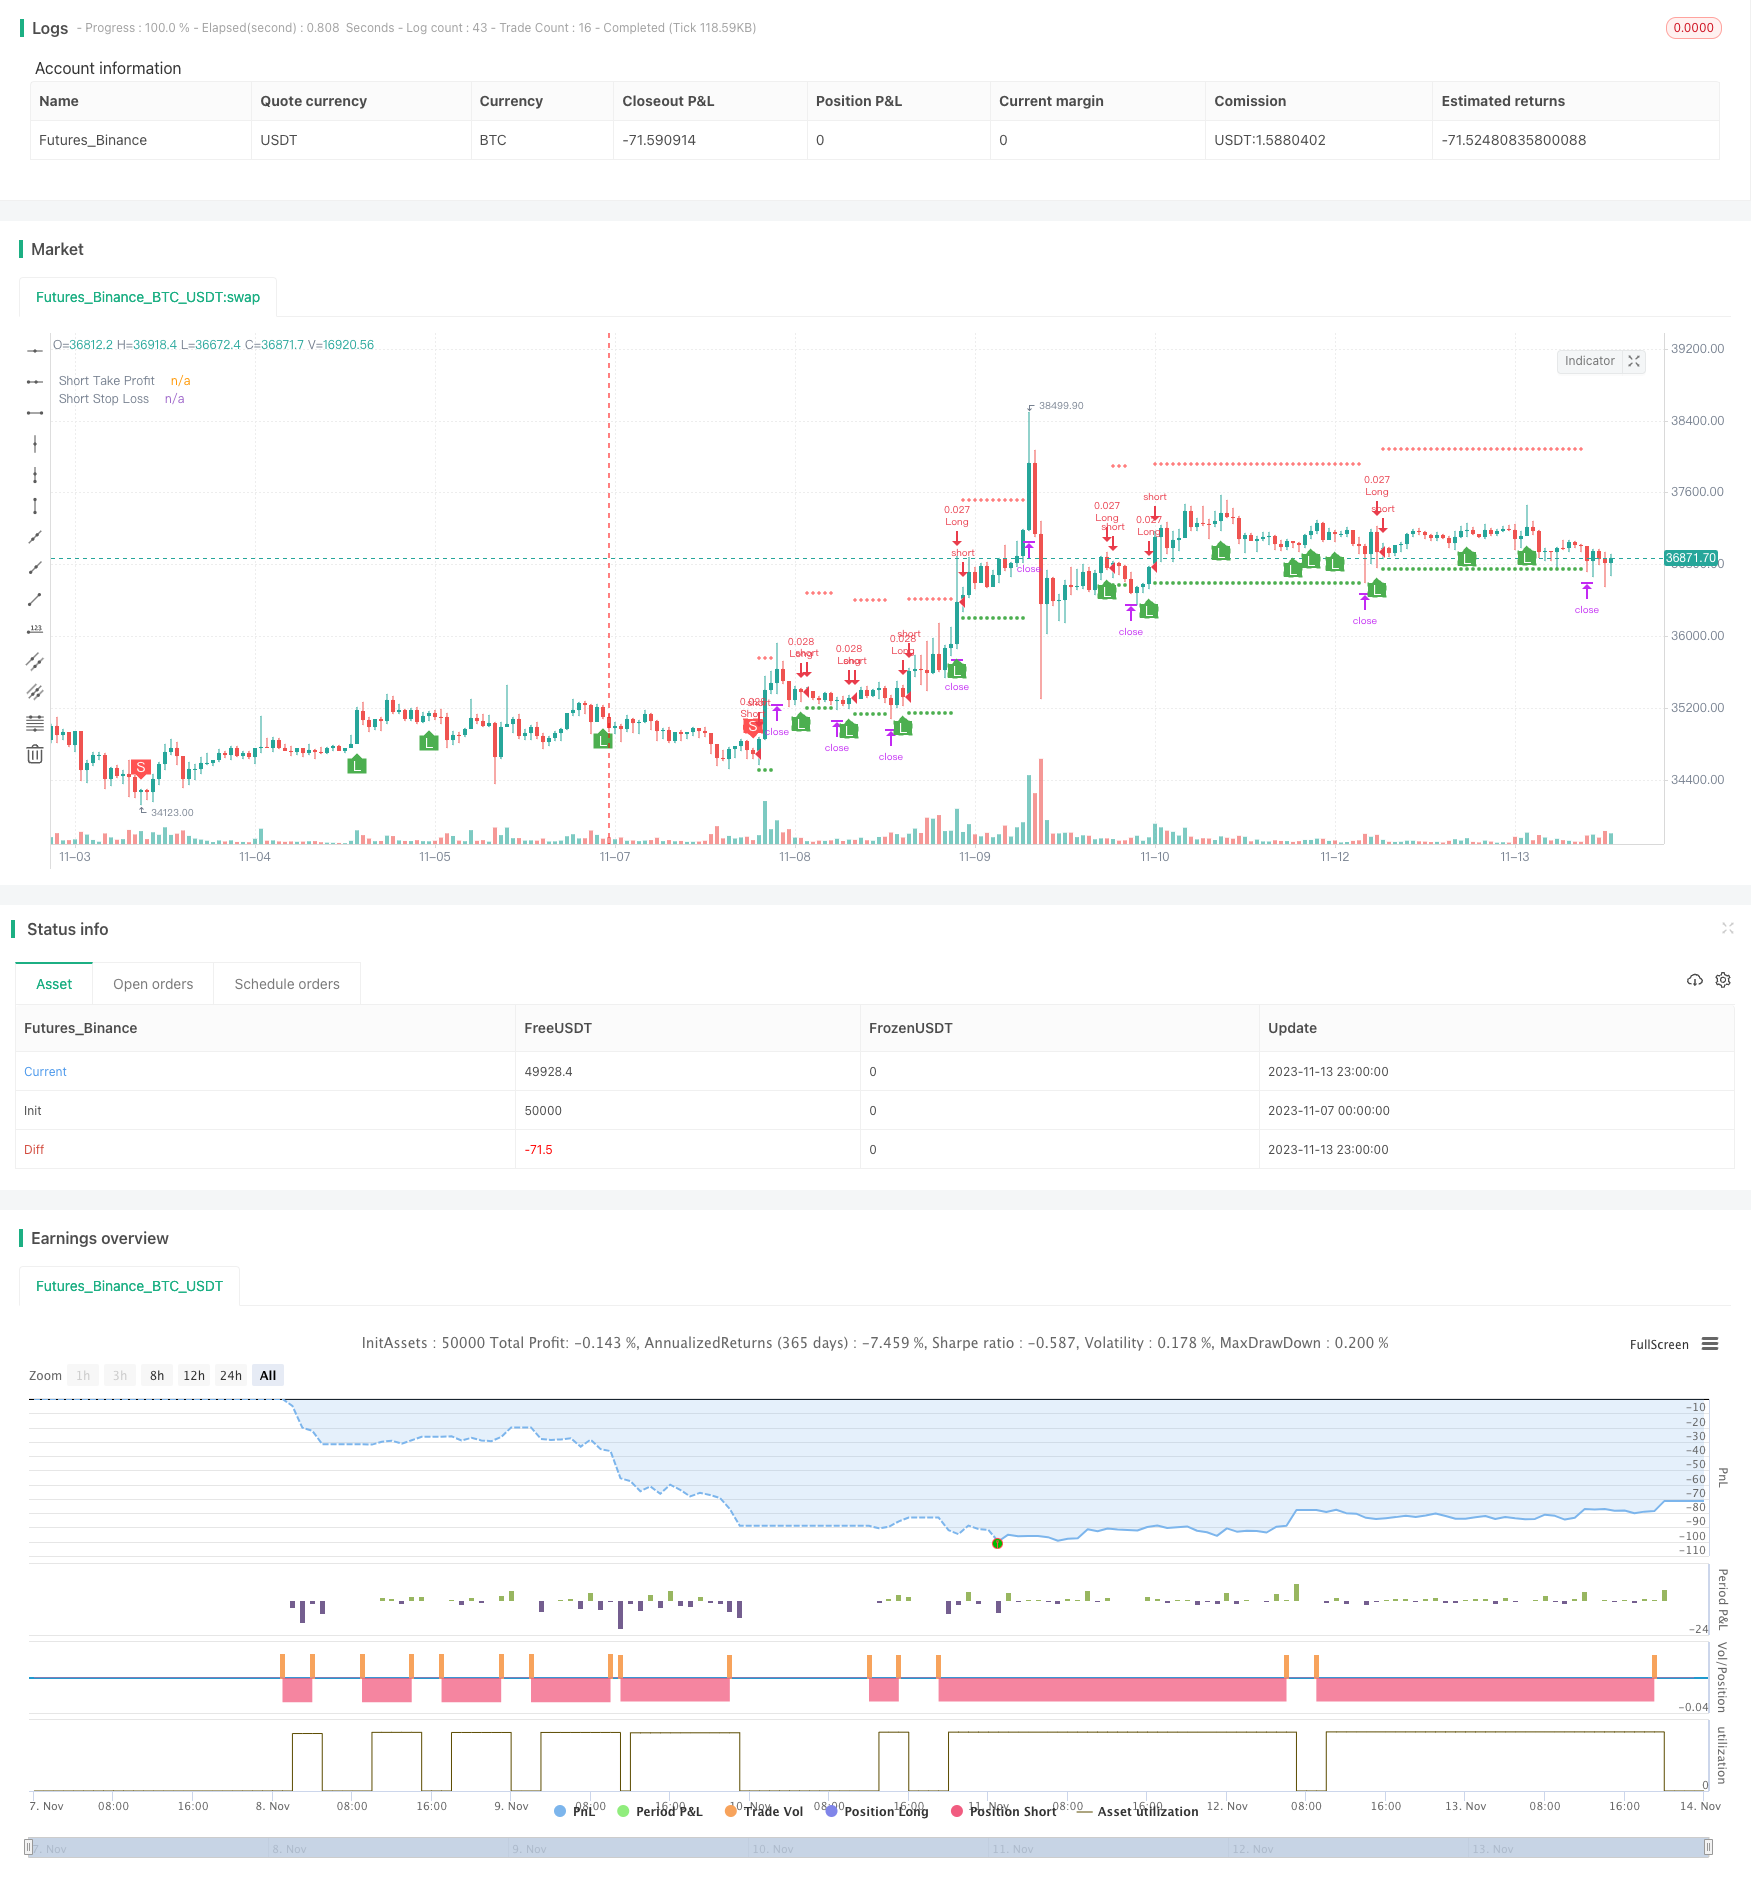
Overview
This strategy uses the Williams new highs and lows indicator to identify reversal signals, with multiple moving averages for breakout trading, and RSI to filter out false signals, enabling efficient dual direction trading.
Strategy Logic
The Williams new highs and lows indicator identifies turning points using the highest and lowest prices over a given period. It generates buy and sell signals.
The 20, 50, and 100-day moving averages form multiple moving averages. Trading signals are generated when the price breaks through two of the moving averages.
The RSI indicator identifies overbought and oversold zones to filter uncertain signals.
The strategy determines which two moving averages are broken, combines Williams indicator signals and RSI filtering to generate reliable buy and sell signals.
Entry rules: When the short-term MA crosses above the medium or long-term MA, and Williams new low and RSI low signals appear, go long. When the short-term MA crosses below the medium or long-term MA, and Williams new high and RSI high signals appear, go short.
Stop loss and take profit: Fixed percentage stop loss and take profit.
Advantages
Williams indicator accurately identifies key support and resistance for reversal signals.
Multiple moving average crossovers avoid false signals from single moving average whipsaws.
RSI filters help timing entry more precisely and reliably.
Fixed stop loss and take profit controls risk and provides clarity on P&L.
Combining reversal and trend indicators provides more reliable signals.
Risks
Inappropriate symbol selection, parameters need adjustment for different symbols.
Inefficient timeframe selection, parameters need tuning for different timeframes.
Fixed stop loss/take profit cannot adapt to market changes, may stop out or take profit prematurely.
Whipsaws when moving averages oscillate may generate false signals.
Signal lag when indicators diverge.
Enhancement Opportunities
Dynamic optimization of parameters for different trading instruments.
Introduce adaptive stop loss and take profit for better P&L.
Add more filters like MACD, Stochastics to reduce false signals.
Incorporate machine learning algorithms to automatically detect optimal entry.
Integrate more trend indicators to identify trending conditions.
Summary
This strategy combines Williams, moving averages, RSI and other technical analysis tools, using dual confirmation to reduce false signals and effectively capture reversals, with fixed stop loss/take profit to control risk. Overall a reliable and practical dual direction trading system. Next steps are further performance improvement through parameter optimization, stop loss/take profit enhancements and ensemble modeling.
Parameters
| Name | Default | What it controls |
|---|---|---|
| v_input_1 | 0 | (?Appearance)theme: dark | light |
| v_input_2 | false | Show Fractals |
| v_input_3 | false | Show EMAs |
| v_input_4 | 2 | (?Williams Fractals)Fractal Periods |
| v_input_5 | 20 | (?EMA)EMA Length A |
| v_input_6_close | 0 | EMA Source A: close | high | low | open | hl2 | hlc3 | hlcc4 | ohlc4 |
| v_input_7 | false | EMA Offset A |
| v_input_8 | 50 | EMA Length B |
| v_input_9_close | 0 | EMA Source B: close | high | low | open | hl2 | hlc3 | hlcc4 | ohlc4 |
| v_input_10 | false | EMA Offset B |
| v_input_11 | 100 | EMA Length C |
| v_input_12_close | 0 | EMA Source C: close | high | low | open | hl2 | hlc3 | hlcc4 | ohlc4 |
| v_input_13 | false | EMA Offset C |
| v_input_14 | 14 | (?RSI)RSI Length |
| v_input_15_close | 0 | RSI Source: close | high | low | open | hl2 | hlc3 | hlcc4 | ohlc4 |
| v_input_16 | true | (?Orders)Start Date |
| v_input_17 | true | Start Month |
| v_input_18 | 2018 | Start Year |
| v_input_19 | true | End Date |
| v_input_20 | 12 | End Month |
| v_input_21 | 2022 | End Year |
| v_input_22 | 0.5 | Long Take Profit (%) |
| v_input_23 | 0.5 | Short Take Profit (%) |
| v_input_24 | 3.1 | Long Stop Loss (%) |
| v_input_25 | 3.1 | Short Stop Loss (%) |
Source Pine Script
/*backtest
start: 2023-11-07 00:00:00
end: 2023-11-14 00:00:00
period: 1h
basePeriod: 15m
exchanges: [{"eid":"Futures_Binance","currency":"BTC_USDT"}]
*/

// This source code is subject to the terms of the Mozilla Public License 2.0 at https://mozilla.org/MPL/2.0/
// © B_L_A_C_K_S_C_O_R_P_I_O_N
// v 1.1

//@version=4
strategy("Williams Fractals Strategy by ȼhąţhµяąɲǥą", overlay=true, default_qty_type=strategy.cash, default_qty_value=1000, currency='USD')

// *************Appearance*************
theme = input(type=input.string, defval="dark", options=["light","dark"], group="Appearance")
show_fractals = input(false, "Show Fractals", group="Appearance")
show_ema = input(false, "Show EMAs", group="Appearance")

// *************colors*************
color_green = color.green
color_red = color.red
color_yellow = color.yellow
color_orange = color.orange
color_blue = color.blue
color_white = color.white

// *************WF*************
// Define "n" as the number of periods and keep a minimum value of 2 for error handling.
n = input(title="Fractal Periods", defval=2, minval=2, type=input.integer, group="Williams Fractals")

// UpFractal
bool upflagDownFrontier = true
bool upflagUpFrontier0 = true
bool upflagUpFrontier1 = true
bool upflagUpFrontier2 = true
bool upflagUpFrontier3 = true
bool upflagUpFrontier4 = true

for i = 1 to n
    upflagDownFrontier := upflagDownFrontier and (high[n-i] < high[n])
    upflagUpFrontier0 := upflagUpFrontier0 and (high[n+i] < high[n])
    upflagUpFrontier1 := upflagUpFrontier1 and (high[n+1] <= high[n] and high[n+i + 1] < high[n])
    upflagUpFrontier2 := upflagUpFrontier2 and (high[n+1] <= high[n] and high[n+2] <= high[n] and high[n+i + 2] < high[n])
    upflagUpFrontier3 := upflagUpFrontier3 and (high[n+1] <= high[n] and high[n+2] <= high[n] and high[n+3] <= high[n] and high[n+i + 3] < high[n])
    upflagUpFrontier4 := upflagUpFrontier4 and (high[n+1] <= high[n] and high[n+2] <= high[n] and high[n+3] <= high[n] and high[n+4] <= high[n] and high[n+i + 4] < high[n])
flagUpFrontier = upflagUpFrontier0 or upflagUpFrontier1 or upflagUpFrontier2 or upflagUpFrontier3 or upflagUpFrontier4

upFractal = (upflagDownFrontier and flagUpFrontier)

// downFractal
bool downflagDownFrontier = true
bool downflagUpFrontier0 = true
bool downflagUpFrontier1 = true
bool downflagUpFrontier2 = true
bool downflagUpFrontier3 = true
bool downflagUpFrontier4 = true

for i = 1 to n
    downflagDownFrontier := downflagDownFrontier and (low[n-i] > low[n])
    downflagUpFrontier0 := downflagUpFrontier0 and (low[n+i] > low[n])
    downflagUpFrontier1 := downflagUpFrontier1 and (low[n+1] >= low[n] and low[n+i + 1] > low[n])
    downflagUpFrontier2 := downflagUpFrontier2 and (low[n+1] >= low[n] and low[n+2] >= low[n] and low[n+i + 2] > low[n])
    downflagUpFrontier3 := downflagUpFrontier3 and (low[n+1] >= low[n] and low[n+2] >= low[n] and low[n+3] >= low[n] and low[n+i + 3] > low[n])
    downflagUpFrontier4 := downflagUpFrontier4 and (low[n+1] >= low[n] and low[n+2] >= low[n] and low[n+3] >= low[n] and low[n+4] >= low[n] and low[n+i + 4] > low[n])
flagDownFrontier = downflagUpFrontier0 or downflagUpFrontier1 or downflagUpFrontier2 or downflagUpFrontier3 or downflagUpFrontier4

downFractal = (downflagDownFrontier and flagDownFrontier)

plotshape(downFractal and show_fractals, style=shape.triangleup, location=location.belowbar, offset=-n, color=color_green)
plotshape(upFractal and show_fractals, style=shape.triangledown, location=location.abovebar, offset=-n, color=color_red)

// *************EMA*************
len_a = input(20, minval=1, title="EMA Length A", group="EMA")
src_a = input(close, title="EMA Source A", group="EMA")
offset_a = input(title="EMA Offset A", type=input.integer, defval=0, minval=-500, maxval=500, group="EMA")
out_a = ema(src_a, len_a)
plot(show_ema ? out_a : na, title="EMA A", color=color_green, offset=offset_a)

len_b = input(50, minval=1, title="EMA Length B", group="EMA")
src_b = input(close, title="EMA Source B", group="EMA")
offset_b = input(title="EMA Offset B", type=input.integer, defval=0, minval=-500, maxval=500, group="EMA")
out_b = ema(src_b, len_b)
ema_b_color = (theme == "dark") ? color_yellow : color_orange
plot(show_ema ? out_b : na, title="EMA B", color=ema_b_color, offset=offset_b)

len_c = input(100, minval=1, title="EMA Length C", group="EMA")
src_c = input(close, title="EMA Source C", group="EMA")
offset_c = input(title="EMA Offset C", type=input.integer, defval=0, minval=-500, maxval=500, group="EMA")
out_c = ema(src_c, len_c)
ema_c_color = (theme == "dark") ? color_white : color_blue
plot(show_ema ? out_c : na, title="EMA C", color=ema_c_color, offset=offset_c)

// *************RSI*************
rsi_len = input(14, minval=1, title="RSI Length", group="RSI")
rsi_src = input(close, "RSI Source", type = input.source, group="RSI")
up = rma(max(change(rsi_src), 0), rsi_len)
down = rma(-min(change(rsi_src), 0), rsi_len)
rsi = down == 0 ? 100 : up == 0 ? 0 : 100 - (100 / (1 + up / down))

// *************Calculation*************
long = (out_a > out_b) and (out_a > out_c) and downFractal and low[2] > out_c and rsi[2] < rsi
short = (out_a < out_b) and (out_a < out_c) and upFractal and high[2] < out_c and rsi[2] > rsi

plotshape(long, style=shape.labelup, color=color_green, location=location.belowbar, title="long label", text= "L", textcolor=color_white)
plotshape(short, style=shape.labeldown, color=color_red, location=location.abovebar, title="short label", text= "S", textcolor=color_white)

// *************End of Signals calculation*************

// Make input options that configure backtest date range
startDate = input(title="Start Date", type=input.integer,
     defval=1, minval=1, maxval=31, group="Orders")
startMonth = input(title="Start Month", type=input.integer,
     defval=1, minval=1, maxval=12, group="Orders")
startYear = input(title="Start Year", type=input.integer,
     defval=2018, minval=1800, maxval=2100, group="Orders")

endDate = input(title="End Date", type=input.integer,
     defval=1, minval=1, maxval=31, group="Orders")
endMonth = input(title="End Month", type=input.integer,
     defval=12, minval=1, maxval=12, group="Orders")
endYear = input(title="End Year", type=input.integer,
     defval=2022, minval=1800, maxval=2100, group="Orders")

// Look if the close time of the current bar
// falls inside the date range
inDateRange =  true

// Make inputs that set the take profit % (optional)
longProfitPerc = input(title="Long Take Profit (%)",
     type=input.float, minval=0.0, step=0.1, defval=0.5, group="Orders") * 0.01

shortProfitPerc = input(title="Short Take Profit (%)",
     type=input.float, minval=0.0, step=0.1, defval=0.5, group="Orders") * 0.01

// Figure out take profit price
longExitPrice  = strategy.position_avg_price * (1 + longProfitPerc)
shortExitPrice = strategy.position_avg_price * (1 - shortProfitPerc)

// Plot take profit values for confirmation
plot(series=(strategy.position_size > 0) ? longExitPrice : na,
     color=color_green, style=plot.style_circles,
     linewidth=1, title="Long Take Profit")
plot(series=(strategy.position_size < 0) ? shortExitPrice : na,
     color=color_green, style=plot.style_circles,
     linewidth=1, title="Short Take Profit")

// Submit entry orders
if (inDateRange and long and strategy.opentrades == 0)
    strategy.entry(id="Long", long=true)

if (inDateRange and short and strategy.opentrades == 0)
    strategy.entry(id="Short", long=false)

// Submit exit orders based on take profit price
// if (strategy.position_size > 0)
//     strategy.exit(id="LTP", limit=longExitPrice)

// if (strategy.position_size < 0)
//     strategy.exit(id="STP", limit=shortExitPrice)

// Set stop loss level with input options (optional)
longLossPerc = input(title="Long Stop Loss (%)",
     type=input.float, minval=0.0, step=0.1, defval=3.1, group="Orders") * 0.01

shortLossPerc = input(title="Short Stop Loss (%)",
     type=input.float, minval=0.0, step=0.1, defval=3.1, group="Orders") * 0.01

// Determine stop loss price
longStopPrice  = strategy.position_avg_price * (1 - longLossPerc)
shortStopPrice = strategy.position_avg_price * (1 + shortLossPerc)

// Plot stop loss values for confirmation
plot(series=(strategy.position_size > 0) ? longStopPrice : na,
     color=color_red, style=plot.style_cross,
     linewidth=1, title="Long Stop Loss")
plot(series=(strategy.position_size < 0) ? shortStopPrice : na,
     color=color_red, style=plot.style_cross,
     linewidth=1, title="Short Stop Loss")

// Submit exit orders based on calculated stop loss price
if (strategy.position_size > 0)
    strategy.exit(id="ExL",limit=longExitPrice, stop=longStopPrice)

if (strategy.position_size < 0)
    strategy.exit(id="ExS", limit=shortExitPrice, stop=shortStopPrice)

// Exit open market position when date range ends
if (not inDateRange)
strategy.close_all()Published by ChaoZhang on the FMZ strategy square · last modified 2023-11-15. Collected in the Quant Trading Vault. Unvalidated research: re-test with your own data and costs before trusting it.
Build this with AgenKit
A spec is not a trading system. Paste this into your coding agent and AgenKit runs a specialist team — architecture, test-first build, risk gates, review — with paper trading on by default.
/agenkit build a production-grade trading bot with a backtest engine, risk controls and paper trading by default from strategies/Williams-Fractals-Dual-Direction-Trading-Strategy.md- npx agenkit install engineering-kit in your project
- Paste the command into your agent and approve each phase
- Get tests, backtest, risk controls and a paper-trading switch
Understand it first
Before you run this, read the lesson behind the idea and how to backtest it honestly. Specs like this one are the survivors of an unknown number of trials; deflate their results accordingly.
Related specs
- Triple Moving Average Combined with MACD Quantitative StrategyPine Script · Machine learning · 1d
- Johns Bitcoin Intraday Trading Strategy Based on Multiple IndicatorsPine Script · Machine learning · 1m
- Multi indicator Assisted StrategyPine Script · Machine learning · 1d
- ADX EFI 50 Moving Average Channel Pullback StrategyPine Script · Machine learning · 1h
- Multi Level Balanced Quantitative Trading StrategyPine Script · Machine learning · 1d
- Multi indicator Combination StrategyPine Script · Machine learning · 1d