Willy Wonka Breakout Strategy
The Willy Wonka Breakout Strategy is a breakout trading strategy that integrates multiple technical indicators analysis, mainly utilizing RSI, Stochastics, EMA and price patterns to identify buying and selling…
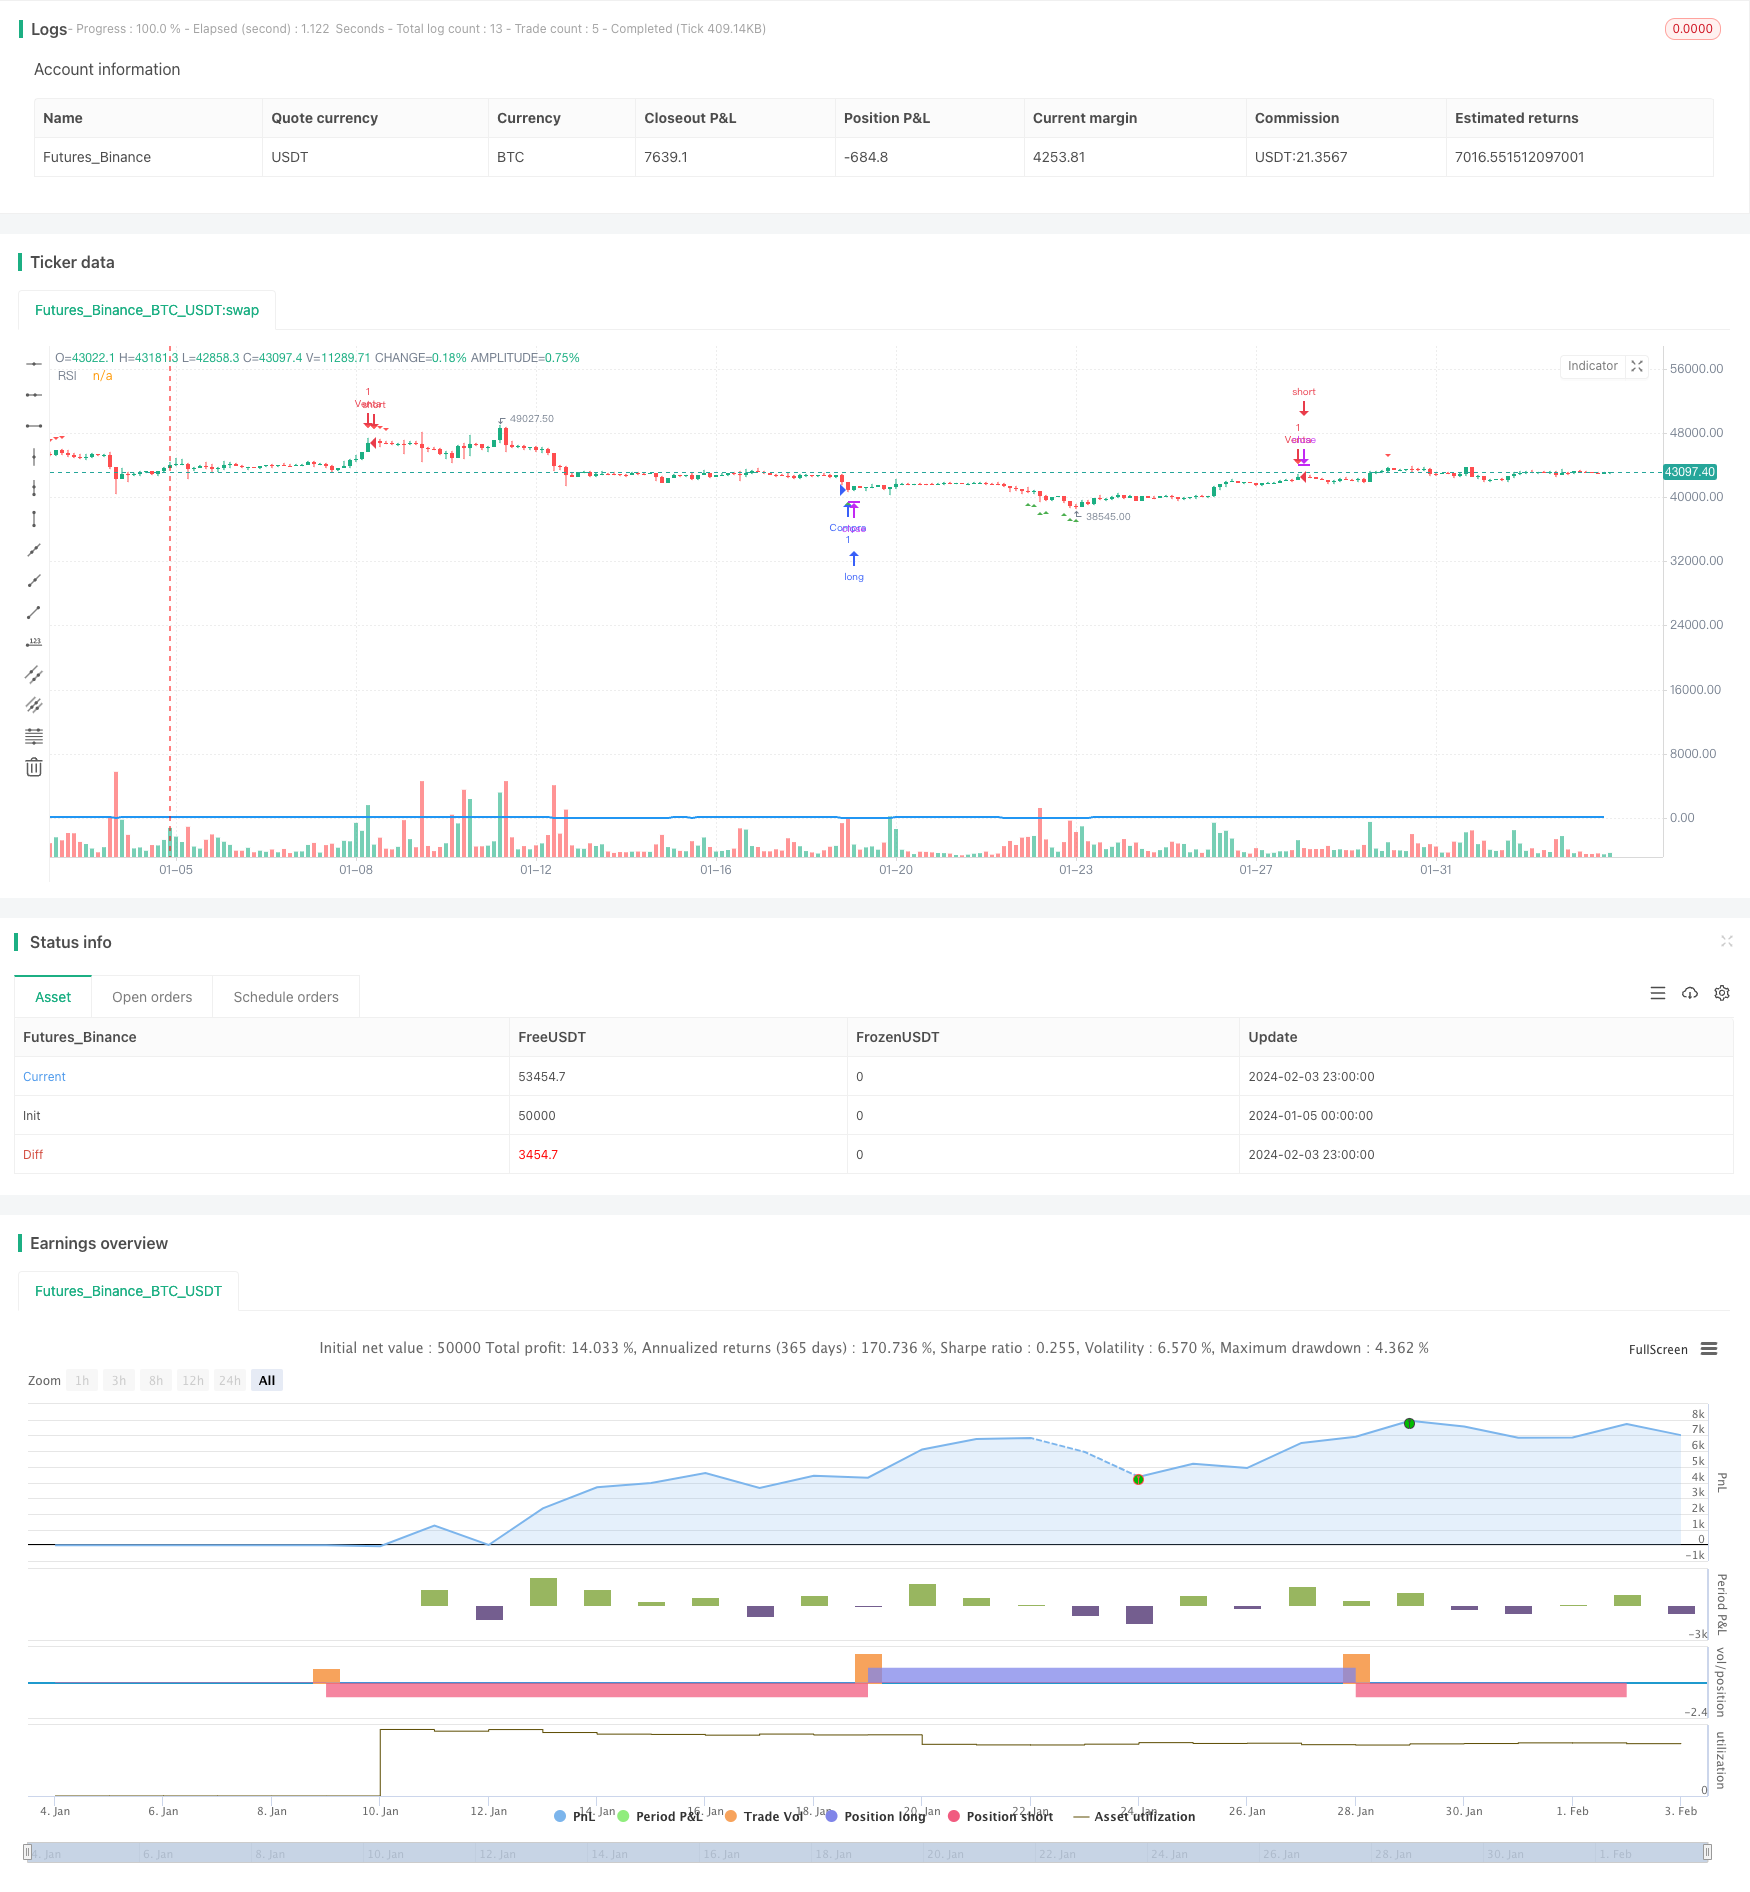
Overview
The Willy Wonka Breakout Strategy is a breakout trading strategy that integrates multiple technical indicators analysis, mainly utilizing RSI, Stochastics, EMA and price patterns to identify buying and selling opportunities.
Strategy Logic
The strategy makes judgments mainly based on the following key indicators:
- RSI Indicator - A buying signal is generated when the RSI breaks below 28, and a selling signal is generated when the RSI breaks above 72.
- Stochastics Indicator - A buying signal is generated when the fast K line breaks up from below the slow D line.
- EMA Indicator - A buying signal is generated when the price breaks above the EMA in an uptrend, and a selling signal is generated when the price breaks below the EMA in a downtrend.
- Price Patterns - Buying and selling signals are generated when hammer and engulfing patterns are formed at key support or resistance levels.
When multiple conditions are triggered at the same time, more effective buying or selling signals will occur.
The strategy adopts the Breakout concept to trade breakouts at trend reversal points, aiming to capture the acceleration stage of the intermediate trend and achieve excess returns.
Advantages
The strategy integrates multiple analytical tools for a more comprehensive and accurate judgment of market conditions. The main advantages are:
- Higher win rate and risk-reward ratio - Improved accuracy by combining multiple technical indicators analysis.
- Automatically avoid ranging markets - Indicators like RSI identify overbought and oversold conditions to reduce non-trend trading risks.
- Effective risk control - Timely stop loss and take profit help avoid risks like being trapped.
Risks
There are also some risks to this strategy that need to be guarded against:
- Parameters optimization risk - RSI parameters, MA parameters, etc. need to be optimized for different products and time periods, otherwise profits will be affected.
- Chasing momentum risk - Breakout signals have a certain lag. Avoid chasing momentum near the end of trends.
- Stop loss risk - Timely stop loss is critical, otherwise losses could be amplified.
The countermeasures are to rationally optimize parameters, strictly follow stop loss rules, and re-establish new positions after price breaks through EMA again.
Optimization Directions
The main aspects of optimization for this strategy:
- Optimize RSI Parameters - Find the optimal RSI length parameters and overbought/oversold threshold values for different products.
- Integrate More Indicators - Further improve judgment accuracy by combining indicators like MACD, SAR, Bollinger Bands.
- Dynamic Stop Loss and Take Profit - Utilize ATR and amplitude ratio for dynamic stops.
- Avoid Major Event Risks - Avoid trading around major economic data and events to reduce risks from market volatility.
Conclusion
In summary, the Willy Wonka Breakout Strategy is an integrated mean-reversion breakout trading strategy. It is suitable for products with obvious trend characteristics and generates trading signals at key points to capture intermediate trends. The strategy has great scalability and high practical value.
Parameters
| Name | Default | What it controls |
|---|---|---|
| v_input_1 | 14 | RSI Length |
| v_input_2 | true | Mostrar RSI en el gráfico |
Source Pine Script
/*backtest
start: 2024-01-05 00:00:00
end: 2024-02-04 00:00:00
period: 3h
basePeriod: 15m
exchanges: [{"eid":"Futures_Binance","currency":"BTC_USDT"}]
*/

//@version=5
strategy("Mi Estrategia", overlay=true)

// Parámetros
rsiLength = input(14, title="RSI Length")
overboughtLevel = 72
oversoldLevel = 28
showRsi = input(true, title="Mostrar RSI en el gráfico")

// Indicadores
rsiValue = ta.rsi(close, rsiLength)

// Condiciones de Compra y Venta
longCondition = rsiValue <= oversoldLevel
shortCondition = rsiValue >= overboughtLevel

// Ejecutar Operaciones
if (longCondition)
    strategy.entry("Compra", strategy.long)

if (shortCondition)
    strategy.entry("Venta", strategy.short)

// Configuración de la Estrategia
// Eliminamos las líneas relacionadas con Take Profit y Stop Loss

// Líneas en el Gráfico (Opcional)
plot(showRsi ? rsiValue : na, "RSI", color=color.blue, linewidth=2)

// Etiquetas de Buy y Sell en el RSI
plotshape(longCondition, color=color.green, style=shape.triangleup, title="Buy en RSI", location=location.belowbar)
plotshape(shortCondition, color=color.red, style=shape.triangledown, title="Sell en RSI", location=location.abovebar)
Published by ChaoZhang on the FMZ strategy square · last modified 2024-02-05. Collected in the Quant Trading Vault. Unvalidated research: re-test with your own data and costs before trusting it.
Build this with AgenKit
A spec is not a trading system. Paste this into your coding agent and AgenKit runs a specialist team — architecture, test-first build, risk gates, review — with paper trading on by default.
/agenkit build a production-grade trading bot with a backtest engine, risk controls and paper trading by default from strategies/Willy-Wonka-Breakout-Strategy.md- npx agenkit install engineering-kit in your project
- Paste the command into your agent and approve each phase
- Get tests, backtest, risk controls and a paper-trading switch
Understand it first
Before you run this, read the lesson behind the idea and how to backtest it honestly. Specs like this one are the survivors of an unknown number of trials; deflate their results accordingly.
Related specs
- Bull Market Tracking SystemPine Script · Breakout · 1h
- Dual Moving Average and MACD Combination Short term Trading StrategyPine Script · Breakout · 1h
- Momentum Breakout Strategy 428972Pine Script · Breakout · 1h
- Dual MACD Quantitative Trading StrategyPine Script · Breakout · 1h
- Multi Period Dynamic Signal Integration ICT Smart Structure Breakthrough StrategyPine Script · Breakout · 2d
- MACD Bollinger Turtle Trading StrategyPine Script · Breakout · 1d