Strategy vault / Trend following
YinYang RSI Volume Trend Trading Strategy
This strategy is a trend following strategy that utilizes a combination of Relative Strength Index (RSI) and volume to identify trend direction and follow trends. Key points include: 1. Using Volume Weighted Moving…
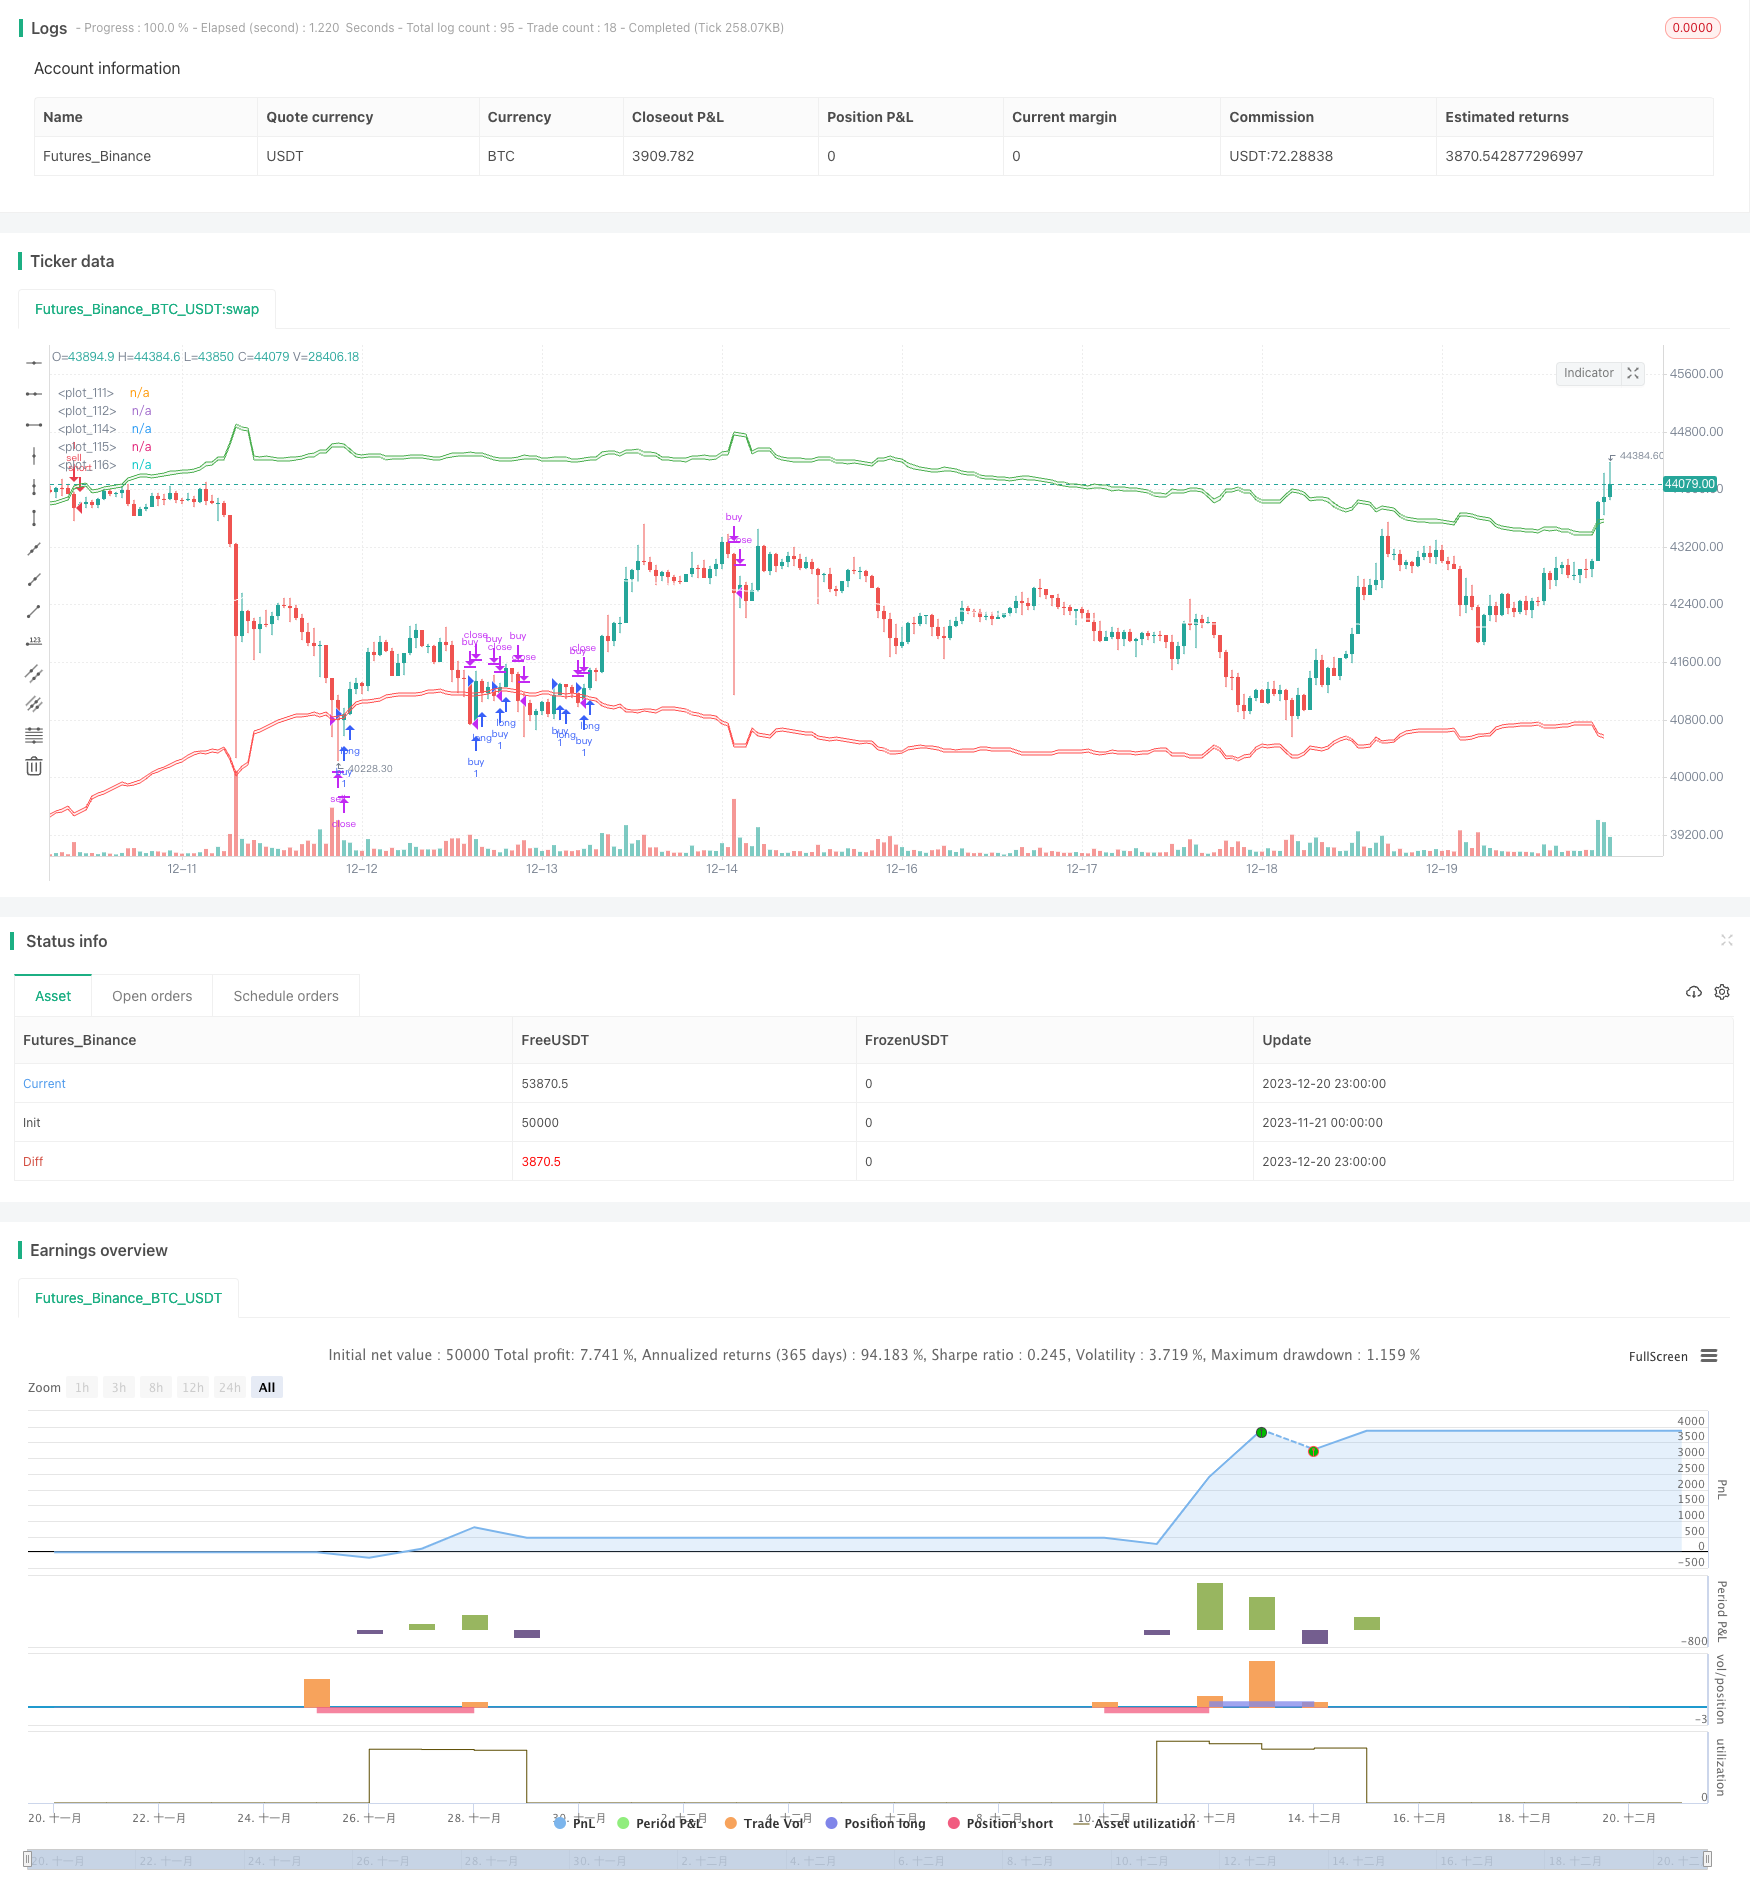
Overview
This strategy is a trend following strategy that utilizes a combination of Relative Strength Index (RSI) and volume to identify trend direction and follow trends. Key points include:
- Using Volume Weighted Moving Average to calculate midline and incorporate volume information to determine trend midpoint
- Setting up buy zone and sell zone based on midline
- Using RSI information to adjust range of buy zone and sell zone
- Setting stop loss and take profit after entering buy/sell zones
- Having re-entry mechanism
Strategy Logic
This strategy uses the following indicators and parameters:
- Midline: Volume Weighted Moving Average of highest and lowest prices in certain periods to determine midpoint of the trend
- RSI: Relative Strength Index calculated over certain periods, converted into 0-1 range
- Buy Zone: Midline plus RSI adjusted amount at certain ratio, long entry when price enters
- Sell Zone: Midline minus RSI adjusted amount at certain ratio, short entry when price enters
- Take Profit Line: Midline
- Stop Loss Line: Certain percentage below buy zone/above sell zone
When price enters buy or sell zone, a corresponding direction order will be opened. Stop loss and take profit lines are then set. When take profit or stop loss is triggered, position will be closed. A re-entry mechanism is also set so that new orders can be opened when signal triggers again if configured.
Advantages
The advantages of this strategy include:
- Using both RSI and volume to identify trends, improving accuracy
- RSI parameterized adjustment makes buy/sell zone adapt better to actual trend
- Volume information assigns higher weight to price actions, making midline more accurate
- Having stop loss mechanism to control risks
- Allows re-entry, reducing risks of false breakouts
Risks
There are also some risks:
- Improper RSI and volume parameters may affect buy/sell zone accuracy
- Midline may fail to accurately determine trend, causing false breakout
- Stop loss too wide may lead to higher losses
- Re-entry may cause over-trading
Solutions:
- Adjust RSI and volume cycle to fit market conditions
- Use other indicators to verify buy/sell signals
- Tighten stop loss to limit losses
- Limit trades per day to prevent over-trading
Optimization
This strategy can be optimized by:
- Trying other indicators to verify signals e.g. candlestick, volatility indicators etc
- Adding position sizing mechanisms e.g. pyramiding winners
- Using machine learning algorithms to improve buy/sell zone accuracy
- Evaluating optimum parameters for stop loss and take profit
- Parameters need separate test and optimization for different products
Conclusion
In conclusion, this is a quantitative trend following strategy utilizing RSI and volume indicators. It has dual verification system to identify signals, stop loss/profit take to control risks, and re-entry mechanism to improve profitability. With parameter tuning and algorithm optimization, it can become a very practical trend trading strategy.
Parameters
| Name | Default | What it controls |
|---|---|---|
| v_input_int_1 | 80 | Trend Length: |
| v_input_source_1_close | 0 | Purchase Source (Long and Short):: close | high | low | open | hl2 | hlc3 | hlcc4 | ohlc4 |
| v_input_source_2_close | 0 | Exit Source (Long and Short):: close | high | low | open | hl2 | hlc3 | hlcc4 | ohlc4 |
| v_input_bool_1 | true | Use Take Profit |
| v_input_bool_2 | true | Use Stop Loss |
| v_input_float_1 | 0.1 | Stoploss Multiplier %: |
| v_input_string_1 | 0 | Reset Purchase Availability After:: Entry | Stop Loss | None |
Source Pine Script
/*backtest
start: 2023-11-21 00:00:00
end: 2023-12-21 00:00:00
period: 1h
basePeriod: 15m
exchanges: [{"eid":"Futures_Binance","currency":"BTC_USDT"}]
*/

// This source code is subject to the terms of the Mozilla Public License 2.0 at https://mozilla.org/MPL/2.0/
// @@@@@@@@@@@@@@@@@@@@@@@@@@@@@@@@@@@@@@@@@@@@@@@@@@@@@@@@@@@@@@@@@@@@@@@@@@@@@@@@
// @@@@@@@@@@@@@@@@@@@@@@@@@@@@@@@@@@@@@@@@@@@@@@@@ @@@@@@@@@@@@@@@@@@@@@@@@@@@@@@@
// @@@@@@@@@@@@@@@@@@@@@@@@@@@@@@@@@@@@@@@@@@@@@@@@@@@@    ,@@@@@@@@@@@@@@@@@@@@@@@
// @@@@@@@@@@@@@@@@@@@@@@@@@@@@@@@@@@@@@@@@@@@@@@@@@@@@@@@      @@@@@@@@@@@@@@@@@@@
// @@@@@@@@@@@@@@@@@@@@@@@@@@@@@@@@@@@@@@@@@@@@@@@@@@@@@@@@@        @@@@@@@@@@@@@@@
// @@@@@@@@@@@@@@@@@@@@@@@@@@@@@@@@@@@@@@@@@@@@@@@@@@@@@@@@@@         @@@@@@@@@@@@@
// @@@@@@@@@@@@@@@@@@@@@@@@@@@@@@@@@@@@@@@@@@@@@@@@@@@@@@@@@@@           @@@@@@@@@@
// @@@@@@@@@@@@@@@@@@@@@@@@@@@@@@@@@@@@        .@@@@@@@@@@@@@@@            @@@@@@@@
// @@@@@@@@@@@@@@@@@@@@@@@@@@@@@@@@@@@          *@@@@@@@@@@@@@@             @@@@@@@
// @@@@@@@@@@@@@@@@@@@@@@@@@@@@@@@@@@@@         @@@@@@@@@@@@@@@               @@@@@
// @@@@@@@@@@@@@@@@@@@@@@@@@@@@@@@@@@@@@@     @@@@@@@@@@@@@@@@                 @@@@
// @@@@@@@@@@@@@@@@@@@@@@@@@@@@@@@@@@@@@@@@@@@@@@@@@@@@@@@@@@@                  @@@
// @@@@@@@@@@@@@@@@@@@@@@@@@@@@@@@@@@@@@@@@@@@@@@@@@@@@@@@@@.                    @@
// @@@@@@@@@@@@@@@@@@@@@@@@@@@@@@@@@@@@@@@@@@@@@@@@@@@@@@@@                      @@
// @@@@@@@@@@@@@@@@@@@@@@@@@@@@@@@@@@@@@@@@@@@@@@@@@@@@@.                         @
// @@@@@@@@@@@@@@@@@@@@@@@@@@@@@@@@@@@@@@@@@@@@@@@@@@                             @
// @@@@@@@@@@@@@@@@@@@@@@@@@@@@@@@@@@@@@@@,                                       @
// @@@@@@@@@@@@@@@@@@@@@@@@@@@@@@@                                                @
// @@@@@@@@@@@@@@@@@@@@@@@@@@@                                                    @
// @@@@@@@@@@@@@@@@@@@@@@@@@                                                     @@
// @@@@@@@@@@@@@@@@@@@@@@@                                                       @@
// @@@@@@@@@@@@@@@@@@@@@@                                                       @@@
// @@@@@@@@@@@@@@@@@@@@@*                @@@@@                                 @@@@
// @@@@@@@@@@@@@@@@@@@@@               @@@@@@@@@                              @@@@@
// @@@@@@@@@@@@@@@@@@@@@              @@@@@@@@@@@                           @@@@@@@
// @@@@@@@@@@@@@@@@@@@@@               @@@@@@@@%                           @@@@@@@@
// @@@@@@@@@@@@@@@@@@@@@@                                                @@@@@@@@@@
// @@@@@@@@@@@@@@@@@@@@@@@                                            @@@@@@@@@@@@@
// @@@@@@@@@@@@@@@@@@@@@@@@                                        %@@@@@@@@@@@@@@@
// @@@@@@@@@@@@@@@@@@@@@@@@@@                                   @@@@@@@@@@@@@@@@@@@
// @@@@@@@@@@@@@@@@@@@@@@@@@@@@@                           @@@@@@@@@@@@@@@@@@@@@@@@
// @@@@@@@@@@@@@@@@@@@@@@@@@@@@@@@@@                @@@@@@@@@@@@@@@@@@@@@@@@@@@@@@@
// © YinYangAlgorithms

//@version=5
strategy("YinYang RSI Volume Trend Strategy", shorttitle="YinYang RSVT Strategy", overlay=true )
// ~~~~~~~~~~~ INPUTS ~~~~~~~~~~~ //
len = input.int(80, "Trend Length:", tooltip="How far back should we span this indicator?\nThis length effects all lengths of the indicator")
purchaseSrc = input.source(close, "Purchase Source (Long and Short):", tooltip="What source needs to exit the purchase zone for a purchase to happen?")
exitSrc = input.source(close, "Exit Source (Long and Short):", tooltip="What source needs to hit a exit condition to stop the trade (Take profit, Stop Loss or hitting the other sides Purchase Zone)?")
useTakeProfit = input.bool(true, "Use Take Profit", tooltip="Should we take profit IF we cross the basis line and then cross it AGAIN?")
useStopLoss = input.bool(true, "Use Stop Loss", tooltip="Stop loss will ensure you don't lose too much if its a bad call")
stopLossMult = input.float(0.1, "Stoploss Multiplier %:", tooltip="How far from the purchase lines should the stop loss be")
resetCondition = input.string("Entry", "Reset Purchase Availability After:", options=["Entry", "Stop Loss", "None"],
 tooltip="If we reset after a condition is hit, this means we can purchase again when the purchase condition is met. \n" +
 "Otherwise, we will only purchase after an opposite signal has appeared.\n" +
 "Entry: means when the close enters the purchase zone (buy or sell).\n" +
 "Stop Loss: means when the close hits the stop loss location (even when were out of a trade)\n" +
 "This allows us to get more trades and also if our stop loss initally was hit but it WAS a good time to purchase, we don't lose that chance.")

// ~~~~~~~~~~~ VARIABLES ~~~~~~~~~~~ //
var bool longStart = na
var bool longAvailable = na
var bool longTakeProfitAvailable = na
var bool longStopLoss = na
var bool shortStart = na
var bool shortAvailable = na
var bool shortTakeProfitAvailable = na
var bool shortStopLoss = na

resetAfterStopLoss = resetCondition == "Stop Loss"
resetAfterEntry = resetCondition == "Entry"

// ~~~~~~~~~~~ CALCULATIONS ~~~~~~~~~~~ //
// Mid Line
midHigh = ta.vwma(ta.highest(high, len), len)
midLow = ta.vwma(ta.lowest(low, len), len)
mid = math.avg(midHigh, midLow)
midSmoothed = ta.ema(mid, len)

//Volume Filtered
avgVol = ta.vwma(volume, len)
volDiff = volume / avgVol
midVolSmoothed = ta.vwma(midSmoothed * volDiff, 3)

//RSI Filtered
midDifference = ta.sma(midHigh - midLow, len)
midRSI = ta.rsi(midVolSmoothed, len) * 0.01
midAdd = midRSI * midDifference

//Calculate Zones
purchaseZoneHigh = midSmoothed + midAdd
purchaseZoneLow = midSmoothed - midAdd
purchaseZoneBasis = math.avg(purchaseZoneHigh, purchaseZoneLow)

//Create Stop Loss Locations
stopLossHigh = purchaseZoneHigh * (1 + (stopLossMult * 0.01))
stopLossLow = purchaseZoneLow * (1 - (stopLossMult * 0.01))

// ~~~~~~~~~~~ PURCHASE CALCULATIONS ~~~~~~~~~~~ //
//Long
longEntry = ta.crossunder(purchaseSrc, purchaseZoneLow)
longStart := ta.crossover(purchaseSrc, purchaseZoneLow) and longAvailable
longAvailable := ta.crossunder(purchaseSrc, purchaseZoneHigh) or (resetAfterStopLoss and longStopLoss) or (resetAfterEntry and longEntry) ? true : longStart ? false : longAvailable[1]
longEnd = ta.crossover(exitSrc, purchaseZoneHigh)
longStopLoss := ta.crossunder(exitSrc, stopLossLow)
longTakeProfitAvailable := ta.crossover(exitSrc, purchaseZoneBasis) ? true : longEnd ? false : longTakeProfitAvailable[1]
longTakeProfit = ta.crossunder(exitSrc, purchaseZoneBasis) and longTakeProfitAvailable

//Short
shortEntry = ta.crossover(purchaseSrc, purchaseZoneHigh)
shortStart := ta.crossunder(purchaseSrc, purchaseZoneHigh) and shortAvailable
shortAvailable := ta.crossover(purchaseSrc, purchaseZoneLow) or (resetAfterStopLoss and shortStopLoss) or (resetAfterEntry and shortEntry)? true : shortStart ? false : shortAvailable[1]
shortEnd = ta.crossunder(exitSrc, purchaseZoneLow)
shortStopLoss := ta.crossover(exitSrc, stopLossHigh)
shortTakeProfitAvailable := ta.crossunder(exitSrc, purchaseZoneBasis) ? true : shortEnd ? false : shortTakeProfitAvailable[1]
shortTakeProfit = ta.crossover(exitSrc, purchaseZoneBasis) and shortTakeProfitAvailable

// ~~~~~~~~~~~ PLOTS ~~~~~~~~~~~ //
shortLine = plot(purchaseZoneHigh, color=color.green)
shortStopLossLine = plot(stopLossHigh, color=color.green) //color=color.rgb(0, 97, 3)
fill(shortLine, shortStopLossLine, color = color.new(color.green, 90))
plot(purchaseZoneBasis, color=color.white)
longLine = plot(purchaseZoneLow, color=color.red)
longStopLossLine = plot(stopLossLow, color=color.red) //color=color.rgb(105, 0, 0)
fill(longLine, longStopLossLine, color=color.new(color.red, 90))

// ~~~~~~~~~~~ STRATEGY ~~~~~~~~~~~ //
if (longStart)
    strategy.entry("buy", strategy.long)
else if (longEnd or (useStopLoss and longStopLoss) or (useTakeProfit and longTakeProfit))
    strategy.close("buy")

if (shortStart)
    strategy.entry("sell", strategy.short)
else if (shortEnd or (useStopLoss and shortStopLoss) or (useTakeProfit and shortTakeProfit))
    strategy.close("sell")

// ~~~~~~~~~~~ ALERTS ~~~~~~~~~~~ //
if longStart or (longEnd or (useStopLoss and longStopLoss) or (useTakeProfit and longTakeProfit)) or shortStart or (shortEnd or (useStopLoss and shortStopLoss) or (useTakeProfit and shortTakeProfit))
alert("{{strategy.order.action}} | {{ticker}} | {{close}}", alert.freq_once_per_bar)Published by ChaoZhang on the FMZ strategy square · last modified 2023-12-22. Collected in the Quant Trading Vault. Unvalidated research: re-test with your own data and costs before trusting it.
Build this with AgenKit
A spec is not a trading system. Paste this into your coding agent and AgenKit runs a specialist team — architecture, test-first build, risk gates, review — with paper trading on by default.
/agenkit build a production-grade trading bot with a backtest engine, risk controls and paper trading by default from strategies/YinYang-RSI-Volume-Trend-Trading-Strategy.md- npx agenkit install engineering-kit in your project
- Paste the command into your agent and approve each phase
- Get tests, backtest, risk controls and a paper-trading switch
Understand it first
Before you run this, read the lesson behind the idea and how to backtest it honestly. Specs like this one are the survivors of an unknown number of trials; deflate their results accordingly.
Related specs
- Fixed Range Volume Profile And Anchored VWAP Trend Identification Strategy With Dynamic Stop LossPine Script · Trend following · 1h
- Dynamic ATR Trailing Stop with EMA Cross Combination StrategyPine Script · Trend following · 2h
- Five Minute Triple Confirmation Trend Trading Strategy with Risk Management SystemPine Script · Trend following · 1m
- Moving Average Crossover Strategy 427164Pine Script · Trend following · 10m
- Moving Average Crossover Strategy 430371Pine Script · Trend following · 1h
- Low Timeframe High Leverage Trend Following Trading StrategyPine Script · Trend following · 1h