Z Score Momentum Trading System with ATR Stop Loss and Risk Reward Optimization
This strategy is a comprehensive trading system that combines multiple technical indicators, primarily based on Z-score to measure volume and candlestick body size anomalies, while using ATR (Average True Range) for…
Overview
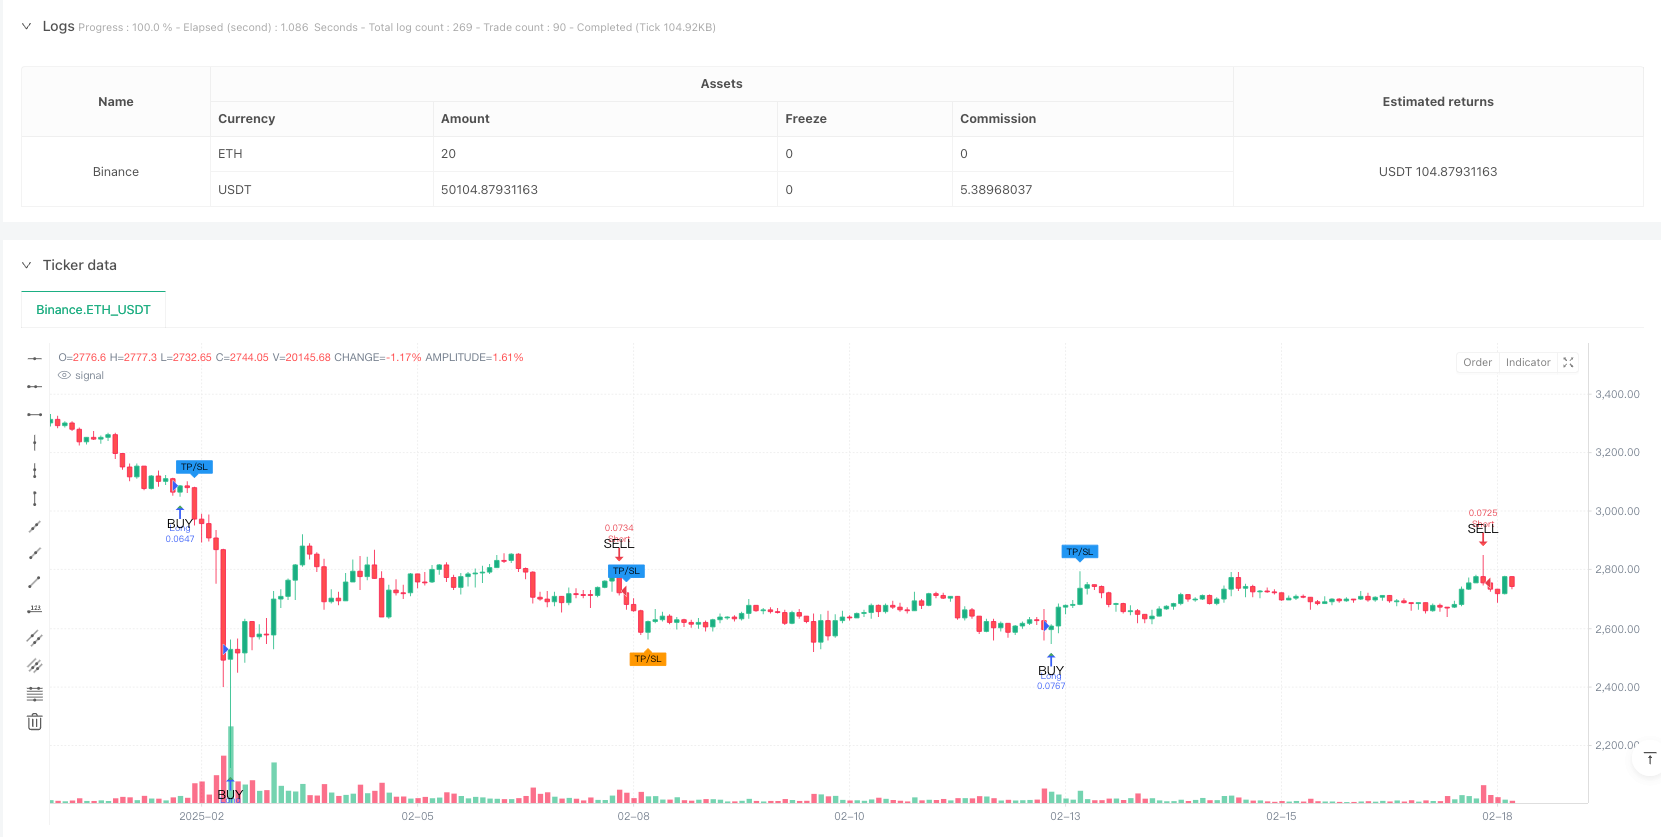
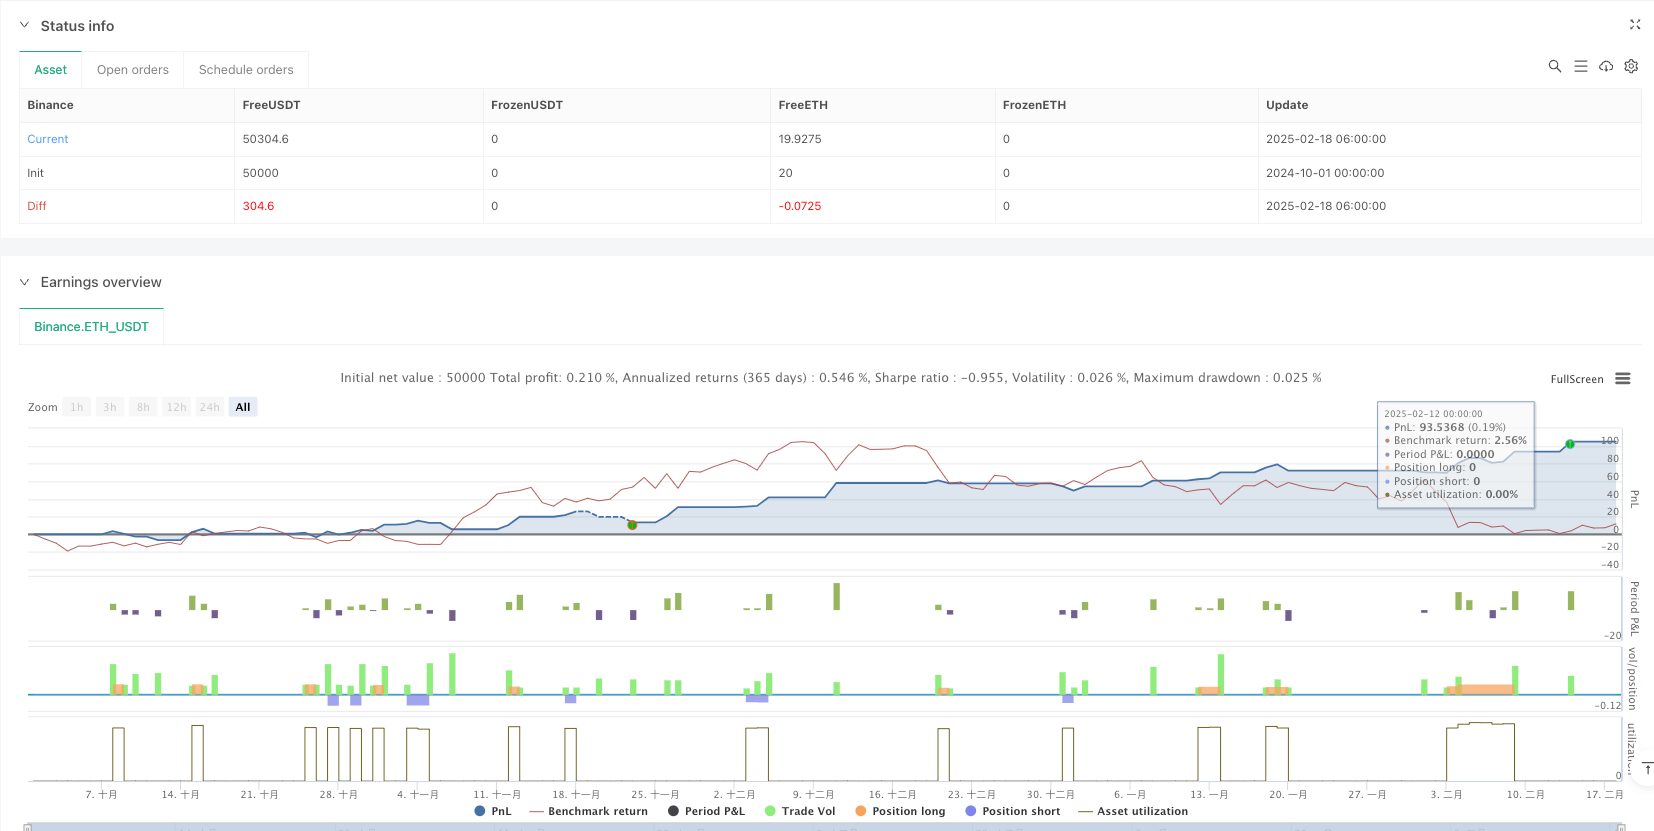
This strategy is a comprehensive trading system that combines multiple technical indicators, primarily based on Z-score to measure volume and candlestick body size anomalies, while using ATR (Average True Range) for dynamic stop-loss placement. The system also integrates Risk-Reward Ratio (RR) for profit target optimization and provides reliable trading signals through multi-dimensional technical analysis.
Strategy Principles
The core logic of the strategy is based on several key components:
- Z-score Analysis: Calculates standard deviations of trading volume and candlestick bodies to identify market activity anomalies
- Trend Confirmation: Analyzes adjacent candlestick highs/lows and closing prices to confirm trend direction
- ATR Stop-Loss: Uses dynamic ATR values for stop-loss placement, providing flexible risk control
- Risk-Reward Ratio: Automatically calculates profit targets based on the set RR ratio
- Visual Markers: Indicates trading signals and key price levels on the chart
Strategy Advantages
- Multi-dimensional Signal Confirmation: Combines volume, price momentum, and trend direction for improved signal reliability
- Dynamic Risk Management: Implements adaptive stop-loss through ATR, better accommodating market volatility
- Flexible Parameter Configuration: Allows adjustment of Z-score thresholds, ATR multiplier, and risk-reward ratio
- Precise Entry Timing: Uses Z-score anomalies to identify key trading opportunities
- Clear Visualization: Clearly marks entry points, stop-loss levels, and profit targets on the chart
Strategy Risks
- Parameter Sensitivity: Z-score thresholds and ATR multiplier settings directly affect trading frequency and risk control
- Market Environment Dependency: May generate fewer signals in low-volatility environments
- Computational Complexity: Multiple indicator calculations may lead to signal generation delays
- Slippage Risk: May face execution price discrepancies from signal prices in fast markets
- False Breakout Risk: Potential for triggering incorrect breakout signals in ranging markets
Strategy Optimization Directions
- Market Environment Filtering: Add volatility filters to dynamically adjust parameters in different market conditions
- Signal Confirmation Mechanism: Introduce additional technical indicators for cross-validation, such as RSI or MACD
- Position Management Optimization: Implement dynamic position sizing based on volatility and account risk
- Multiple Timeframe Analysis: Integrate higher timeframe trend confirmation to improve trade success rate
- Signal Filtering Enhancement: Add additional filtering conditions to reduce false signals
Summary
This strategy builds a complete trading system by combining Z-score analysis, ATR stop-loss, and risk-reward optimization. The system's strengths lie in its multi-dimensional signal confirmation and flexible risk management, while attention must be paid to parameter settings and market environment impacts. Through the suggested optimization directions, the strategy can further enhance its stability and adaptability.
Source Pine Script
/*backtest
start: 2024-10-01 00:00:00
end: 2025-02-18 08:00:00
period: 2h
basePeriod: 2h
exchanges: [{"eid":"Binance","currency":"ETH_USDT"}]
*/

//@version=5
strategy("admbrk | Candle Color & Price Alarm with ATR Stop", overlay=true, initial_capital=50, default_qty_type=strategy.cash, default_qty_value=200, commission_type=strategy.commission.percent, commission_value=0.05, pyramiding=3)

// **Risk/Reward ratio (RR) as input**
rr = input.float(2.0, title="Risk/Reward Ratio (RR)", step=0.1)

// **Z-score calculation function**
f_zscore(src, len) =>
    mean = ta.sma(src, len)
    std = ta.stdev(src, len)
    (src - mean) / std

// **Z-score calculations**
len = input(20, "Z-Score MA Length")
z1 = input.float(1.5, "Threshold z1", step=0.1)
z2 = input.float(2.5, "Threshold z2", step=0.1)

z_volume = f_zscore(volume, len)
z_body = f_zscore(math.abs(close - open), len)

i_src = input.string("Volume", title="Source", options=["Volume", "Body size", "Any", "All"])

float z = na
if i_src == "Volume"
    z := z_volume
else if i_src == "Body size"
    z := z_body
else if i_src == "Any"
    z := math.max(z_volume, z_body)
else if i_src == "All"
    z := math.min(z_volume, z_body)

// **Determine trend direction**
green = close >= open
red = close < open

// **Long and Short signals**
longSignal = barstate.isconfirmed and red[1] and low < low[1] and green
shortSignal = barstate.isconfirmed and green[1] and high > high[1] and red

long = longSignal and (z >= z1)
short = shortSignal and (z >= z1)

// **ATR calculation (for ATR Stop)**
atrLength = input.int(14, title="ATR Length")
atrMultiplier = input.float(1.5, title="ATR Stop Multiplier")
atrValue = ta.atr(atrLength)

// **ATR-based stop-loss calculation**
long_atr_stop = close - atrValue * atrMultiplier
short_atr_stop = close + atrValue * atrMultiplier

// **Stop-loss setting (set to the lowest/highest wick of the last two bars)**
long_sl = ta.lowest(low, 2)  // Long stop-loss (lowest of the last 2 bars)
short_sl = ta.highest(high, 2) // Short stop-loss (highest of the last 2 bars)

// **Take-profit calculation (with RR)**
long_tp = close + (close - long_sl) * rr
short_tp = close - (short_sl - close) * rr

triggerAlarm(symbol)=>
    status = close
    var string message = na
    alarmMessageJSON = syminfo.ticker + message +"\\n" + "Price: " + str.tostring(status)

if long
    // Open Long position
    strategy.entry("Long", strategy.long)
    strategy.exit("Long Exit", from_entry="Long", stop=math.max(long_sl, long_atr_stop), limit=long_tp)


if short
    // Open Short position
    strategy.entry("Short", strategy.short)
    strategy.exit("Short Exit", from_entry="Short", stop=math.min(short_sl, short_atr_stop), limit=short_tp)


// **Coloring the candles (BUY = Green, SELL = Red)**
barcolor(long ? color.green : short ? color.red : na)

// **Add entry/exit markers on the chart**
plotshape(long, title="BUY Signal", location=location.belowbar, color=color.green, style=shape.triangleup, size=size.small, text="BUY")
plotshape(short, title="SELL Signal", location=location.abovebar, color=color.red, style=shape.triangledown, size=size.small, text="SELL")

// **Plot TP and SL markers on exits**
exitLong = strategy.position_size < strategy.position_size[1] and strategy.position_size[1] > 0
exitShort = strategy.position_size > strategy.position_size[1] and strategy.position_size[1] < 0

plotshape(exitLong, title="Long Exit", location=location.abovebar, color=color.blue, style=shape.labeldown, size=size.tiny, text="TP/SL")
plotshape(exitShort, title="Short Exit", location=location.belowbar, color=color.orange, style=shape.labelup, size=size.tiny, text="TP/SL")

// **Add alerts**
alertcondition(long, title="Long Signal", message="Long signal triggered!")
alertcondition(short, title="Short Signal", message="Short signal triggered!")
Published by ianzeng123 on the FMZ strategy square · last modified 2025-02-27. Collected in the Quant Trading Vault. Unvalidated research: re-test with your own data and costs before trusting it.
Build this with AgenKit
A spec is not a trading system. Paste this into your coding agent and AgenKit runs a specialist team — architecture, test-first build, risk gates, review — with paper trading on by default.
/agenkit build a production-grade trading bot with a backtest engine, risk controls and paper trading by default from strategies/Z-Score-Momentum-Trading-System-with-ATR-Stop-Loss-and-Risk-Reward-Optimization.md- npx agenkit install engineering-kit in your project
- Paste the command into your agent and approve each phase
- Get tests, backtest, risk controls and a paper-trading switch
Understand it first
Before you run this, read the lesson behind the idea and how to backtest it honestly. Specs like this one are the survivors of an unknown number of trials; deflate their results accordingly.
Related specs
- KST EMA Momentum Trend Following StrategyPine Script · Momentum · 1d
- Multi Indicator Trend Momentum Trading Strategy with Dynamic Risk Management SystemPine Script · Momentum · 1h
- Multi Indicator Trend Momentum Trading Strategy An Optimized Quantitative Trading System Based on Bollinger Bands Fibonacci and ATRPine Script · Momentum · 1h
- Multi Trend Momentum Crossover Strategy with Volatility Optimization SystemPine Script · Momentum · 1d
- Dynamic Risk Managed Rapid SMA Crossover Momentum Capture StrategyPine Script · Momentum · 2d
- Multi Indicator Comprehensive Analysis Quantitative Trading Strategy Trend Momentum and Volatility Collaborative Prediction ModelPine Script · Momentum · 3m