Strategy vault / Trend following
Z Score Trend Following Strategy
The "Z-Score Trend Following Strategy" leverages the Z-score, a statistical measure that gauges the deviation of a price from its moving average, normalized against its standard deviation. This strategy stands out…
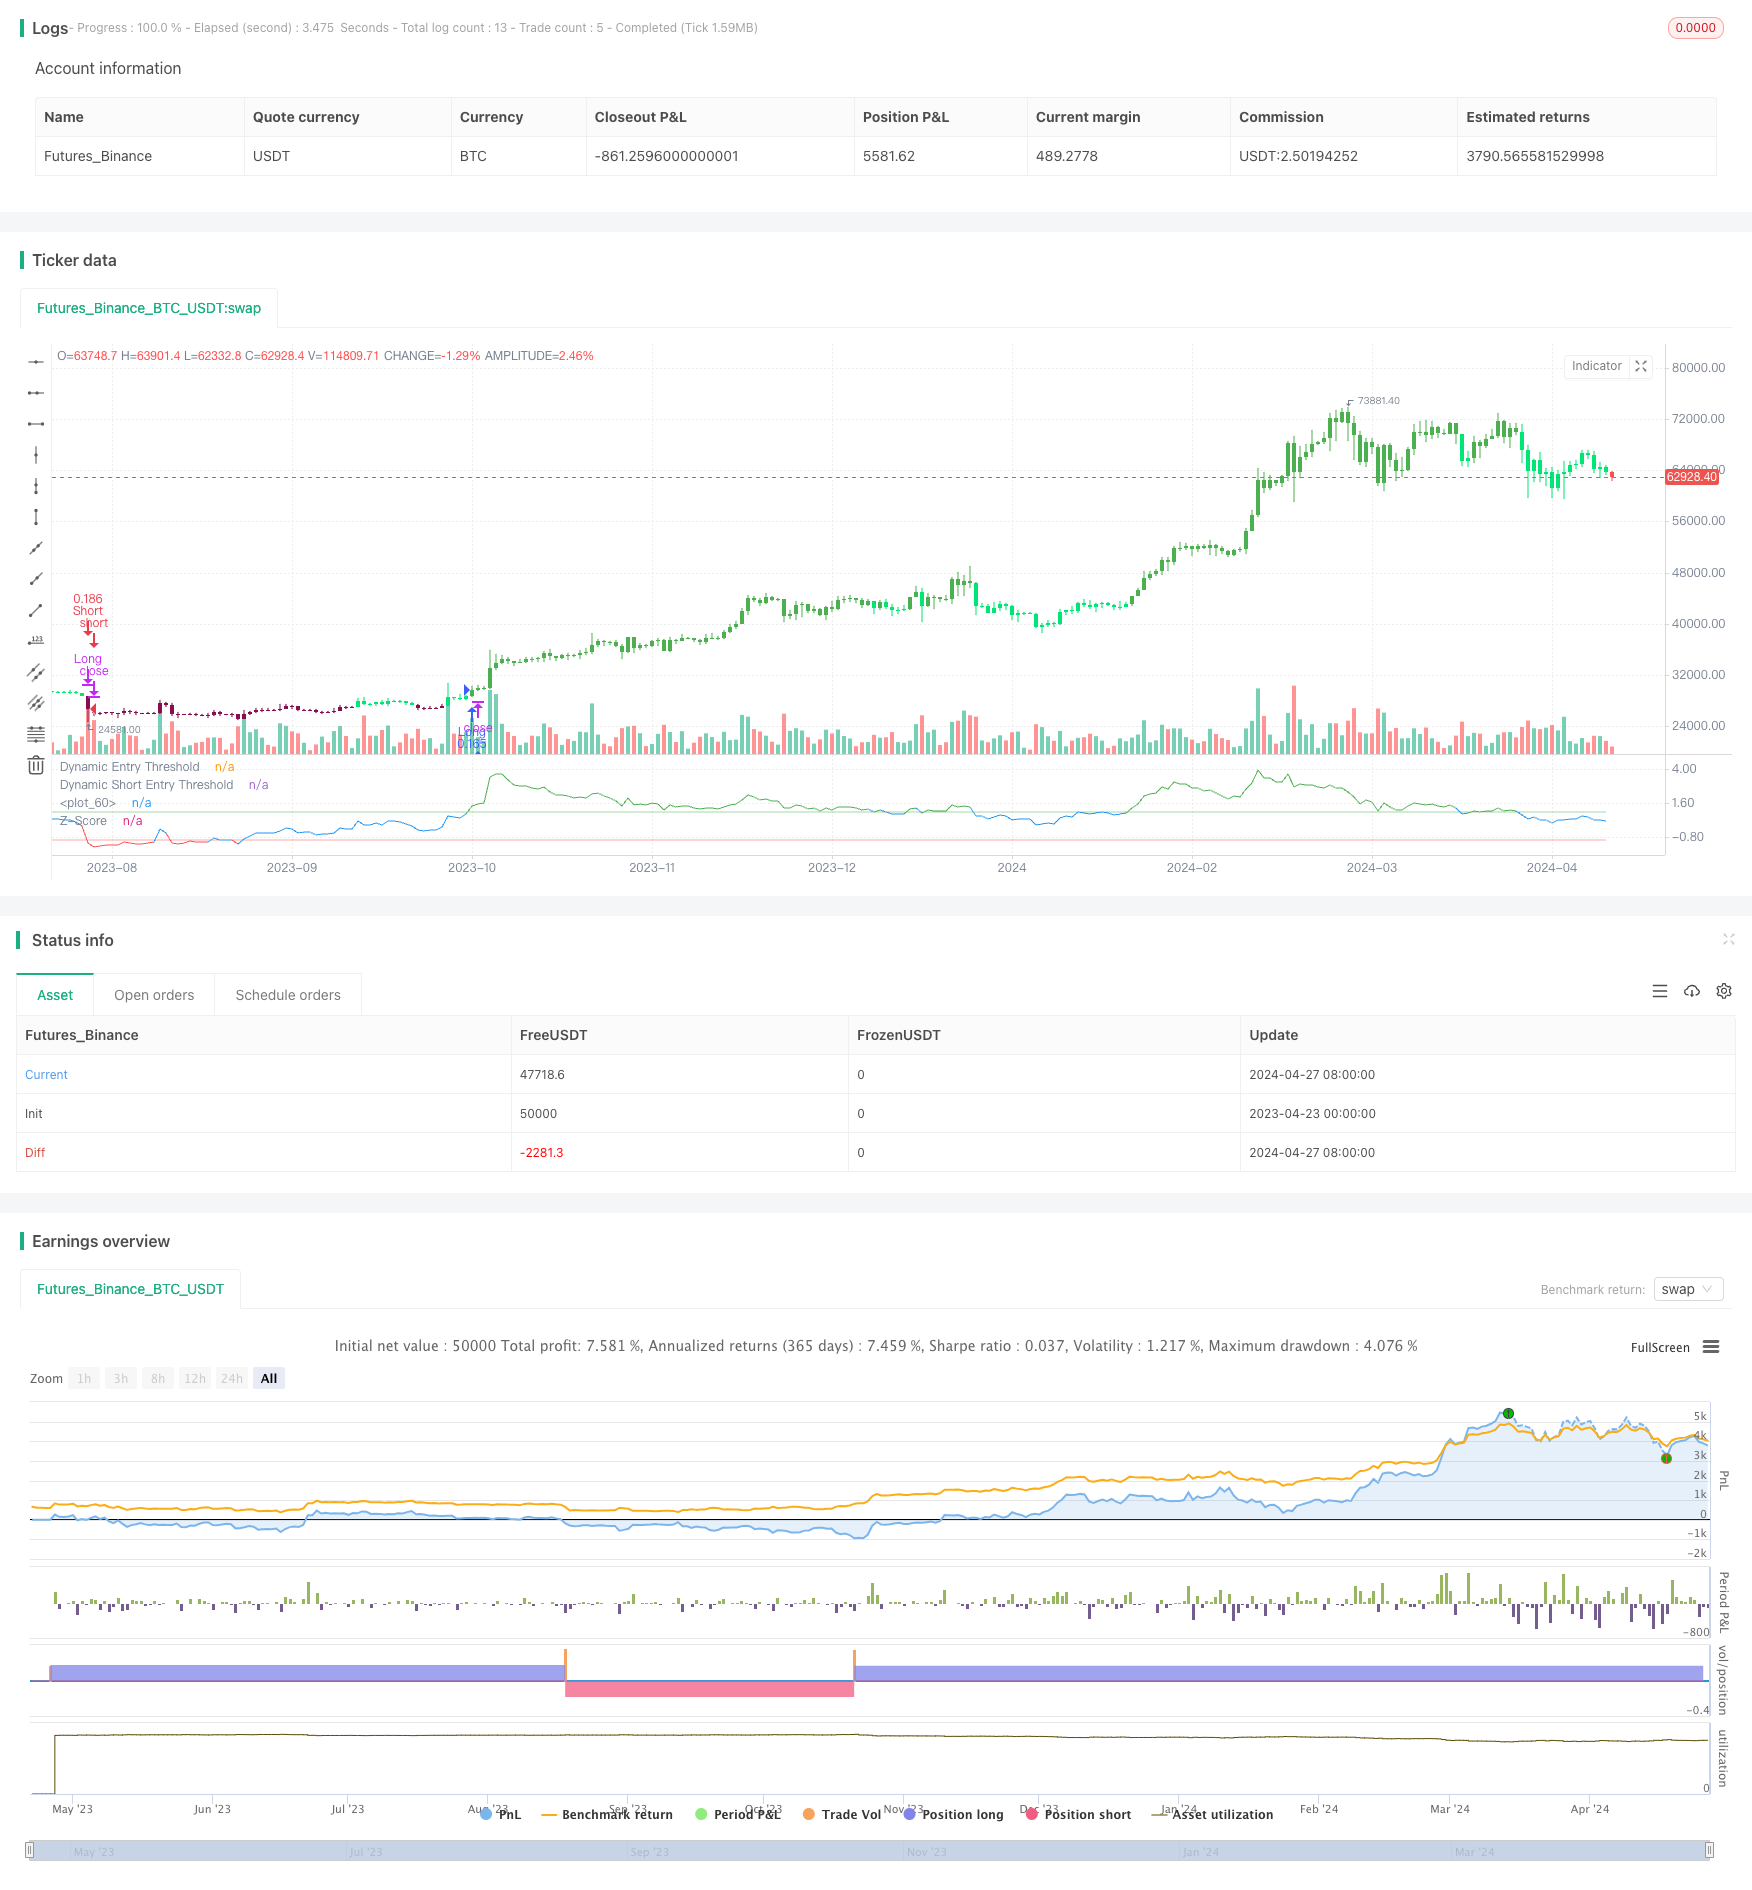
Overview
The "Z-Score Trend Following Strategy" leverages the Z-score, a statistical measure that gauges the deviation of a price from its moving average, normalized against its standard deviation. This strategy stands out due to its simplicity and effectiveness, particularly in markets where price movements often revert to a mean. Unlike more complex systems that might rely on a multitude of indicators, the Z-Trend strategy focuses on clear, statistically significant price movements, making it ideal for traders who prefer a streamlined, data-driven approach.
Strategy Principle
Central to this strategy is the calculation of the Z-score. It is derived by taking the difference between the current price and the Exponential Moving Average (EMA) of the price over a user-defined length, then dividing this by the standard deviation of the price over the same length:
z = (x - μ) / σ
Where x is the current price, μ is the EMA mean, and σ is the standard deviation.
Trading signals are generated based on the Z-score crossing predefined thresholds:
- Long Entry: When the Z-score crosses above the positive threshold.
- Long Exit: When the Z-score falls below the negative threshold.
- Short Entry: When the Z-score falls below the negative threshold.
- Short Exit: When the Z-score rises above the positive threshold.
Strategy Advantages
- Simplicity and effectiveness: The strategy relies on few parameters, is easy to understand and implement, while being highly effective in capturing trending opportunities.
- Statistical foundation: The Z-score, as an established statistical tool, provides a solid theoretical basis for the strategy.
- Adaptability: By adjusting parameters such as thresholds, EMA, and standard deviation calculation periods, the strategy can flexibly adapt to various trading styles and market environments.
- Clear signals: Trading signals based on Z-score crossovers are straightforward, facilitating quick decision-making and execution.
Strategy Risks
- Parameter sensitivity: Inappropriate parameter settings (e.g., overly high or low thresholds) can distort trading signals, leading to missed opportunities or losses.
- Trend identification: In choppy or rangebound markets, the strategy may face frequent false signals and underperform.
- Lag effect: As a trend-following strategy, its entry and exit signals inherently lag, potentially missing optimal timing.
These risks can be managed and mitigated through ongoing market analysis, parameter optimization, and prudent implementation based on backtesting.
Strategy Optimization Directions
- Dynamic thresholds: Introducing volatility-based dynamic thresholds can effectively adapt to different market states and enhance signal quality.
- Indicator combinations: Integrating other technical indicators like RSI, MACD, etc., for secondary confirmation of trading signals can improve reliability.
- Position sizing: Incorporating position control mechanisms such as ATR can help timely reduce exposure in choppy markets and increase it in trending ones, optimizing the risk-reward ratio.
- Multiple timeframes: Calculating Z-scores across multiple timeframes can capture trends at different levels, enriching the strategy's dimensions.
Summary
The "Z-Score Trend Following Strategy," with its simplicity, robustness, and flexibility, offers a unique perspective for capturing trending opportunities. Through proper parameter settings, prudent risk management, and continuous optimization, this strategy can be a powerful tool for quantitative traders to navigate the ever-changing markets with confidence.
Parameters
| Name | Default | What it controls |
|---|---|---|
| v_input_string_1 | 0 | Trading Direction: Both | Short | Long |
| v_input_int_1 | 100 | Standard Deviation Length |
| v_input_int_2 | 100 | Average Length |
| v_input_float_1 | true | Threshold |
| v_input_1 | true | Bar Color |
| v_input_2_close | 0 | Source: close | high | low | open | hl2 | hlc3 | hlcc4 | ohlc4 |
Source Pine Script
/*backtest
start: 2023-04-23 00:00:00
end: 2024-04-28 00:00:00
period: 1d
basePeriod: 1h
exchanges: [{"eid":"Futures_Binance","currency":"BTC_USDT"}]
*/

// This Pine Script™ code is subject to the terms of the Mozilla Public License 2.0 at https://mozilla.org/MPL/2.0/
// © PresentTrading

// This strategy employs a statistical approach by using a Z-score, which measures the deviation of the price from its moving average normalized by the standard deviation.
// Very simple and effective approach

//@version=5
strategy('Price Based Z-Trend - strategy [presentTrading]',shorttitle = 'Price Based Z-Trend - strategy [presentTrading]', overlay=false, precision=3,
         commission_value=0.1, commission_type=strategy.commission.percent, slippage=1,
         currency=currency.USD, default_qty_type=strategy.percent_of_equity, default_qty_value=10, initial_capital=10000)

// User-definable parameters for the Z-score calculation and bar coloring
tradeDirection = input.string("Both", "Trading Direction", options=["Long", "Short", "Both"]) // User selects trading direction

priceDeviationLength = input.int(100, "Standard Deviation Length", step=1) // Length for standard deviation calculation
priceAverageLength = input.int(100, "Average Length", step=1) // Length for moving average calculation
Threshold = input.float(1, "Threshold", step=0.1) // Number of standard deviations for Z-score threshold
priceBar = input(title='Bar Color', defval=true) // Toggle for coloring price bars based on Z-score


// Z-score calculation based on user input for the price source (typically the closing price)
priceSource = input(close, title="Source")
priceZScore = (priceSource - ta.ema(priceSource, priceAverageLength)) / ta.stdev(priceSource, priceDeviationLength) // Z-score calculation

// Conditions for entering and exiting trades based on Z-score crossovers
priceLongCondition = ta.crossover(priceZScore, Threshold) // Condition to enter long positions
priceExitLongCondition = ta.crossunder(priceZScore, -Threshold) // Condition to exit long positions

longEntryCondition = ta.crossover(priceZScore, Threshold)
longExitCondition = ta.crossunder(priceZScore, -Threshold)
shortEntryCondition = ta.crossunder(priceZScore, -Threshold)
shortExitCondition = ta.crossover(priceZScore, Threshold)


// Strategy conditions and execution based on Z-score crossovers and trading direction
if (tradeDirection == "Long" or tradeDirection == "Both") and longEntryCondition
    strategy.entry("Long", strategy.long) // Enter a long position

if (tradeDirection == "Long" or tradeDirection == "Both") and longExitCondition
    strategy.close("Long") // Close the long position

if (tradeDirection == "Short" or tradeDirection == "Both") and shortEntryCondition
    strategy.entry("Short", strategy.short) // Enter a short position

if (tradeDirection == "Short" or tradeDirection == "Both") and shortExitCondition
    strategy.close("Short") // Close the short position


// Dynamic Thresholds Visualization using 'plot'
plot(Threshold, "Dynamic Entry Threshold", color=color.new(color.green, 50))
plot(-Threshold, "Dynamic Short Entry Threshold", color=color.new(color.red, 50))


// Color-coding Z-Score
priceZScoreColor = priceZScore > Threshold ? color.green :
              priceZScore < -Threshold ? color.red : color.blue
plot(priceZScore, "Z-Score", color=priceZScoreColor)

// Lines
hline(0, color=color.rgb(255, 255, 255, 50), linestyle=hline.style_dotted)

// Bar Color
priceBarColor = priceZScore > Threshold ? color.green :
           priceZScore > 0 ? color.lime :
           priceZScore < Threshold ? color.maroon :
           priceZScore < 0 ? color.red : color.black
barcolor(priceBar ? priceBarColor : na)
Published by ChaoZhang on the FMZ strategy square · last modified 2024-04-29. Collected in the Quant Trading Vault. Unvalidated research: re-test with your own data and costs before trusting it.
Build this with AgenKit
A spec is not a trading system. Paste this into your coding agent and AgenKit runs a specialist team — architecture, test-first build, risk gates, review — with paper trading on by default.
/agenkit build a production-grade trading bot with a backtest engine, risk controls and paper trading by default from strategies/Z-Score-Trend-Following-Strategy.md- npx agenkit install engineering-kit in your project
- Paste the command into your agent and approve each phase
- Get tests, backtest, risk controls and a paper-trading switch
Understand it first
Before you run this, read the lesson behind the idea and how to backtest it honestly. Specs like this one are the survivors of an unknown number of trials; deflate their results accordingly.
Related specs
- 200 EMA VWAP MFI Trend Following StrategyPine Script · Trend following · 1d
- 4 EMA Trend StrategyPine Script · Trend following · 1d
- ADX MA and EMA Long Only Trend Tracking StrategyPine Script · Trend following · 1d
- ATR Dynamic Trend Following and EMA Crossover Trading StrategyPine Script · Trend following · 1d
- ATR and Moving Average Crossover Hybrid StrategyPine Script · Trend following · 1h
- ATR and T3 Moving Average StrategyPine Script · Trend following · 5m