A Momentum Crossover Strategy Based on Exponential Moving Average
This strategy determines the trend direction based on the crossover of EMA lines with different periods and generates long and short signals accordingly. It mainly uses two moving averages - 10-day EMA and 20-day…
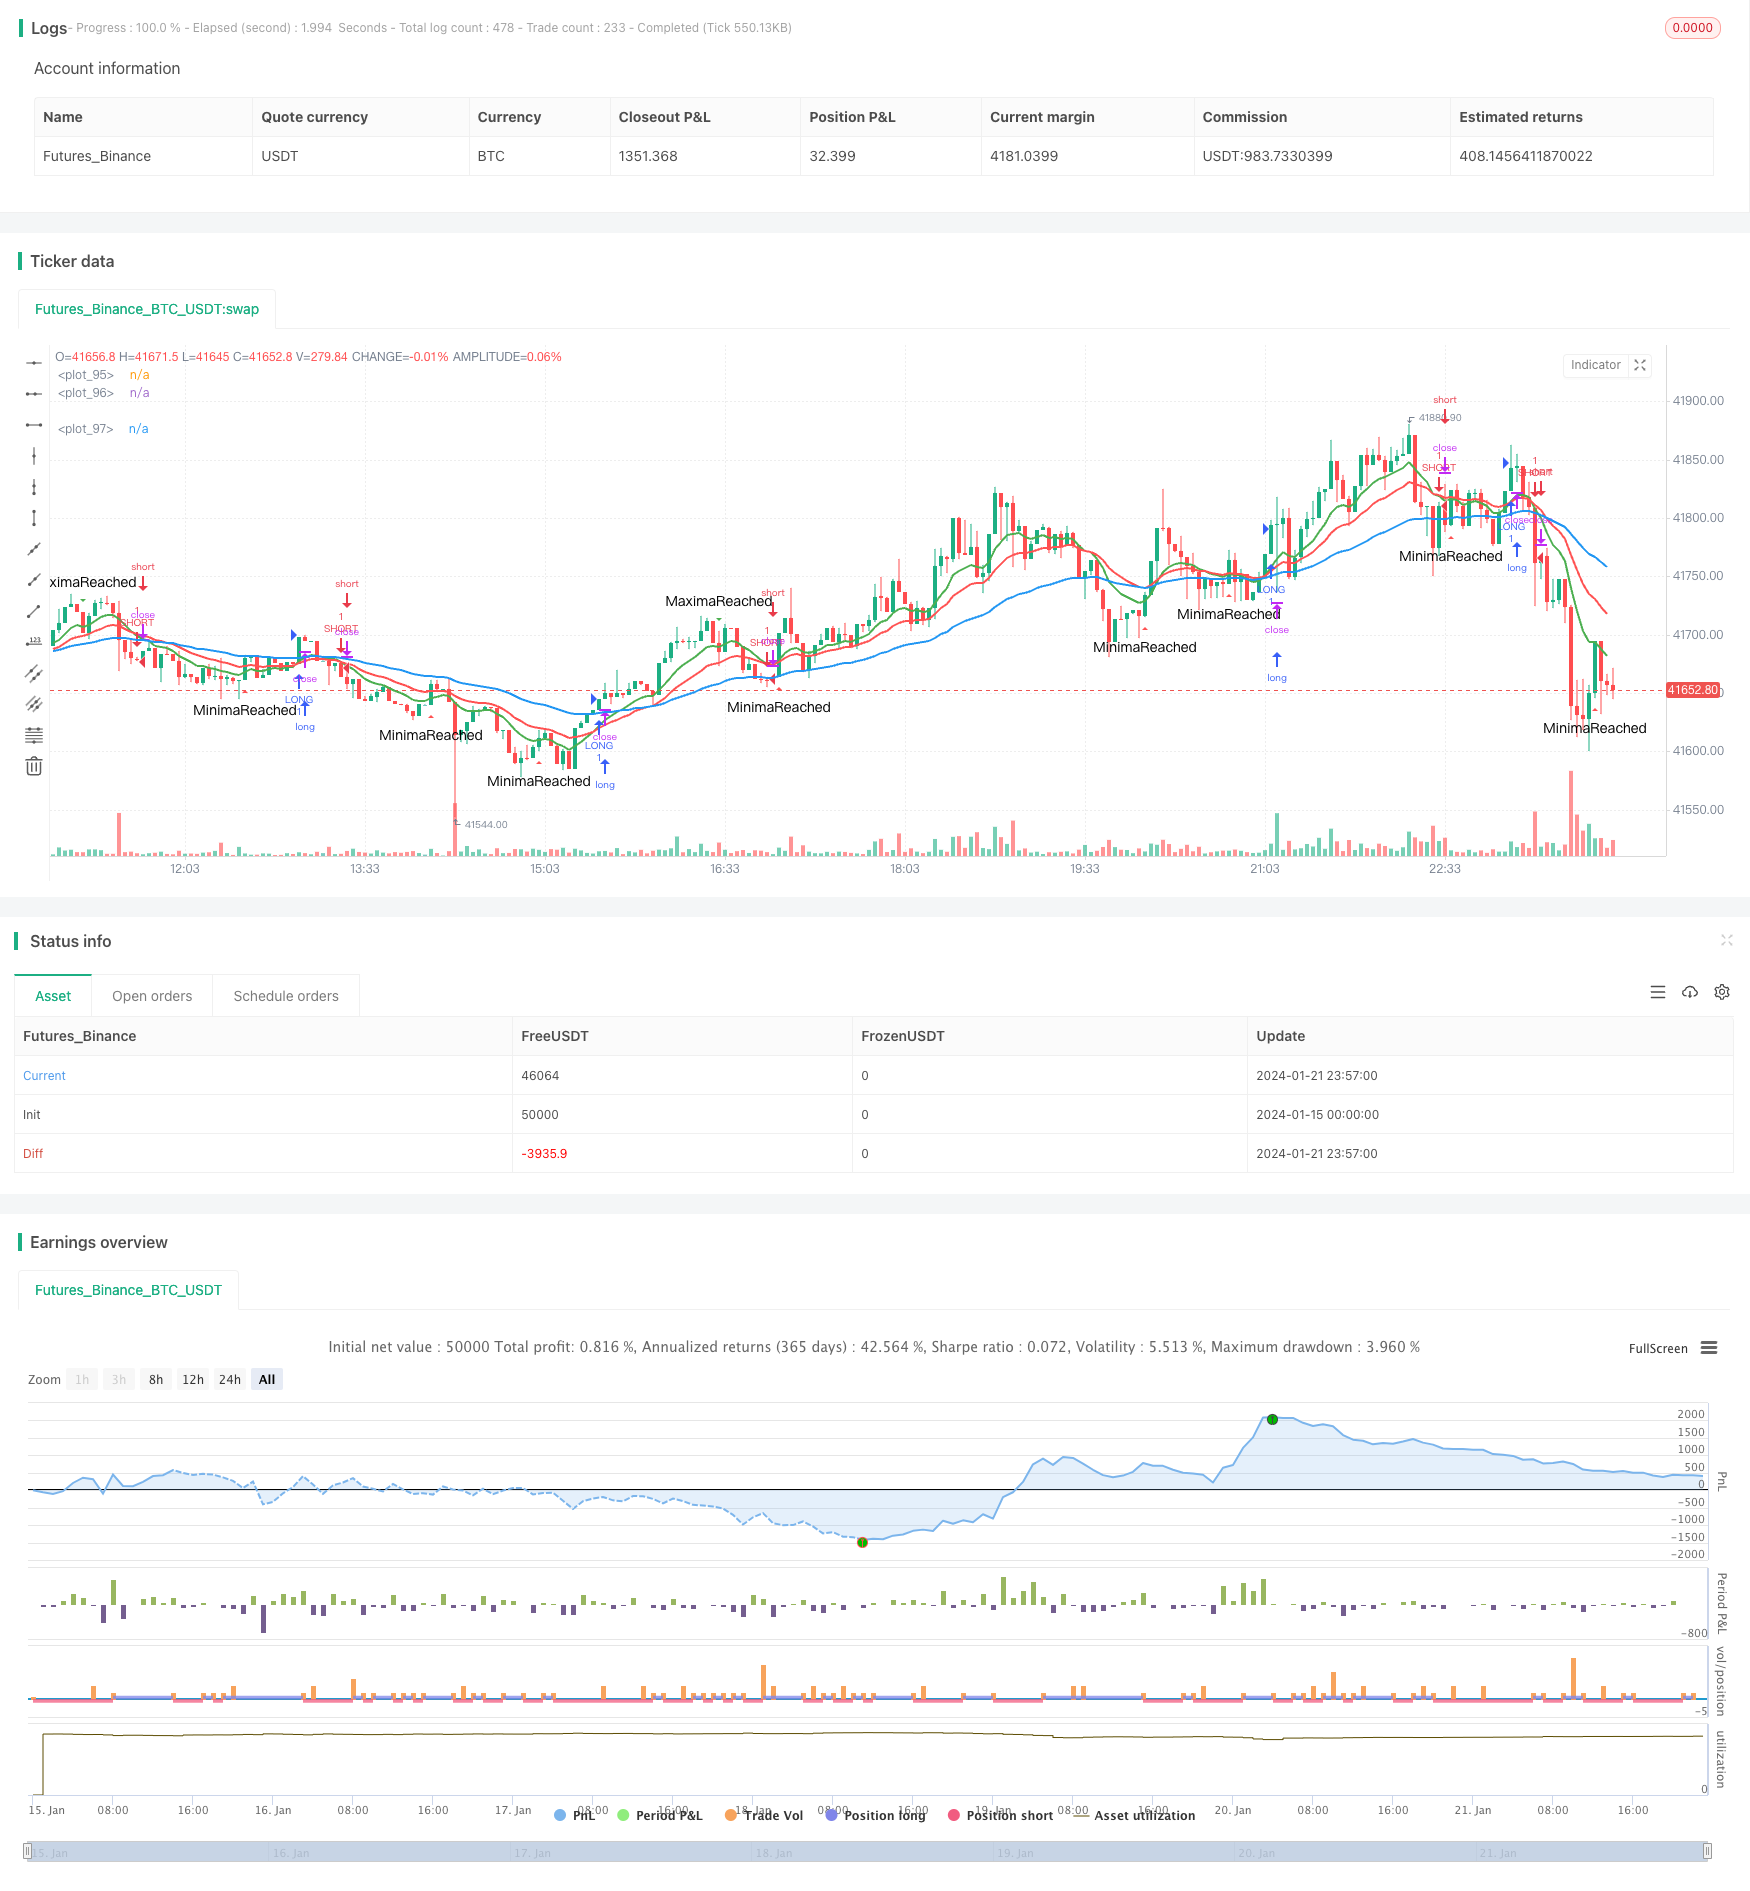
Overview
This strategy determines the trend direction based on the crossover of EMA lines with different periods and generates long and short signals accordingly. It mainly uses two moving averages - 10-day EMA and 20-day EMA. When the 10-day EMA crosses below the 20-day EMA, a short signal is triggered. When the 10-day EMA crosses above the 20-day EMA, a long signal is triggered. This strategy belongs to medium-term trading strategies.
Strategy Principles
The strategy utilizes two EMA lines, including the 10-day EMA and the 20-day EMA. The EMA lines can reflect the trend of prices effectively. When the shorter-term EMA line crosses above the longer-term EMA line, it indicates the price trend is turning from decline to rise, which is a long signal. When the shorter-term EMA line crosses below the longer-term EMA line, it indicates the price trend is turning from rise to decline, which is a short signal.
The strategy also combines the maximum and minimum values of price fluctuations to filter some trading signals. Trading signals are only triggered after the price fluctuations reach a certain extent. This can filter out some false signals to some degree.
Specifically, by tracking the time when maximum and minimum values are reached, the strategy judges whether a price trend has formed. Real trading signals are only triggered after the maximum or minimum values have lasted for some time.
Advantage Analysis
The strategy has the following advantages:
- Using EMA lines to determine trend direction can track market moves effectively
- Combining EMA lines of different periods can capture trading opportunities in medium-term
- Filtering signals by extreme values can remove some noise and avoid missing trading chances
- The logic is simple and clear, easy to understand and modify
- Parameters can be adjusted for different products and trading preferences, showing strong adaptability
Risk Analysis
There are also some risks with this strategy:
- EMA lines themselves have lagging effect, may miss short-term trend reversals
- The noise filtering is imperfect, some wrong trades may occur
- Parameters need proper adjustment to suit different market environments
The risks can be mitigated through:
- Adding other indicators for signal confirmation to avoid EMA line lagging issues
- Optimizing extreme value filtering conditions to improve signal reliability
- Adjusting parameters based on backtest results to optimize the strategy
Directions for Enhancement
The strategy can be further optimized in the following aspects:
- Incorporate other technical indicators like MACD and KD to improve signal accuracy
- Optimize EMA line parameters to better suit specific products
- Refine extreme value parameters to better judge price fluctuations
- Add stop loss mechanisms to control maximum loss per trade
- Test the strategy on different products to evaluate adaptability
Summary
In summary, this EMA crossover strategy is a simple and practical trend following strategy. It uses EMA lines to determine the major trend direction, combined with price fluctuation filtering for making trading decisions. It is easy to understand and adjust parameters, adaptable to medium-term trading. With further optimizations, this can become a worthwhile quantitative strategy to hold for the long term.
Parameters
| Name | Default | What it controls |
|---|---|---|
| v_input_1 | 2 | Length 0 |
| v_input_2 | 10 | Length 1 |
| v_input_3 | 20 | Length 2 |
| v_input_4 | 50 | Length3 |
Source Pine Script
/*backtest
start: 2024-01-15 00:00:00
end: 2024-01-22 00:00:00
period: 3m
basePeriod: 1m
exchanges: [{"eid":"Futures_Binance","currency":"BTC_USDT"}]
*/

//@version=2
strategy("PierceMAStrat", overlay=true)

lenMA0 = input(title="Length 0",defval=2)
lenMA1=input(title="Length 1",defval=10)
lenMA2=input(title="Length 2", defval=20)
lenMA3 = input(title = "Length3", defval =50)


emaLen0 = ema(close, lenMA0)
emaLen1 = ema(close, lenMA1)
emaLen2 = ema(close, lenMA2)
emaLen3 = ema(close, lenMA3)


ascent = if emaLen1[1] < emaLen1[0]
    true
else
    false

descent = if emaLen1[1] > emaLen1[0]
    true
else
    false

TimeSinceAscensionStart = if ascent == true
    barssince(descent == true)
else
    0


StartUp = if TimeSinceAscensionStart < 1
    true
else
    false

StartDown = if TimeSinceAscensionStart < 1
    false
else
    true


AscentBarCounter = barssince(StartUp == true)

DescentBarCounter = barssince(StartDown == true)

MaxAscent = if AscentBarCounter[1] > AscentBarCounter[0] and AscentBarCounter[1] > 10
    true
else
    false

MaxDescent = if DescentBarCounter[1] > DescentBarCounter[0] and DescentBarCounter[1] > 5
    true
else
    false

longCond = if crossover(emaLen1, emaLen2) and barssince(MaxDescent == true) > 3
    true
else
    false
shortCond = if crossunder(emaLen1, emaLen2) and barssince(MaxAscent == true) > 3
    true
else
    false


//longCond = (crossover(emaLen1, emaLen2) and (emaLen2 > emaLen3))
//shortCond = crossunder(emaLen1, emaLen2) and (emaLen2 < emaLen3)


if longCond == true
    strategy.entry("LONG", strategy.long)

if shortCond == true
    strategy.entry("SHORT", strategy.short)


plotshape(series=MaxAscent, title="MaximaReached", style=shape.triangledown, location=location.abovebar, color=green, text="MaximaReached", size=size.small)
plotshape(series=MaxDescent, title="MinimaReached", style=shape.triangleup, location=location.belowbar, color=red, text="MinimaReached", size=size.small)
//plotshape(series=StartUp, title="StartUp", style=shape.triangleup, location=location.belowbar, color=red, text="StartUp", size=size.tiny)
//plotshape(series=StartDown, title="StartDown", style=shape.triangleup, location=location.belowbar, color=green, text="StartDown", size=size.tiny)

//plotshape(series=(crossover(emaLen1, emaLen3)), title="GBXOVER", style=shape.triangleup, location=location.belowbar, color=green, text="GBXO", size=size.small)
//plotshape(series=(crossover(emaLen2, emaLen3)), title="RBXOVER", style=shape.triangledown, location=location.abovebar, color=orange, text="RBXO", size=size.small)
//plotshape(series=(crossover(emaLen1, emaLen2)), title="GRXOVER", style=shape.triangledown, location=location.abovebar, color=teal, text="GRXO", size=size.small)
//plotshape(series=(crossunder(emaLen1, emaLen2)), title="GRXUNDER", style=shape.triangledown, location=location.abovebar, color=purple, text="GRXU", size=size.small)
//plotshape(series=(crossunder(emaLen1, emaLen3)), title="GBXOVER", style=shape.triangleup, location=location.belowbar, color=yellow, text="GBXU", size=size.small)
//plotshape(series=(crossunder(emaLen2, emaLen3)), title="RBXOVER", style=shape.triangledown, location=location.abovebar, color=yellow, text="RBXU", size=size.small)

//plotshape(convergence, color=lime, style=shape.arrowup, text="CROSS")
plot(emaLen1, color=green, transp=0, linewidth=2)
plot(emaLen2, color=red, transp=30, linewidth=2)
plot(emaLen3, color=blue, transp=30, linewidth=2)
Published by ChaoZhang on the FMZ strategy square · last modified 2024-01-23. Collected in the Quant Trading Vault. Unvalidated research: re-test with your own data and costs before trusting it.
Build this with AgenKit
A spec is not a trading system. Paste this into your coding agent and AgenKit runs a specialist team — architecture, test-first build, risk gates, review — with paper trading on by default.
/agenkit build a production-grade trading bot with a backtest engine, risk controls and paper trading by default from strategies/A-Momentum-Crossover-Strategy-Based-on-Exponential-Moving-Average.md- npx agenkit install engineering-kit in your project
- Paste the command into your agent and approve each phase
- Get tests, backtest, risk controls and a paper-trading switch
Understand it first
Before you run this, read the lesson behind the idea and how to backtest it honestly. Specs like this one are the survivors of an unknown number of trials; deflate their results accordingly.
Related specs
- ADX Momentum Trend StrategyPine Script · Momentum · 10m
- Advanced Multi Indicator Trend Following and Momentum Quantitative Trading StrategyPine Script · Momentum · 1h
- Bollinger Bands Momentum Trend Following Quantitative StrategyPine Script · Momentum · 1d
- Cross Period Momentum EMA Strategy with RSI and Dynamic ATR Stop LossPine Script · Momentum · 1d
- Dual EMA Crossover with RSI Momentum Enhanced Trading StrategyPine Script · Momentum · 1d
- Dual EMA Momentum Trend Trading Strategy with Full Body Candle Signal SystemPine Script · Momentum · 2h