Strategy vault / Machine learning
Accumulation Stage Identifier and Trading Strategy
This strategy combines moving averages, volume indicators and price momentum indicators to design a set of quantitative rules to identify the timing of stocks entering the accumulation stage. At this stage, stocks…
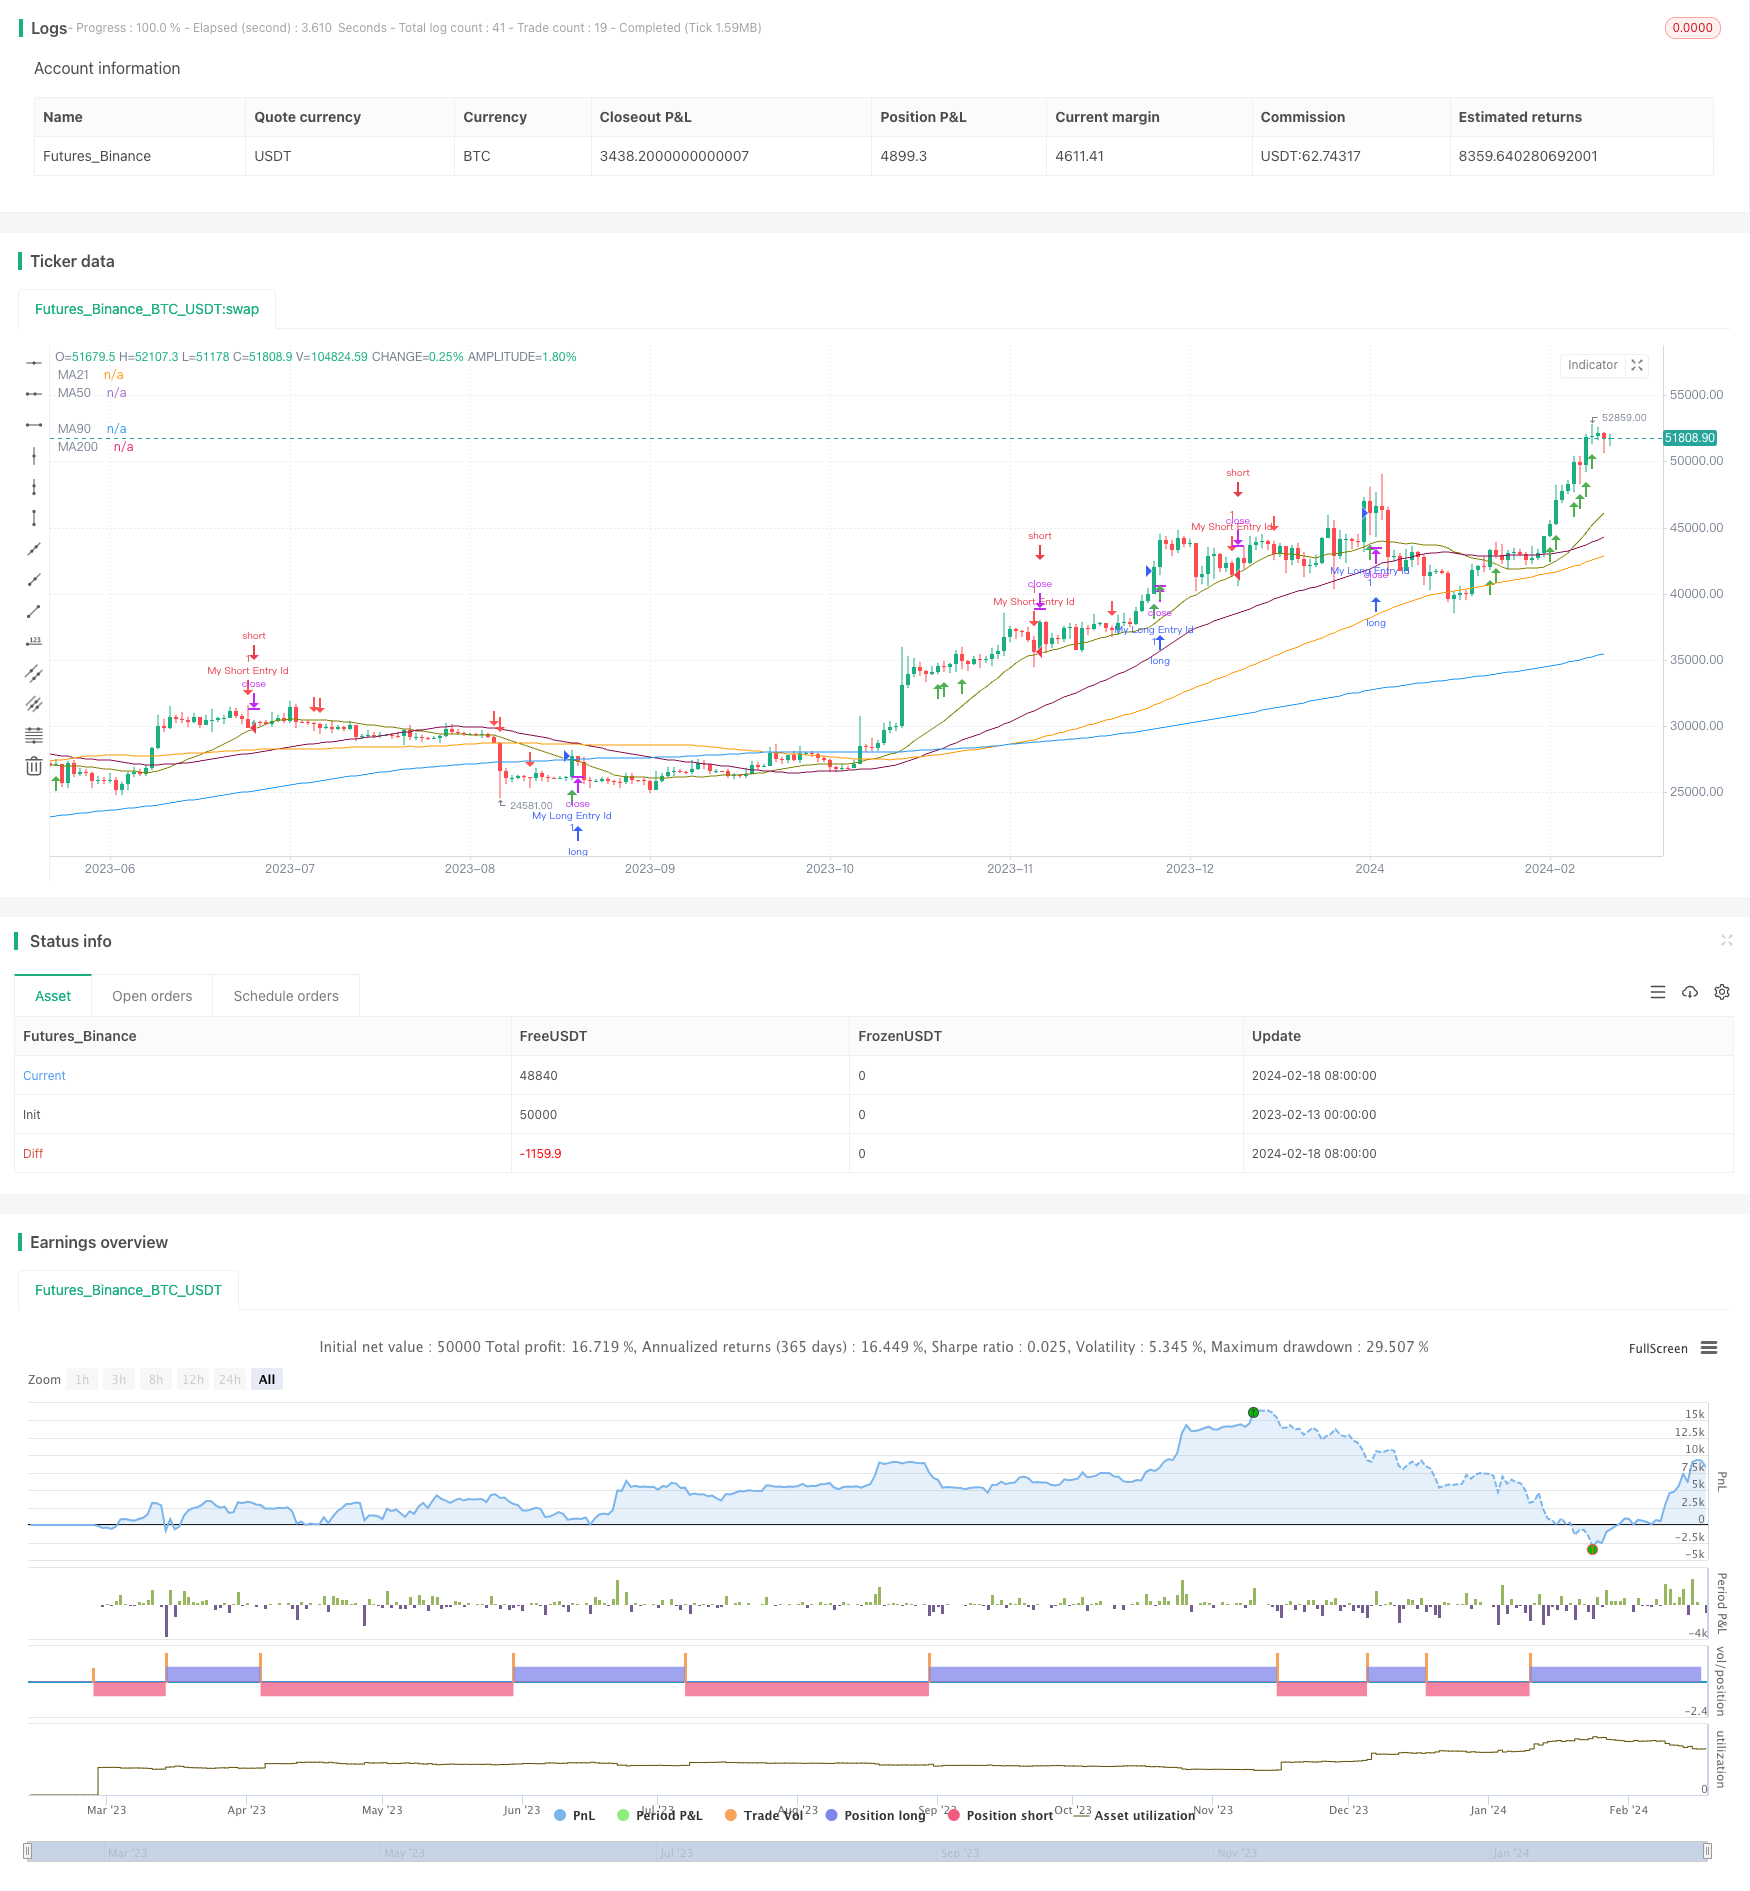
Overview
This strategy combines moving averages, volume indicators and price momentum indicators to design a set of quantitative rules to identify the timing of stocks entering the accumulation stage. At this stage, stocks are usually in a price consolidation and storage state, providing a good low-price opportunity.
Strategy Principle
The strategy uses 50-day, 90-day and 200-day simple moving averages to determine price trends. Buy signals are only generated when prices are above the 200-day line. This filters out the uncertainty of major downtrends.
In addition to judging the major trend, the strategy also judges the order of short-term moving averages to confirm the trend. Specifically, it judges if the 50-day line is above the 90-day line.
On the basis that the moving average confirms the major and short-term trends, the strategy combines the PVT volume indicator and the MACD indicator to judge the accumulation characteristics. Buy signals are generated only when the PVT breaks upward, the MACD line is higher than the Signal line, and the volume expands.
Advantages
Compared with using moving averages alone, this strategy also checks the characteristics of volume while confirming the trend. This can more accurately determine the timing of stocks entering the accumulation stage, thus ensuring better entry prices.
By analyzing multiple time frames, this strategy combines medium- and long-term trend judgments and short-term feature judgments to match time frames, which can reduce uncertainty from judging a single time frame incorrectly.
Risks and Solutions
This strategy relies mainly on moving average judgments. When prices fluctuate violently, moving average judgments will fail. At this point, the position size should be reduced or a stop loss exit should be triggered.
In addition, misjudgement on the accumulation stage is possible, thus missing reversal opportunities. This requires observing more feature indicators to confirm judgements.
Optimization Ideas
Machine learning algorithms can be introduced into this strategy by extracting features and model training to achieve automatic judgment of the accumulation stage. This can reduce limitations from manually setting thresholds.
In addition, this strategy can also try the breakpoint functionality to automatically switch parameters under different market environments, making the strategy more robust.
Summary
In summary, this strategy generally adopts the idea of matching prices and volumes to judge the characteristics of stock accumulation stages. While confirming the major direction, it digs short-term accumulation opportunities. There is still room for further improvement in strategy performance by introducing parameter optimization and machine learning.
Parameters
| Name | Default | What it controls |
|---|---|---|
| v_input_1 | 21 | Lookback |
| v_input_int_1 | false | Offset |
| v_input_2 | 21 | Entry Line |
| v_input_3 | 21 | Exit Line |
Source Pine Script
/*backtest
start: 2023-02-13 00:00:00
end: 2024-02-19 00:00:00
period: 1d
basePeriod: 1h
exchanges: [{"eid":"Futures_Binance","currency":"BTC_USDT"}]
*/

// This source code is subject to the terms of the Mozilla Public License 2.0 at https://mozilla.org/MPL/2.0/
// © stocktechbot

//@version=5
strategy("Accumulate", overlay = true)
lookback = input(defval = 21, title = 'Lookback')
offset = input.int(title="Offset", defval=0, minval=-500, maxval=500)
//SMA Tredline
out = ta.sma(close, 200)
outf = ta.sma(close, 50)
outn = ta.sma(close, 90)
outt = ta.sma(close, 21)
//sma plot
plot(out, color=color.blue, title="MA200", offset=offset)
plot(outf, color=color.maroon, title="MA50", offset=offset)
plot(outn, color=color.orange, title="MA90", offset=offset)
plot(outt, color=color.olive, title="MA21", offset=offset)

//MarketCap Calculation
//MarketCap = 0.0
//TSO = request.financial(syminfo.tickerid, "TOTAL_SHARES_OUTSTANDING", "FQ", ignore_invalid_symbol = true)


//if str.tostring(TSO) != 'na'
//    if ta.barssince(TSO != TSO[1] and TSO > TSO[1])==0
//        MarketCap := TSO * close
//
//    if barstate.islast and MarketCap == 0
//        runtime.error("No MarketCap is provided by the data vendor.")
//
//momlen = 100
//msrc = MarketCap
//mom = msrc - msrc[momlen]
//plotmom = if (mom > mom[1])
//    true
//else
//   false

//OBV with sma on macd
obv = ta.cum(math.sign(ta.change(close)) * volume)
smoothingLength = 5
smoothingLine = ta.sma(obv,5)
[macdLine, signalLine, histLine] = ta.macd(ta.pvt, 12, 26, 9)
sellvolhigh = macdLine < signalLine
buyvolhigh = macdLine > signalLine
//Buy Signal
mafentry =ta.sma(close, 50) > ta.sma(close, 90)
//matentry = ta.sma(close, 21) > ta.sma(close, 50)
matwohun = close > ta.sma(close, 200)
higheshigh = ta.rising(high, 2)
higheslow = ta.rising(low, 2 )
twohunraise = ta.rising(out, 2)
//highvol =  ta.crossover(volume, ta.sma(volume, lookback))
highvol = ta.rising(volume,2)
fourlow = ta.lowest(close, lookback)
fourhig = ta.highest(close, lookback)
change =  (((fourhig - fourlow) / fourlow) * 100) <= 30
green = close > open
allup = false
lineabove = ta.cross(close, ta.sma(close, input(defval = 21, title = 'Entry Line')))
if matwohun and mafentry and higheshigh and twohunraise and buyvolhigh
//if higheshigh and higheslow and highvol
    allup := true

plotshape(allup, style=shape.arrowup,location=location.belowbar, color=color.green, title = "Buy Signal")

barsSinceLastEntry() =>
    strategy.opentrades > 0 ? bar_index - strategy.opentrades.entry_bar_index(strategy.opentrades - 1) : na

//Sell Signal
mafexit =ta.sma(close, 50) < ta.sma(close, 90)
matexit = ta.sma(close, 21) < ta.sma(close, 50)
matwohund = close < ta.sma(close, 200)
linebreak = ta.sma(close, input(defval = 21, title = 'Exit Line')) > close
lowesthigh = ta.falling(high, 3)
lowestlow = ta.falling(low, 2 )
twohunfall = ta.falling(out, 3)
twentyfall = ta.falling(outt, 2)
highvole =  ta.crossover(volume, ta.sma(volume, 5))
//fourlow = ta.lowest(close, lookback)
//fourhig = ta.highest(close, lookback)
changed =  (((fourhig - close) / close) * 100) >= 10
red = close < open
atr = ta.atr(14)
//atrsmalen = int(bar_index - strategy.opentrades.entry_bar_index(strategy.opentrades - 1) )
atrsmalen = barsSinceLastEntry()
atrsma = false
atrlen = 5
if str.tostring(atrsmalen) != 'NaN' and atrsmalen > 0
    atrlen := atrsmalen


atrsma := atr > ta.sma(atr,50)


alldwn = false
if sellvolhigh and lowestlow and (close < close[1] and close < open)
//if higheshigh and higheslow and highvol
    alldwn := true

plotshape(alldwn, style=shape.arrowdown,location=location.abovebar, color=color.red, title = "Sell Signal")


longCondition = ta.crossover(ta.sma(close, 14), ta.sma(close, 28))
if (allup)
    strategy.entry("My Long Entry Id", strategy.long)

shortCondition = ta.crossunder(ta.sma(close, 14), ta.sma(close, 28))
if (alldwn)
    strategy.entry("My Short Entry Id", strategy.short)
Published by ChaoZhang on the FMZ strategy square · last modified 2024-02-20. Collected in the Quant Trading Vault. Unvalidated research: re-test with your own data and costs before trusting it.
Build this with AgenKit
A spec is not a trading system. Paste this into your coding agent and AgenKit runs a specialist team — architecture, test-first build, risk gates, review — with paper trading on by default.
/agenkit build a production-grade trading bot with a backtest engine, risk controls and paper trading by default from strategies/Accumulation-Stage-Identifier-and-Trading-Strategy.md- npx agenkit install engineering-kit in your project
- Paste the command into your agent and approve each phase
- Get tests, backtest, risk controls and a paper-trading switch
Understand it first
Before you run this, read the lesson behind the idea and how to backtest it honestly. Specs like this one are the survivors of an unknown number of trials; deflate their results accordingly.
Related specs
- Multi Indicator Dynamic Adaptive Quantitative Trading StrategyPine Script · Machine learning · 1h
- High Low Cryptocurrency Strategy Based on Multiple IndicatorsPine Script · Machine learning · 45m
- Multiple Moving Average Trading StrategyPine Script · Machine learning · 1d
- Vortex and RSI Stock Long only Trading StrategyPine Script · Machine learning · 1h
- Dynamic Price Swing Oscillator StrategyPine Script · Machine learning · 1m
- Linear MACD Unlocking the Magic of Linear Regression in TradingViewPine Script · Machine learning · 1m