Adaptive Botvenko Indicator Long Short Strategy
This strategy is developed based on the Botvenko indicator to automatically identify market trends and establish long/short positions. It integrates Botvenko indicator, moving averages and horizontal support lines to…
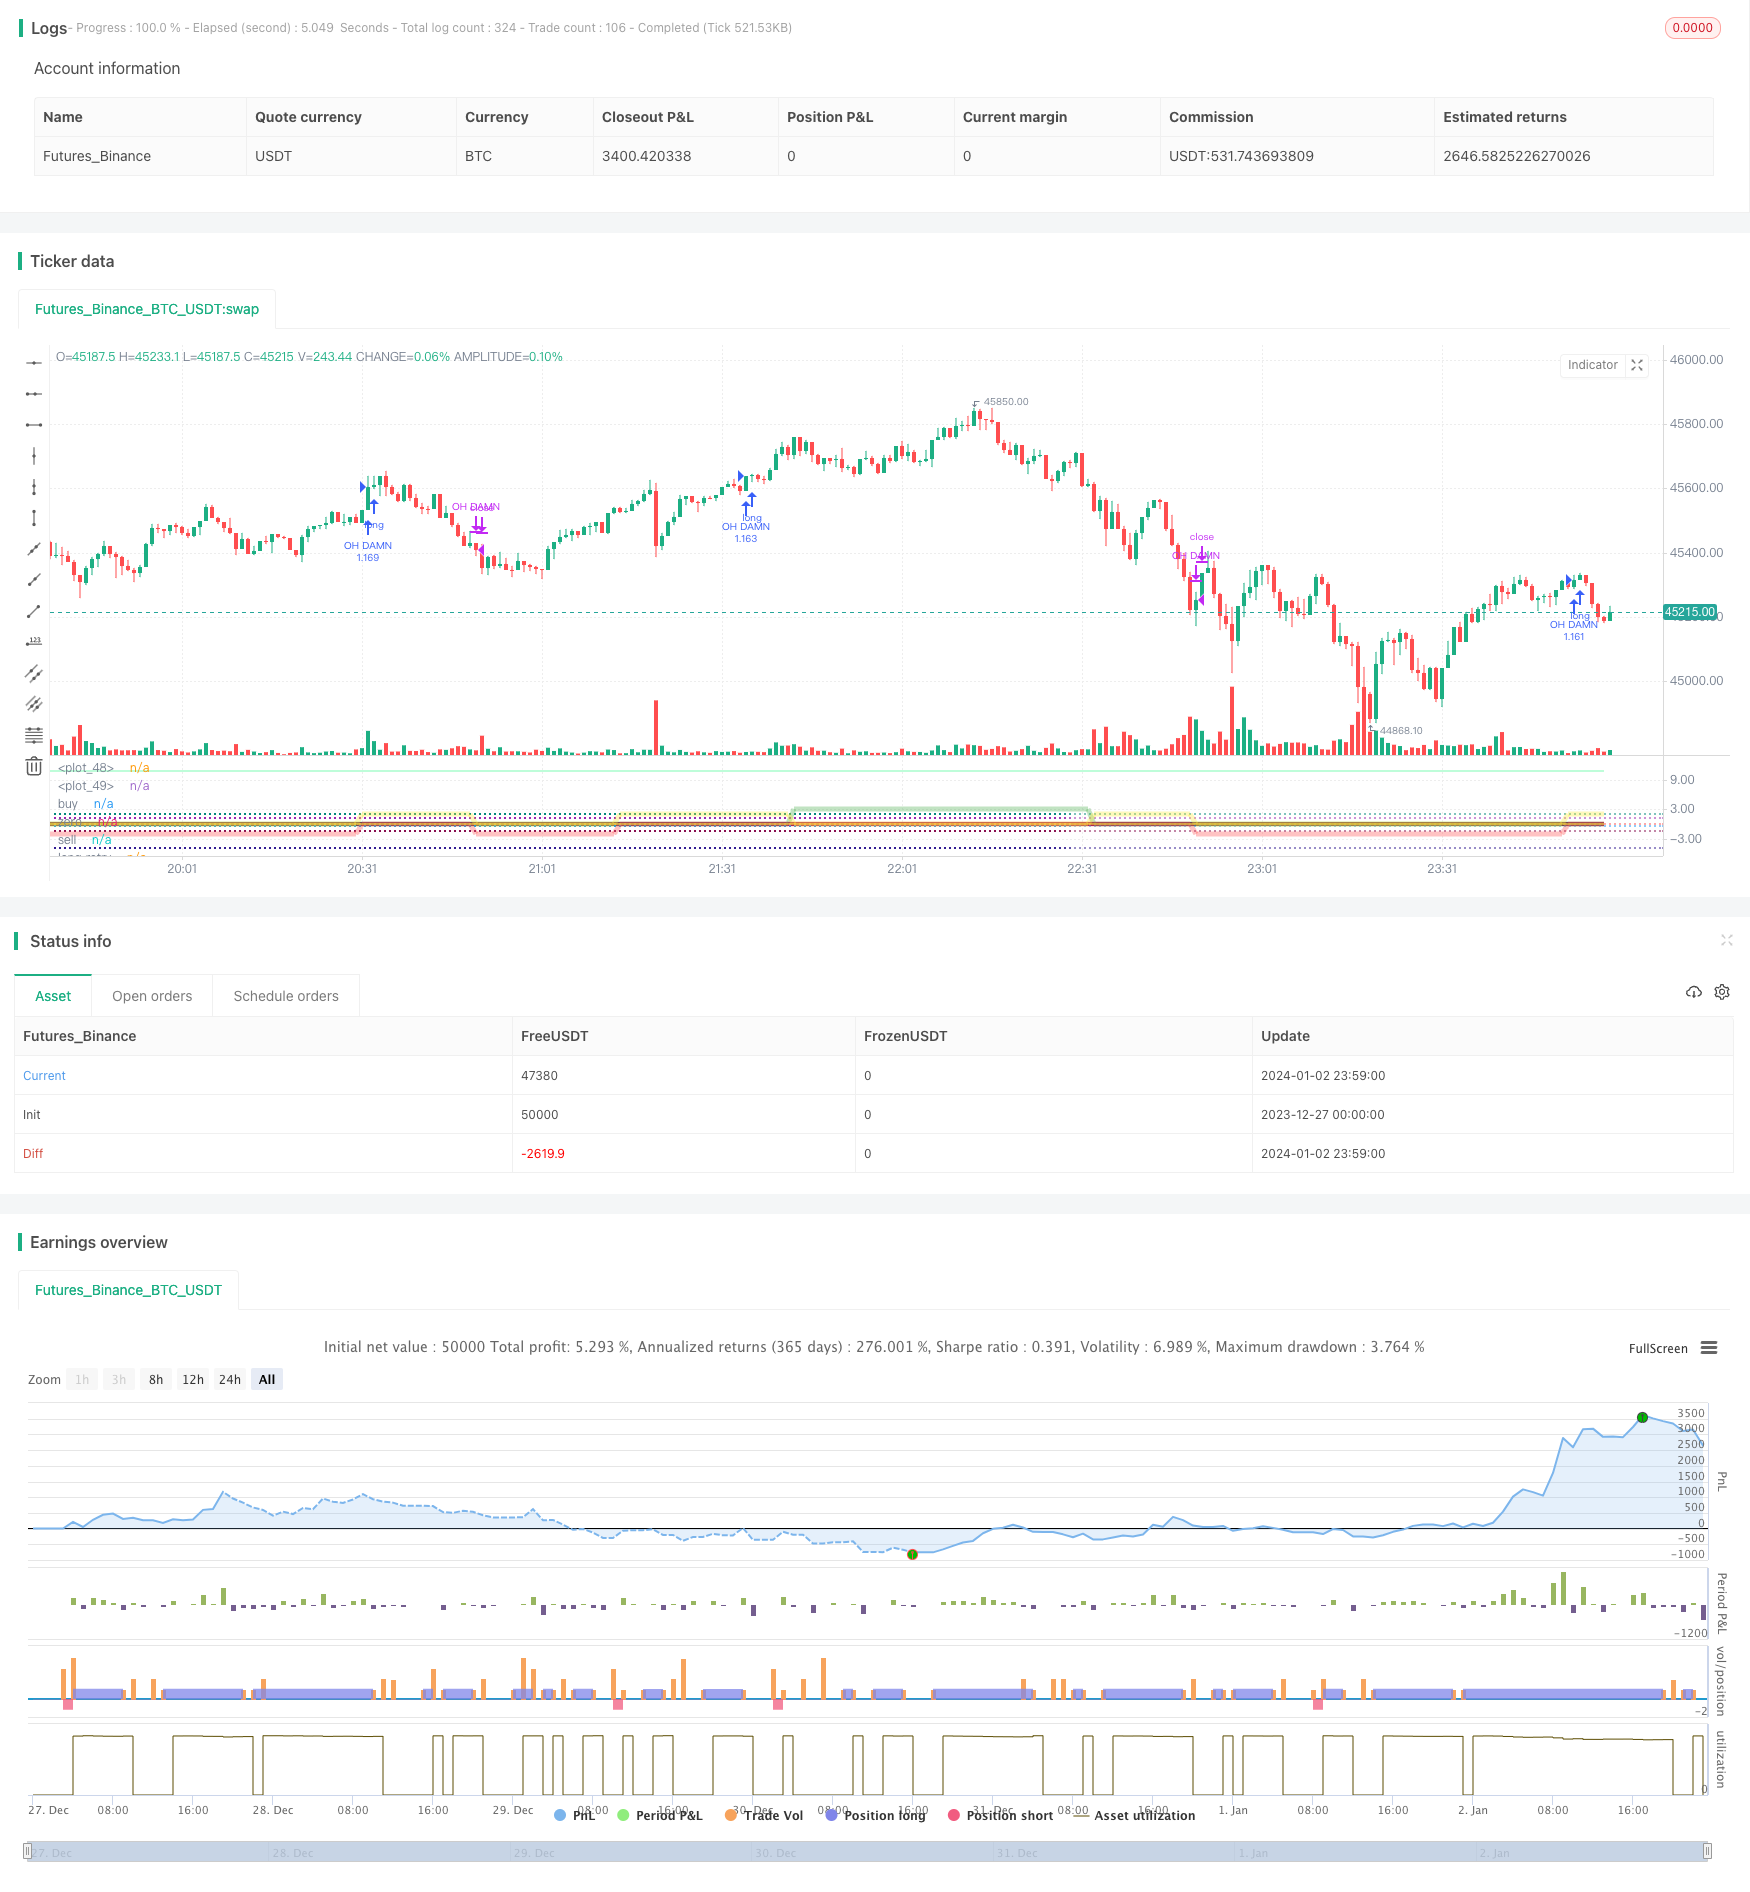
Overview
This strategy is developed based on the Botvenko indicator to automatically identify market trends and establish long/short positions. It integrates Botvenko indicator, moving averages and horizontal support lines to automatically recognize breakout signals and establish positions.
Strategy Principle
The core indicator of this strategy is the Botvenko indicator. By calculating the logarithmic difference between closing prices on different trading days, it judges the market trend and important support/resistance levels. It goes long when the indicator crosses above a certain level line and goes short when it crosses below.
In addition, the strategy integrates an "EMA Protection Belt" consisting of 21-day, 55-day and other moving averages. It determines whether the current state is a bull market, bear market or consolidation market based on the sorting relationship of these moving averages, and accordingly restricts short or long operations.
By identifying trading signals with Botvenko indicator and judging market stages with moving averages, inappropriate position establishment can be avoided when used in combination.
Advantage Analysis
The biggest advantage of this strategy is that it can automatically identify the long/short trends of the market. The Botvenko indicator is very sensitive to the difference between prices over two time periods and can quickly locate key support/resistance levels. At the same time, the sorting of moving averages can effectively judge whether it is currently better to be long or short.
This idea of combining fast indicators and trend indicators enables the strategy to quickly locate entry and exit points while preventing inappropriate buying and selling. This is the biggest advantage.
Risk Analysis
The risks of this strategy mainly come from two aspects. First, the Botvenko indicator itself is very sensitive to price changes, which may generate many unnecessary trading signals. Second, the sorting of moving averages can get messy during sideways moves, leading to messy position establishment.
To address the first risk, parameters of the Botvenko indicator can be adjusted to increase the calculation cycle and reduce unnecessary trades. For the second risk, more moving averages can be added to make trend judgement more accurate.
Optimization Directions
The main optimization directions are parameter tuning and adding filter conditions.
For the Botvenko indicator, different period parameters can be tried to find the optimal combination. For moving averages, more of them can be added to form a more complete trend judgment system. In addition, volatility indicators, trading volume indicators etc. can also be introduced to filter out false signals.
Through comprehensive adjustments of parameters and filter conditions, the stability and profitability of the strategy can be further enhanced.
Summary
The adaptive Botvenko long/short strategy successfully combines fast and trend indicators to automatically identify key market points and establish correct positions. Its advantages lie in fast location and prevention of inappropriate positions. Next step is to further improve stability and profitability through parameter and condition optimization.
Parameters
| Name | Default | What it controls |
|---|---|---|
| v_input_string_1 | 0 | strategy direction: all | short | long |
| v_input_1 | 2005 | Backtest Start Year |
| v_input_2 | 7 | Backtest Start Month |
| v_input_3 | 16 | Backtest Start Day |
| v_input_4 | 2030 | Backtest Stop Year |
| v_input_5 | 12 | Backtest Stop Month |
| v_input_6 | 30 | Backtest Stop Day |
| v_input_float_1 | 0.0065 | sell level |
| v_input_float_2 | false | buy level |
| v_input_float_3 | -0.493 | long retry - too low |
| v_input_float_4 | 2 | long close up |
| v_input_float_5 | -1.5 | long close down |
| v_input_float_6 | 1.26 | short retry - too high |
| v_input_float_7 | -5 | dead - close the short |
| v_input_7 | 60 | Histogram Period |
Source Pine Script
/*backtest
start: 2023-12-27 00:00:00
end: 2024-01-03 00:00:00
period: 1m
basePeriod: 1m
exchanges: [{"eid":"Futures_Binance","currency":"BTC_USDT"}]
*/

// This source code is subject to the terms of the Mozilla Public License 2.0 at https://mozilla.org/MPL/2.0/
// © boftei

//@version=5

strategy("Boftei's Strategy", overlay=false, pyramiding=1, default_qty_type= strategy.percent_of_equity, default_qty_value = 100, calc_on_order_fills=false, margin_long = 100, margin_short = 100, slippage=0, commission_type=strategy.commission.percent, commission_value = 0, initial_capital = 40, precision = 6)
strat_dir_input = input.string("all", "strategy direction", options=["long", "short", "all"])
strat_dir_value = strat_dir_input == "long" ? strategy.direction.long : strat_dir_input == "short" ? strategy.direction.short : strategy.direction.all
strategy.risk.allow_entry_in(strat_dir_value)
//////////////////////////////////////////////////////////////////////
//DATA
testStartYear = input(2005, "Backtest Start Year")
testStartMonth = input(7, "Backtest Start Month")
testStartDay = input(16, "Backtest Start Day")
testPeriodStart = timestamp(testStartYear,testStartMonth,testStartDay,0,0)
//Stop date if you want to use a specific range of dates
testStopYear = input(2030, "Backtest Stop Year")
testStopMonth = input(12, "Backtest Stop Month")
testStopDay = input(30, "Backtest Stop Day")
testPeriodStop = timestamp(testStopYear,testStopMonth,testStopDay,0,0)


testPeriod() =>
    time >= testPeriodStart and time <= testPeriodStop ? true : false
//////////////////////////////////////////////////////////////////////
sell = input.float(0.0065, "sell level")
buy = input.float(0, "buy level")
long1 = input.float(-0.493, "long retry - too low")
long2 = input.float(2, "long close up")
long3 = input.float(-1.5, "long close down")
short1 = input.float(1.26, "short retry - too high")
short2 = input.float(-5, "dead - close the short")
///< botvenko script
nn = input(60, "Histogram Period")
float x = 0
float z = 0
float k = 0


y = math.log(close[0]) - math.log(close[nn])
if y>0
    x := y
else
    k := y
//---------------------------------------------

plot(y > 0 ? x: 0, color = color.green, linewidth = 4)
plot(y <= 0 ? k: 0, color = color.maroon, linewidth = 4)
plot(y, color = color.yellow, linewidth = 1)

co = ta.crossover(y, buy)
cu = ta.crossunder(y, sell)
retry_long = ta.crossunder(y, long1)
deadline_long_up = ta.crossover(y, long2)
deadline_long_down = ta.crossunder(y, long3)
retry_short = ta.crossover(y, short1)
deadline_short = ta.crossunder(y, short2)


hline(buy, title='buy', color=color.green, linestyle=hline.style_dotted, linewidth=2)
hline(0, title='zero', color=color.white, linestyle=hline.style_dotted, linewidth=1)
hline(sell, title='sell', color=color.red, linestyle=hline.style_dotted, linewidth=2)
hline(long1, title='long retry', color=color.blue, linestyle=hline.style_dotted, linewidth=2)
hline(long2, title='overbought', color=color.teal, linestyle=hline.style_dotted, linewidth=2)
hline(long3, title='oversold', color=color.maroon, linestyle=hline.style_dotted, linewidth=2)
hline(short1, title='short retry', color=color.purple, linestyle=hline.style_dotted, linewidth=2)
hline(short2, title='too low to short - an asset may die', color=color.navy, linestyle=hline.style_dotted, linewidth=2)


////////////////////////////////////////////////////////////EMAprotectionBLOCK
ema_21 = ta.ema(close, 21)
ema_55 = ta.ema(close, 55)
ema_89 = ta.ema(close, 89)
ema_144 = ta.ema(close, 144)
//ema_233 = ta.ema(close, 233)
// ema_377 = ta.ema(close, 377)

long_st = ema_21>ema_55 and ema_55>ema_89 and ema_89>ema_144 //and ema_144>ema_233 and ema_233>ema_377
short_st = ema_21<ema_55 and ema_55<ema_89 and ema_89<ema_144 //and ema_144<ema_233 and ema_233<ema_377

g_v = long_st == true?3:0
r_v = short_st == true?-2:0
y_v = long_st != true and short_st != true?2:0

plot(math.log(ema_21), color = color.new(#ffaf5e, 50))
plot(math.log(ema_55), color = color.new(#b9ff5e, 50))
plot(math.log(ema_89), color = color.new(#5eff81, 50))
plot(math.log(ema_144), color = color.new(#5effe4, 50))
//plot(math.log(ema_233), color = color.new(#5e9fff, 50))
//plot(math.log(ema_377), color = color.new(#af5eff, 50))

plot(long_st == true?3:0, color = color.new(color.green, 65), linewidth = 5)
plot(short_st == true?-2:0, color = color.new(color.red, 65), linewidth = 5)
plot(long_st != true and short_st != true?2:0, color = color.new(color.yellow, 65), linewidth = 5)
////////////////////////////////////////////////////////////EMAprotectionBLOCK


if (co and testPeriod() and (g_v == 3 or y_v == 2))
    strategy.close("OH BRO", comment = "EXIT-SHORT")
    strategy.close("OH DUDE", comment = "EXIT-SHORT")
	strategy.entry("OH DAMN", strategy.long, comment="ENTER-LONG 'co'")
if (retry_long and testPeriod() and (g_v == 3 or y_v == 2))
    strategy.close("OH DAMN", comment = "EXIT-LONG")
    strategy.entry("OH BRUH", strategy.long, comment="ENTER-LONG 'retry_long'")

if (cu and testPeriod() and (r_v == -2 or y_v == 2))
    strategy.close("OH DAMN", comment = "EXIT-LONG")
    strategy.close("OH BRUH", comment = "EXIT-LONG")
	strategy.entry("OH BRO", strategy.short, comment="ENTER-SHORT 'cu'")
if (retry_short and testPeriod() and (r_v == -2 or y_v == 2))
    strategy.close("OH BRO", comment = "EXIT-SHORT")
    strategy.entry("OH DUDE", strategy.short, comment="ENTER-SHORT 'retry_short'")


if (deadline_long_up and testPeriod() or r_v == -2 and testPeriod())
    strategy.close("OH DAMN", comment = "EXIT-LONG 'deadline_long_up'")
if (deadline_long_down and testPeriod())
    strategy.close("OH DAMN", comment = "EXIT-LONG 'deadline_long_down'")
if (deadline_short and testPeriod() or g_v == 3 and testPeriod())
    strategy.close("OH BRO", comment = "EXIT-SHORT 'deadline_short'")
    // (you can use strategy.close_all(comment = "close all entries") here)
Published by ChaoZhang on the FMZ strategy square · last modified 2024-01-04. Collected in the Quant Trading Vault. Unvalidated research: re-test with your own data and costs before trusting it.
Build this with AgenKit
A spec is not a trading system. Paste this into your coding agent and AgenKit runs a specialist team — architecture, test-first build, risk gates, review — with paper trading on by default.
/agenkit build a production-grade trading bot with a backtest engine, risk controls and paper trading by default from strategies/Adaptive-Botvenko-Indicator-Long-Short-Strategy.md- npx agenkit install engineering-kit in your project
- Paste the command into your agent and approve each phase
- Get tests, backtest, risk controls and a paper-trading switch
Understand it first
Before you run this, read the lesson behind the idea and how to backtest it honestly. Specs like this one are the survivors of an unknown number of trials; deflate their results accordingly.
Related specs
- Exponential Moving Average Candle Stop Trading StrategyPine Script · Breakout · 1d
- Kana Candle Breakout Strategy Based on Moving Average and Support ResistancePine Script · Breakout · 1h
- Momentum Breakout Moving Average StrategyPine Script · Breakout · 1d
- Momentum Breakout Trading Strategy 435896Pine Script · Breakout · 1d
- Moving Average Crossover and Upper Rail Breakthrough Impulse StrategyPine Script · Breakout · 1m
- Multi Indicator Short Term Algorithmic Trading StrategyPine Script · Breakout · 4h