Strategy vault / Trend following
Adaptive Moving Average Quantitative Strategy
This strategy is based on moving averages, can automatically adjust parameters, and is suitable for volatile markets with higher timeframes. It can automatically find the best parameter combinations and generate…
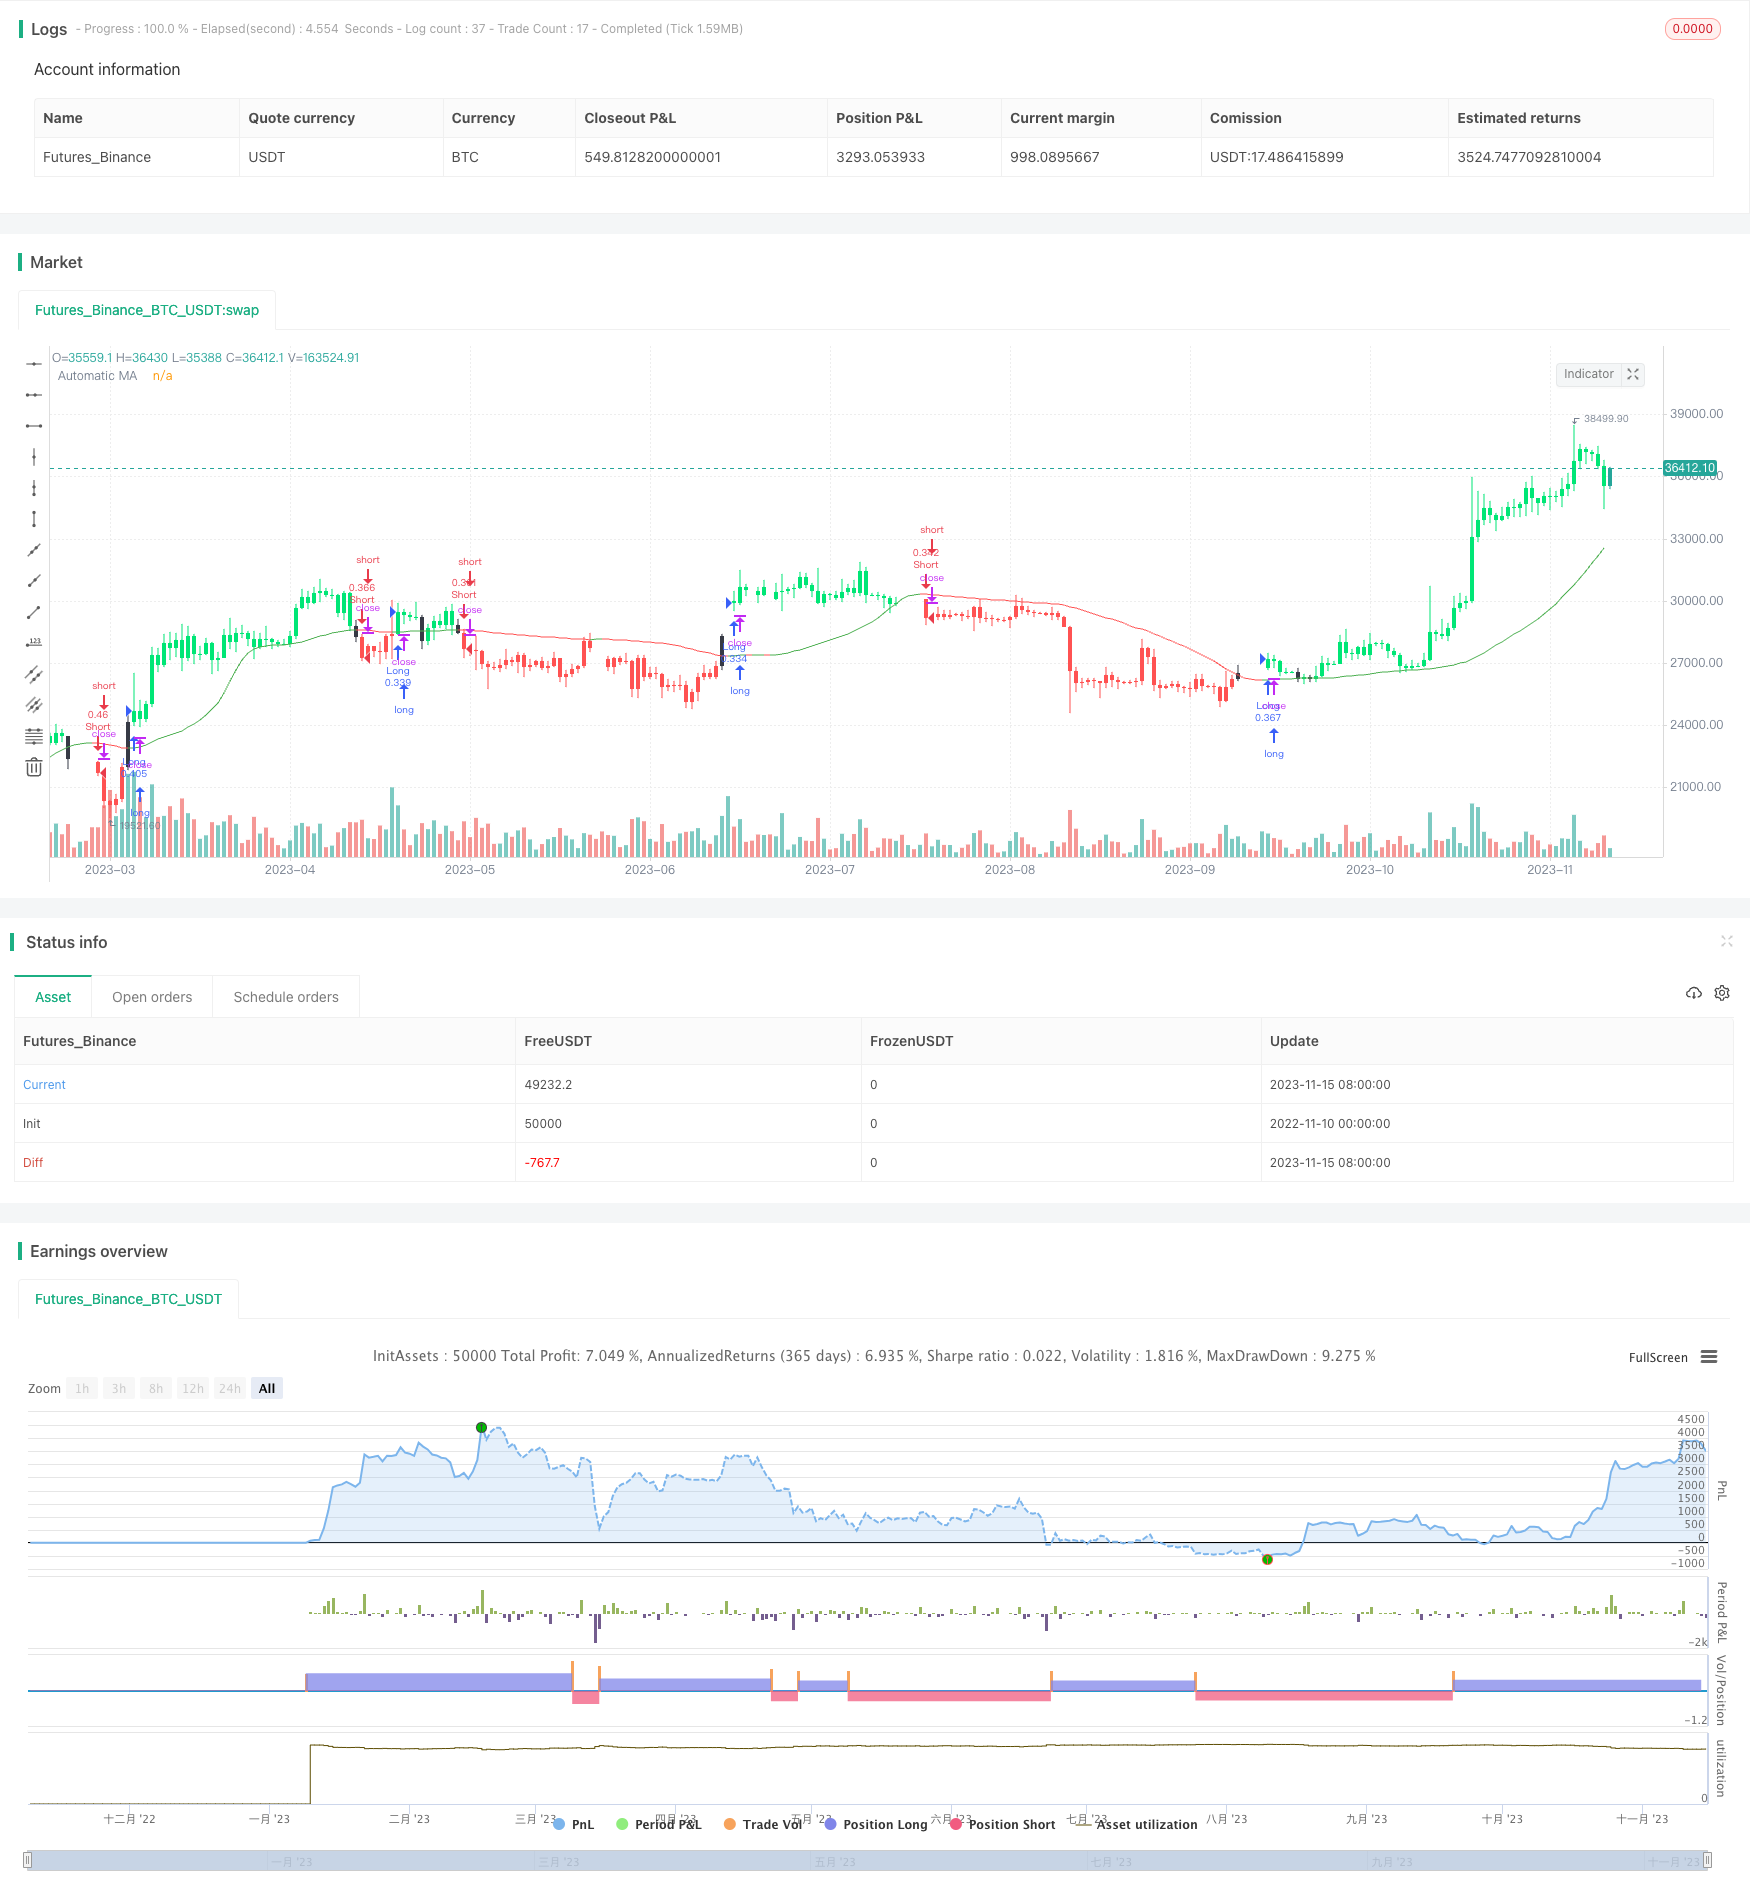
Overview
This strategy is based on moving averages, can automatically adjust parameters, and is suitable for volatile markets with higher timeframes. It can automatically find the best parameter combinations and generate trading signals when the price breaks through the moving average.
Strategy Principle
This strategy uses adaptive moving averages as trading signals. First calculate the simple moving average (CMA) for the specified period (start). Then test the parameter combinations around the CMA to determine which combination of CMA lines is touched the least number of times by candlestick entities and shadow lines. Finally, use the CMA with the least touches as the signal line.
Specifically, the strategy will test the CMA lines after the CMA period plus 1 (CMA_P1) and minus 1 (CMA_M1), and count the number of times the real line and shadow line touch them. If the number of touches of CMA is less than that of CMA_P1 and CMA_M1, then the current CMA period is maintained; if the number of touches of CMA_P1 is less, then the CMA period is increased by 1; if the number of touches of CMA_M1 is less, then the CMA period is decreased by 1. This way a relatively smooth CMA can be found as a signal line.
When the price breaks through the CMA from below, a buy signal is generated; when the price breaks through the CMA from above, a sell signal is generated.
Advantage Analysis
This adaptive moving average strategy has the following advantages:
Automatically find optimal parameters. There is no need to manually select the period of the moving average. The strategy will automatically test different periods to find the optimal parameters.
Reduce false signals. Compared with fixed-period moving averages, adaptive moving averages can filter out more noise, thereby reducing many false signals.
Adapt to market changes. When the market enters a trend from consolidation, the moving average period will automatically become longer to generate a signal; when the market enters consolidation from a trend, the moving average period will automatically become shorter. So the strategy can dynamically adapt to market changes.
Simplified trading system. This adaptive approach can simplify the entire trading system without the need for manual parameter optimization.
Strong scalability. This strategic concept can be extended to other indicators, designing adaptive Bollinger Bands, adaptive KD, and other strategies.
Risk Analysis
This strategy also carries some risks that need attention:
Call option risk. When there is a call option market in the market, the physical line cannot break through the moving average, which will cause a false signal. Filters need to be added to reduce this risk.
Risk of breakthrough failure. Moving average breakthroughs cannot always be continued, and there is a risk that some breakthroughs will fail. Therefore, breakthrough verification is needed to ensure the success rate of breakthrough.
Trend reversal risk. A reversal after entering a trending market requires timely switching of directions, otherwise losses will result. Stop loss conditions can be set to control losses.
Parameter optimization risks. Adaptively adjusted parameters may fall into local optimization, resulting in significantly redundant moving averages. Model evaluation methods need to be introduced to avoid this problem.
Risk of over-optimization. Adaptive adjustment parameters may over-optimize and lose the generalization ability of the model. It needs to be verified in different market environments for a long time, and you cannot rely too much on backtest results.
Optimization Direction
Directions for optimizing this adaptive moving average strategy include:
Includes a trend breakout verification mechanism to filter out false breakouts through consecutive breakouts.
Added stop-loss strategy, stop-loss when the price returns to the other side of the moving average.
Added options filtering mechanism to avoid sending false signals in the call options market.
Introduce evaluation indicators to constrain parameter adjustments, such as IC, LIC, SIC, etc., to avoid over-optimization of parameters.
Extend to other indicators, design adaptive golden cross and death cross strategies, adaptive Bollinger Band strategies, etc.
Optimize the moving average calculation method, use weighted moving average, exponential moving average and other smooth moving averages.
Summary
This strategy generates trading signals by adaptively adjusting the moving average period to find the optimal parameters. Compared to fixed parameters, it can reduce many false signals and adapt to market changes. However, we also need to pay attention to some potential risks and need to conduct verification and walk-forward optimization of the strategy to achieve stable profits in actual trading.
||
Overview
This strategy is based on moving average, can automatically adjust parameters, and is suitable for wavy markets at high timeframes. It can automatically find the optimal parameter combination and generate trading signals when price breaks through the moving average line.
Strategy Logic
This strategy uses an adaptive moving average as trading signal. First it calculates the simple moving average (CMA) of the specified period (start). Then it tests the CMA parameters around the period, judging which combination has the least touches by candlestick body and wick. Finally it uses the CMA with the least touches as the signal line.
Specifically, the strategy tests the CMA with period plus 1 (CMA_P1) and minus 1 (CMA_M1), counts the number of touches by body and wick. If CMA has less touches than CMA_P1 and CMA_M1, then keep the current period; if CMA_P1 has less touches, then increase the period by 1; if CMA_M1 has less touches, then decrease the period by 1. This finds a relatively smooth CMA as the signal line.
When price breaks through CMA upward, a buy signal is generated; when price breaks through CMA downward, a sell signal is generated.
Advantage Analysis
This adaptive moving average strategy has the following advantages:
Automatically find optimal parameters. No need to manually select moving average period, the strategy will test different periods and find the optimum.
Reduce false signals. Compared with fixed period MA, the adaptive MA can filter out more noise and reduce many false signals.
Adapt to market changes. When market switches from range-bound to trending, the MA period will automatically increase to generate signals; when market switches from trending to range-bound, the MA period will automatically decrease. So the strategy can dynamically adapt to market changes.
Simplify trading system. This adaptive method can simplify the whole trading system without manual parameter optimization.
Good scalability. The concept can be applied to other indicators like adaptive Bollinger Bands, adaptive KD etc.
Risk Analysis
There are also some risks to note for this strategy:
Call option risk. When market has a call option pattern, the candle body may fail to break the MA line, resulting in wrong signals. Filter conditions need to be added to reduce such risk.
Failed breakout risk. MA breakout does not always continuation, some failed breakouts may occur. Breakout validation is needed to ensure high success rate.
Trend reversal risk. Trend reversal after entering the trend needs to be switched timely, otherwise it may cause losses. Stop loss should be set to control the loss.
Parameter optimization risk. Adaptive adjusted parameters may fall into local optimization, resulting in redundant MAs. Model evaluation methods need to be introduced to avoid this problem.
Overfitting risk. Excessive parameter tuning may lead to overfitting and lose the model generalization ability. Prolonged verification in different market environments is needed, not just rely on backtest results.
Improvement Directions
Some directions to improve this adaptive MA strategy:
Add trend breakout validation via consecutive breakouts to filter false breakouts.
Increase stop loss strategy, stop loss when price moves back to the other side of MA.
Add option filter to avoid wrong signals when call option appears.
Introduce evaluation metrics like IC, LIC, SIC etc. to constrain parameter tuning and prevent overfitting.
Expand to other indicators like adaptive golden cross strategy, adaptive Bollinger Bands etc.
Optimize MA calculation by using weighted MA, exponential MA etc. to get smoother MA.
Summary
This strategy generates trading signals by adaptively adjusting the MA period to find optimal parameters. Compared with fixed parameters, it can reduce many false signals and adapt to market changes. But we also need to watch out for potential risks, and do verification and walk-forward optimization before applying it in live trading for steady profits.
Parameters
| Name | Default | What it controls |
|---|---|---|
| v_input_1 | 20 | Sensitivity |
| v_input_2 | 3 | Smoothing |
| v_input_3_close | 0 | Source: close | high | low | open | hl2 | hlc3 | hlcc4 | ohlc4 |
| v_input_4 | 2020 | Start year |
Source Pine Script
/*backtest
start: 2022-11-10 00:00:00
end: 2023-11-16 00:00:00
period: 1d
basePeriod: 1h
exchanges: [{"eid":"Futures_Binance","currency":"BTC_USDT"}]
*/

// This source code is subject to the terms of the Mozilla Public License 2.0 at https://mozilla.org/MPL/2.0/
// © fondDealer96636

//@version=5

strategy('Automatic Moving Average', overlay=true, max_bars_back=201, pyramiding=0, currency=currency.USD, default_qty_type=strategy.cash, default_qty_value=10000, initial_capital=10000)

// input
start = 20
lookback = input(20, "Sensitivity", tooltip="Low (High Sensitivity), High (Low Sensitivity).\n\nAdjust according to timeframe and asset.")
smoothing = input(3, "Smoothing")
source = input(close, "Source")
startYear = input(2020, "Start year")
resp = 1

in_date_range = time >= timestamp(syminfo.timezone, startYear, 1, 1, 0, 0)

// global
var ix = -1
var mal = array.new_int(0)


// functions
avg(source, len) =>
    sum = 0.0
    for i = 0 to len-1
        sum += source[i]
    sum/len

bull = close > open

wick_touch(x) =>
    bull ? ((close <= x and x <= high) or (low <= x and x <= open)) : ((open <= x and x <= high) or (low <= x and x <= close))

body_touch(x) =>
    bull ? (open < x and x < close) : (close < x and x < open)

touches(t) =>
    touches = 0
    for i = 0 to lookback-1
        touches += t[i] ? 1 : 0
    touches


// local
ix := ix+1
prev_mal = ix >= 1 ? array.get(mal, ix-1) : start

cma = avg(source, prev_mal)
cma_p1 = avg(source, prev_mal+1)
cma_m1 = avg(source, prev_mal-1)

d = touches(wick_touch(cma))
d_p1 = touches(wick_touch(cma_p1))
d_m1 = touches(wick_touch(cma_m1))

d_b = touches(body_touch(cma))
d_p1_b = touches(body_touch(cma_p1))
d_m1_b = touches(body_touch(cma_m1))

any_body_touch = d_b > 0 or d_p1_b > 0 or d_m1_b > 0
no_wick_touch = d <= 0 and d_p1 <= 0 and d_m1 <= 0
wick_maximized = d >= d_p1 and d >= d_m1 ? prev_mal : (d_p1 >= d and d_p1 >= d_m1 ? prev_mal+resp : (d_m1 >= d and d_m1 >= d_p1 ? prev_mal-resp : na))

up = cma > cma[1]
down = cma < cma[1]
against_trend = (up and close < cma) or (down and close > cma)

new_mal = no_wick_touch or against_trend ? prev_mal-resp : (any_body_touch ? prev_mal+resp : wick_maximized)
next_mal = na(new_mal) ? prev_mal : new_mal

array.push(mal, next_mal < 2 ? 2 : (next_mal > 200 ? 200 : next_mal))


// graph
scma = ta.ema(cma, smoothing)

uptrend = scma > scma[1]
downtrend = scma < scma[1]

plot(scma, "Automatic MA", color=uptrend ? color.green : color.red)

uptrending = close > scma and uptrend
downtrending = close < scma and downtrend

defy = not uptrending and not downtrending
defy_cross = defy and body_touch(scma)

barcolor(uptrending ? color.lime : (downtrending ? color.red : (defy_cross ? color.black : color.white)))


// strategy
change_to_uptrend = uptrending and downtrend[1]
change_to_downtrend = downtrending and uptrend[1]

long = in_date_range and change_to_uptrend
short = in_date_range and change_to_downtrend

if long
    strategy.entry("Long", strategy.long)
if short
    strategy.entry("Short", strategy.short)
Published by ChaoZhang on the FMZ strategy square · last modified 2023-11-17. Collected in the Quant Trading Vault. Unvalidated research: re-test with your own data and costs before trusting it.
Build this with AgenKit
A spec is not a trading system. Paste this into your coding agent and AgenKit runs a specialist team — architecture, test-first build, risk gates, review — with paper trading on by default.
/agenkit build a production-grade trading bot with a backtest engine, risk controls and paper trading by default from strategies/Adaptive-Moving-Average-Quantitative-Strategy.md- npx agenkit install engineering-kit in your project
- Paste the command into your agent and approve each phase
- Get tests, backtest, risk controls and a paper-trading switch
Understand it first
Before you run this, read the lesson behind the idea and how to backtest it honestly. Specs like this one are the survivors of an unknown number of trials; deflate their results accordingly.
Related specs
- ATR and Moving Average Crossover Hybrid StrategyPine Script · Trend following · 1h
- Bollinger Band Moving Average Crossover StrategyPine Script · Trend following · 1h
- Bollinger Bands and EMA Trend Following StrategyPine Script · Trend following · 1h
- Bollinger Bands and RSI Trend Following StrategyPine Script · Trend following · 1h
- Dual Moving Average Crossover Dynamic Position Optimization Strategy with EMA Cross Signal SystemPine Script · Trend following · 1h
- EMA Cross Trend Following Strategy with SMA Stop Loss and Re Entry MechanismPine Script · Trend following · 1h