Adaptive Moving Stop Line Trading Strategy
The core idea of this strategy is to use the T3 moving average and ATR adaptive trailing stop to capture entry and exit points along the trend. It belongs to the trend following strategies. Trading signals are…
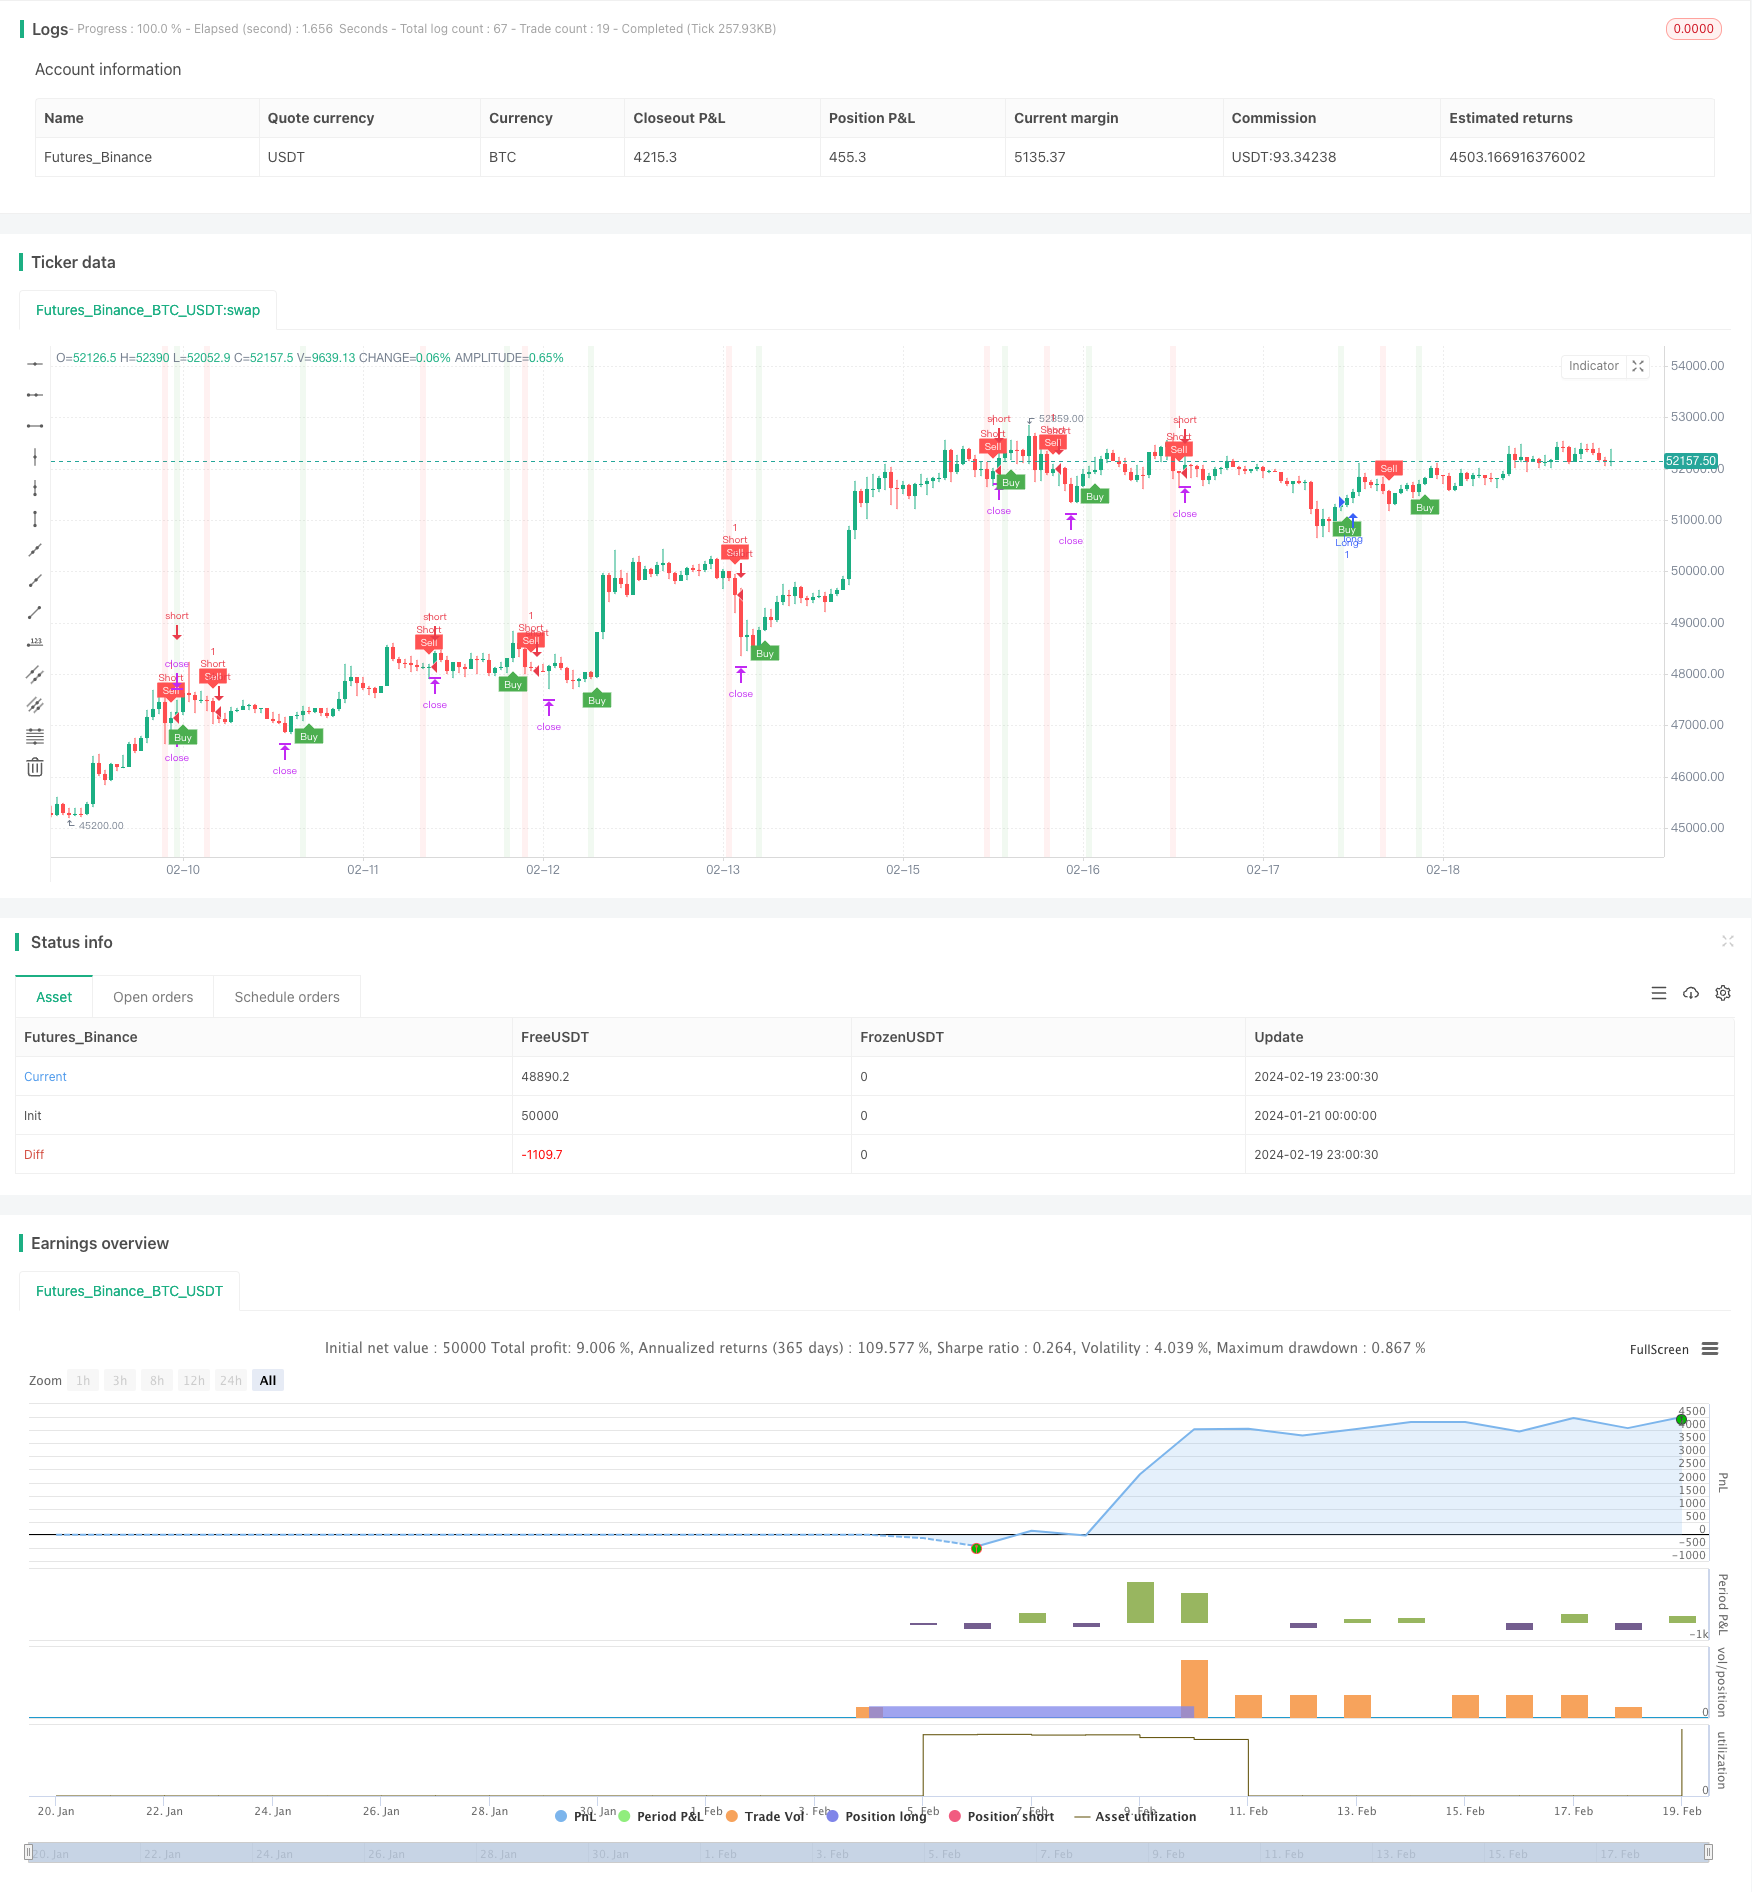
Overview
The core idea of this strategy is to use the T3 moving average and ATR adaptive trailing stop to capture entry and exit points along the trend. It belongs to the trend following strategies. Trading signals are generated when price breaks through the T3 line, and stop loss and take profit levels are set using the ATR value at the breakout point to achieve automatic stop loss and take profit.
Strategy Principle
The strategy consists of the T3 indicator, ATR indicator and ATR trailing stop mechanism.
The T3 moving average is a smoothed moving average that can reduce the lag of the curve and make it respond faster to price changes. A buy signal is generated when the price breaks through the moving average from below. A sell signal is generated when the price breaks through from above.
The ATR indicator is used to calculate the degree of market volatility and set stop loss levels. The larger the ATR value, the greater the market volatility, and a wider stop loss should be set. The smaller the ATR value, the smaller the market volatility, and a narrower stop loss can be set.
The ATR trailing stop mechanism adjusts the stop loss line position based on ATR values in real time, so that the stop loss line can follow the price movement and remain within a reasonable range. This prevents the stop loss from being too close and knocked out easily, and also prevents the stop loss from being too wide to effectively control risks.
By utilizing the T3 to determine direction, ATR to calculate volatility and the ATR trailing stop mechanism, this strategy achieves relatively efficient trend catching and risk control.
Advantages
The advantages of this strategy include:
The application of the T3 line improves the accuracy of catching trends.
The ATR indicator dynamically calculates market volatility, making stop loss and take profit levels more reasonable.
The ATR trailing stop mechanism enables the stop loss line to follow the price movement in real time for effective risk control.
Integrates indicators and stop loss mechanisms to achieve automated trend tracking trading.
Can connect to external trading platforms via webhook for automated order execution.
Risks and Solutions
There are also some risks with this strategy:
Improper T3 parameter settings may miss better trend opportunities. Different cycle parameters can be tested to find the optimal values.
Inaccurate ATR value calculation may lead to stop loss distance being too large or too small to effectively control risk. The ATR cycle parameter can be adjusted combined with market volatility characteristics.
In violent fluctuations, the stop loss line may be broken resulting in excessive losses. A reasonable total loss line can be set to avoid excessive losses per trade.
Frequent stop loss triggering may occur in whipsaw markets. Appropriately widening the ATR trailing stop distance can help.
Optimization Directions
The strategy can be optimized in the following aspects:
Optimize the T3 parameter to find the most suitable smoothing cycle.
Test different ATR cycle parameters to calculate the ATR value that best reflects market volatility.
Optimize the flexible range of the ATR trailing stop distance to prevent over-sensitive stops.
Add appropriate filters to avoid frequent trading in whipsaw markets.
Incorporate trend judging indicators to improve directional profitability accuracy.
Use machine learning methods to automatically optimize parameters.
Conclusion
This strategy integrates the use of the T3 line to determine trend direction, ATR indicator to calculate stops/targets and ATR trailing stop mechanism to adjust stop distance. It achieves automated trend tracking and efficient risk control. It is a reliable trend following strategy. In practical applications, continuous testing and optimization is still needed to find the most suitable parameter combinations for current market conditions, thereby obtaining better strategy results.
Parameters
| Name | Default | What it controls |
|---|---|---|
| v_input_1 | 100 | T3 |
| v_input_2 | true | Key Value. "This changes the sensitivity" |
| v_input_3 | 50 | ATR Period |
| v_input_4 | true | Signals from Heikin Ashi Candles |
| v_input_5 | true | Risk Reward Ratio |
Source Pine Script
/*backtest
start: 2024-01-21 00:00:00
end: 2024-02-20 00:00:00
period: 1h
basePeriod: 15m
exchanges: [{"eid":"Futures_Binance","currency":"BTC_USDT"}]
*/

//@version=5
strategy(title='UT Bot Alerts (QuantNomad) Strategy', overlay=true)
T3 = input(100)//600
// Input for Long Settings
// Input for Long Settings


xPrice3 = close
xe1 = ta.ema(xPrice3, T3)
xe2 = ta.ema(xe1, T3)
xe3 = ta.ema(xe2, T3)
xe4 = ta.ema(xe3, T3)
xe5 = ta.ema(xe4, T3)
xe6 = ta.ema(xe5, T3)

b3 = 0.7
c1 = -b3*b3*b3
c2 = 3*b3*b3+3*b3*b3*b3
c3 = -6*b3*b3-3*b3-3*b3*b3*b3
c4 = 1+3*b3+b3*b3*b3+3*b3*b3
nT3Average = c1 * xe6 + c2 * xe5 + c3 * xe4 + c4 * xe3

//plot(nT3Average, color=color.white, title="T3")

// Buy Signal - Price is below T3 Average
buySignal3 = xPrice3 < nT3Average
sellSignal3 = xPrice3 > nT3Average
// Inputs
a = input(1, title='Key Value. "This changes the sensitivity"')
c = input(50, title='ATR Period')
h = input(true, title='Signals from Heikin Ashi Candles')
riskRewardRatio = input(1, title='Risk Reward Ratio')

xATR = ta.atr(c)
nLoss = a * xATR

src = h ? request.security(ticker.heikinashi(syminfo.tickerid), timeframe.period, close, lookahead=barmerge.lookahead_off) : close

xATRTrailingStop = 0.0
iff_1 = src > nz(xATRTrailingStop[1], 0) ? src - nLoss : src + nLoss
iff_2 = src < nz(xATRTrailingStop[1], 0) and src[1] < nz(xATRTrailingStop[1], 0) ? math.min(nz(xATRTrailingStop[1]), src + nLoss) : iff_1
xATRTrailingStop := src > nz(xATRTrailingStop[1], 0) and src[1] > nz(xATRTrailingStop[1], 0) ? math.max(nz(xATRTrailingStop[1]), src - nLoss) : iff_2

pos = 0
iff_3 = src[1] > nz(xATRTrailingStop[1], 0) and src < nz(xATRTrailingStop[1], 0) ? -1 : nz(pos[1], 0)
pos := src[1] < nz(xATRTrailingStop[1], 0) and src > nz(xATRTrailingStop[1], 0) ? 1 : iff_3

xcolor = pos == -1 ? color.red : pos == 1 ? color.green : color.blue

ema = ta.ema(src, 1)
above = ta.crossover(ema, xATRTrailingStop)
below = ta.crossunder(ema, xATRTrailingStop)

buy = src > xATRTrailingStop and above
sell = src < xATRTrailingStop and below

barbuy = src > xATRTrailingStop
barsell = src < xATRTrailingStop

plotshape(buy, title='Buy', text='Buy', style=shape.labelup, location=location.belowbar, color=color.new(color.green, 0), textcolor=color.new(color.white, 0), size=size.tiny)
plotshape(sell, title='Sell', text='Sell', style=shape.labeldown, location=location.abovebar, color=color.new(color.red, 0), textcolor=color.new(color.white, 0), size=size.tiny)

barcolor(barbuy ? color.new(color.green, 90) : na)
barcolor(barsell ? color.new(color.red, 90) : na)

var float entryPrice = na
var float takeProfitLong = na
var float stopLossLong = na
var float takeProfitShort = na
var float stopLossShort = na

if buy and buySignal3
    entryPrice := src
    takeProfitLong := entryPrice + nLoss * riskRewardRatio
    stopLossLong := entryPrice - nLoss
    takeProfitShort := na
    stopLossShort := na

if sell and sellSignal3
    entryPrice := src
    takeProfitShort := entryPrice - nLoss * riskRewardRatio
    stopLossShort := entryPrice + nLoss
    takeProfitLong := na
    stopLossLong := na

// Strategy order conditions
acct = "Sim101"
ticker = "ES 12-23"
qty = 1

OCOMarketLong = '{ "alert": "OCO Market Long", "account": "' + str.tostring(acct) + '", "ticker": "' + str.tostring(ticker) + '", "qty": "' + str.tostring(qty) + '", "take_profit_price": "' + str.tostring(takeProfitLong) + '", "stop_price": "' + str.tostring(stopLossLong) + '", "tif": "DAY" }'
OCOMarketShort = '{ "alert": "OCO Market Short", "account": "' + str.tostring(acct) + '", "ticker": "' + str.tostring(ticker) + '", "qty": "' + str.tostring(qty) + '", "take_profit_price": "' + str.tostring(takeProfitShort) + '", "stop_price": "' + str.tostring(stopLossShort) + '", "tif": "DAY" }'
CloseAll = '{ "alert": "Close All", "account": "' + str.tostring(acct) + '", "ticker": "' + str.tostring(ticker) + '" }'

strategy.entry("Long", strategy.long, when=buy and buySignal3, alert_message=OCOMarketLong)
strategy.entry("Short", strategy.short, when=sell and sellSignal3, alert_message=OCOMarketShort)

// Setting the take profit and stop loss for long trades
strategy.exit("Take Profit/Stop Loss", "Long", stop=stopLossLong, limit=takeProfitLong,alert_message=CloseAll)

// Setting the take profit and stop loss for short trades
strategy.exit("Take Profit/Stop Loss", "Short", stop=stopLossShort, limit=takeProfitShort,alert_message=CloseAll)

// Plot trade setup boxes
bgcolor(buy ? color.new(color.green, 90) : na, transp=0, offset=-1)
bgcolor(sell ? color.new(color.red, 90) : na, transp=0, offset=-1)

longCondition = buy and not na(entryPrice)
shortCondition = sell and not na(entryPrice)

// var line longTakeProfitLine = na
// var line longStopLossLine = na
// var line shortTakeProfitLine = na
// var line shortStopLossLine = na

// if longCondition
//     longTakeProfitLine := line.new(bar_index, takeProfitLong, bar_index + 1, takeProfitLong, color=color.green, width=2)
//     longStopLossLine := line.new(bar_index, stopLossLong, bar_index + 1, stopLossLong, color=color.red, width=2)
//     // label.new(bar_index + 1, takeProfitLong, str.tostring(takeProfitLong, "#.#####"), color=color.green, style=label.style_none, textcolor=color.green, size=size.tiny)
//     // label.new(bar_index + 1, stopLossLong, str.tostring(stopLossLong, "#.#####"), color=color.red, style=label.style_none, textcolor=color.red, size=size.tiny)

// if shortCondition
//     shortTakeProfitLine := line.new(bar_index, takeProfitShort, bar_index + 1, takeProfitShort, color=color.green, width=2)
//     shortStopLossLine := line.new(bar_index, stopLossShort, bar_index + 1, stopLossShort, color=color.red, width=2)
//     // label.new(bar_index + 1, takeProfitShort, str.tostring(takeProfitShort, "#.#####"), color=color.green, style=label.style_none, textcolor=color.green, size=size.tiny)
//     // label.new(bar_index + 1, stopLossShort, str.tostring(stopLossShort, "#.#####"), color=color.red, style=label.style_none, textcolor=color.red, size=size.tiny)

alertcondition(buy, 'UT Long', 'UT Long')
alertcondition(sell, 'UT Short', 'UT Short')
Published by ChaoZhang on the FMZ strategy square · last modified 2024-02-21. Collected in the Quant Trading Vault. Unvalidated research: re-test with your own data and costs before trusting it.
Build this with AgenKit
A spec is not a trading system. Paste this into your coding agent and AgenKit runs a specialist team — architecture, test-first build, risk gates, review — with paper trading on by default.
/agenkit build a production-grade trading bot with a backtest engine, risk controls and paper trading by default from strategies/Adaptive-Moving-Stop-Line-Trading-Strategy.md- npx agenkit install engineering-kit in your project
- Paste the command into your agent and approve each phase
- Get tests, backtest, risk controls and a paper-trading switch
Understand it first
Before you run this, read the lesson behind the idea and how to backtest it honestly. Specs like this one are the survivors of an unknown number of trials; deflate their results accordingly.
Related specs
- Dynamic ATR based Trailing Stop Trading StrategyPine Script · Breakout · 1d
- Kana Candle Breakout Strategy Based on Moving Average and Support ResistancePine Script · Breakout · 1h
- Momentum Breakout Trading Strategy 440964Pine Script · Breakout · 5m
- Moving Average Bollinger Bands Breakout StrategyPine Script · Breakout · 1h
- Quantitative Trading Strategy Based on Ichimoku with Multiple SignalsPine Script · Breakout · 1h
- Momentum Breakout Strategy 432076Pine Script · Breakout · 1d