Momentum Breakout Trading Strategy 440964
This is a momentum-based breakout trading strategy. It uses moving averages, ATR, RSI and other indicators to judge market trends and volatility, combined with strict stop loss/take profit settings for trading. The…
Overview
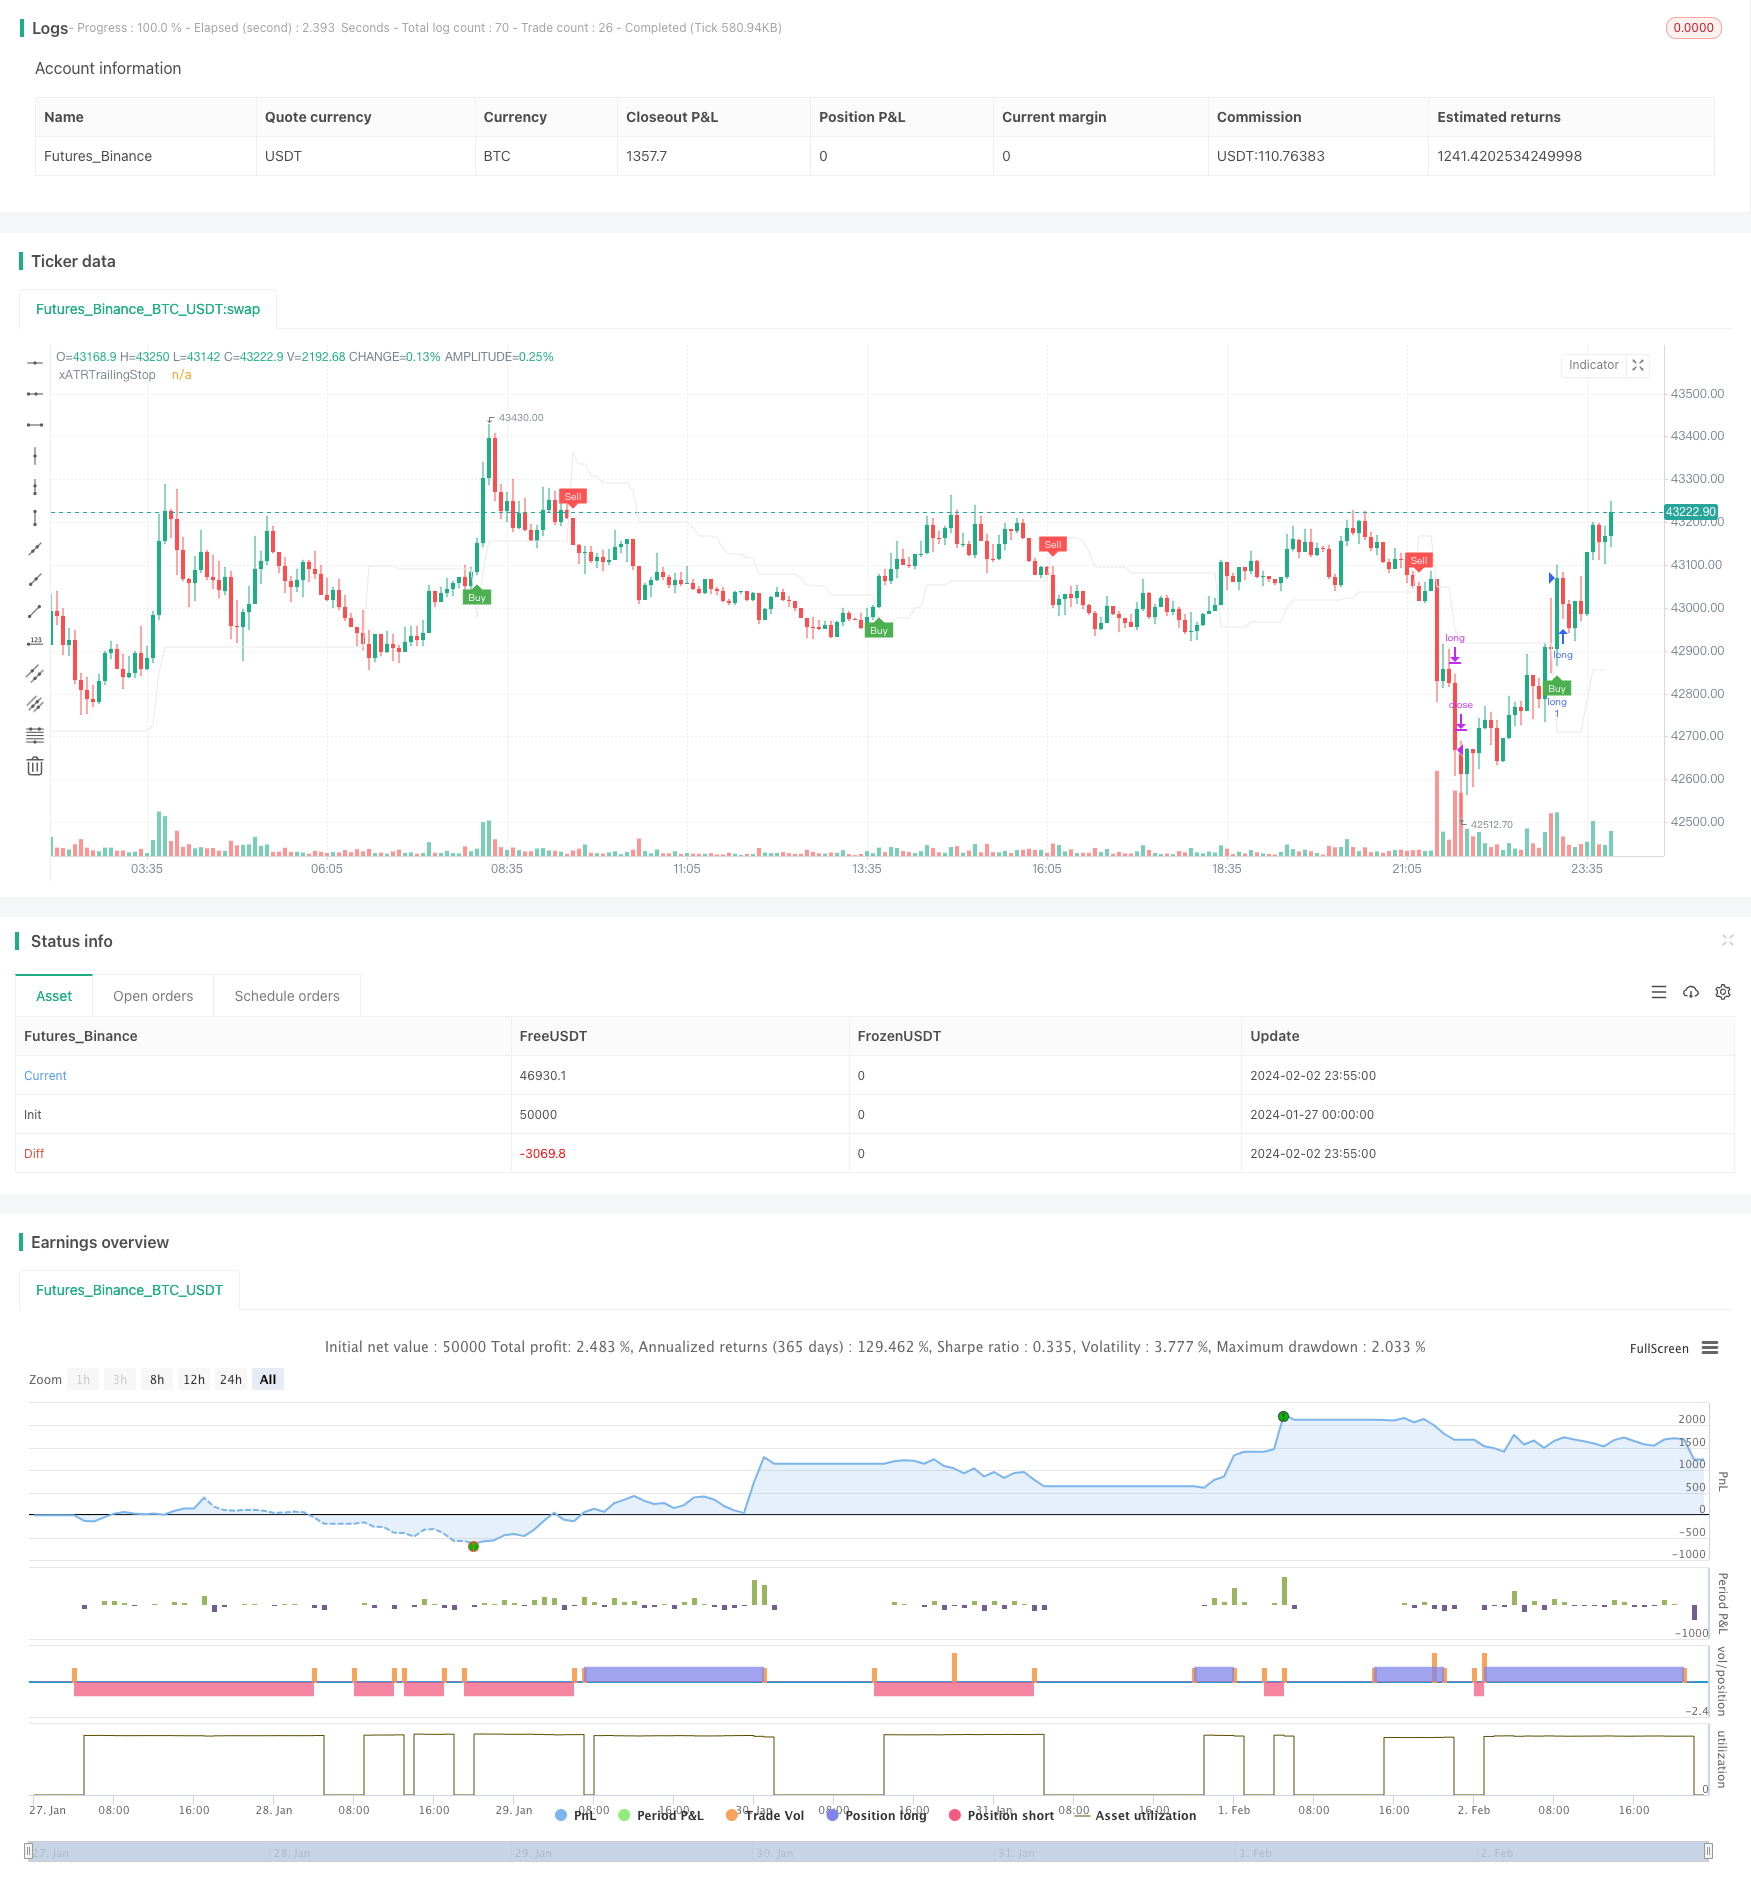
This is a momentum-based breakout trading strategy. It uses moving averages, ATR, RSI and other indicators to judge market trends and volatility, combined with strict stop loss/take profit settings for trading. The strategy mainly judges whether prices break through or fall below the moving averages plus the ATR range to generate trading signals.
Strategy Principle
The main points of this strategy are:
Use EMA to judge the price trend direction. Price crossing above EMA is bullish signal and crossing below is bearish signal.
ATR indicates market volatility. ATR multiplied by a coefficient serves as the stop loss range. This can effectively control single loss.
RSI indicates overbought/oversold status. Breakout trades signaled by stop loss price and EMA crossover must happen when RSI is not in overbought/oversold zone. This avoids false breakout.
Use previous period high/low points as take profit basis. Tracking take profit price can lock in more profits.
Strict stop loss/take profit rules. ATR-based stop loss controls risks and take profit locks in gains.
Entry signal triggers when price breaks out of EMA plus ATR stop loss range. For bullish signals, price needs to cross above the high point. For bearish signals, price needs to break below the low point.
Advantage Analysis
Advantages of this strategy:
Multiple indicators avoid false breaks and improve accuracy
ATR stop loss keeps losses at reasonable level
Dynamic take profit tracking maximizes profits
Strict rules facilitate risk control
Large optimization space for indicators and parameters to adapt to different markets
Risk Analysis
Risks of this strategy:
Profitability correlates with market volatility. Gains could be limited if trend is unclear or cycle is long.
Stop loss price may whipsaw before breaking out again. This leads to missing trends. Can relax stop loss price a bit.
3.There is potential for chasing in trending markets.
Optimization Directions
Optimization ideas:
Adjust MA, ATR parameters for different products and timeframes.
Add more indicators like MACD, KDJ for overbought/oversold.
Dynamically adjust ATR coefficient based on real-time ATR values for adaptive stops.
Establish combo systems with multiple timeframes. Different timeframe indicators can improve signal quality.
Utilize machine learning for parameters/indicators optimization to achieve best performance.
Summary
This strategy utilizes indicators for judgment and strict stop loss/take profit. It takes advantage of moving averages, ATR and RSI to determine market trends. With strict risk control, it can ride trends while managing risks. Further parameter and rules optimization can make it a long-term profitable trading system.
Parameters
| Name | Default | What it controls |
|---|---|---|
| v_input_1 | 2 | emaLengh |
| v_input_2 | 3 | Key Vaule. 'This changes the sensitivity' |
| v_input_3 | 10 | ATR Period |
| v_input_4 | false | Signals from Heikin Ashi Candles |
| v_input_5 | 9 | emaLengh show |
| v_input_6 | 0.00025 | Volatilitymin |
| v_input_7 | 0.00045 | Volatilitymax |
| v_input_8 | 20 | adx_length |
| v_input_9 | 14 | adx_min |
| v_input_10 | 11 | sma_length |
| v_input_11 | 9 | rsi_len |
| v_input_12 | 20 | length |
| v_input_13 | 2 | StdDev |
| v_input_14 | 50 | zlsma-Length |
| v_input_15 | false | zlsma-Offset |
| v_input_16 | 0.015 | Minimum rate of return |
| v_input_17 | 10 | Profit-to-drawdown ratio for closing positions |
| v_input_18 | 0.004 | Retracement rate |
Source Pine Script
/*backtest
start: 2024-01-27 00:00:00
end: 2024-02-03 00:00:00
period: 5m
basePeriod: 1m
exchanges: [{"eid":"Futures_Binance","currency":"BTC_USDT"}]
*/

//@version=4
strategy(title="UT Bot Strategy", overlay = true)
//CREDITS to HPotter for the orginal code. The guy trying to sell this as his own is a scammer lol.
// Inputs
emaLengh = input(2, title = "emaLengh")
a = input(3.0,     title = "Key Vaule. 'This changes the sensitivity'")
c = input(10,    title = "ATR Period")
h = input(false, title = "Signals from Heikin Ashi Candles")
emaLengh2 = input(9, title = "emaLengh show")


rate = input(0.00025,    title = "Volatilitymin")
rateMax = input(0.00045,    title = "Volatilitymax")
adx_length =   input(20,    title = "adx_length")
adx_min =   input(14,    title = "adx_min")

sma_length =   input(11,    title = "sma_length")
rsi_len = input(9, title = "rsi_len")

src = h ? security(heikinashi(syminfo.tickerid), timeframe.period, close, lookahead = false) : close

// boll Channel----------------------------------------------------
length = input(20, minval=1)
mult = input(2.0, minval=0.001, maxval=50, title="StdDev")
basis = sma(src, length)
dev = mult * stdev(src, length)
upper = basis + dev
lower = basis - dev
bbr = (src - lower)/(upper - lower)
// plot(upper, color = color.rgb(46, 59, 240), title="upper")
// plot(lower, color = color.rgb(46, 59, 240), title="lower")


// plot(bbr, "Bollinger Bands %B", color=#26A69A)
// band1 = hline(1, "Overbought", color=#787B86, linestyle=hline.style_dashed)
// hline(0.5, "Middle Band", color=color.new(#787B86, 50))
// band0 = hline(0, "Oversold", color=#787B86, linestyle=hline.style_dashed)
// fill(band1, band0, color=color.rgb(38, 166, 154, 90), title="Background")
// boll Channel----------------------------------------------------

// Linear Regression --------------------------------------------------------------
zlsma_length = input(title="zlsma-Length", type=input.integer, defval=50)
zlsma_offset = input(title="zlsma-Offset", type=input.integer, defval=0)
lsma = linreg(src, zlsma_length, zlsma_offset)
lsma2 = linreg(lsma, zlsma_length, zlsma_offset)
eq= lsma-lsma2
zlsma = lsma+eq
// plot(zlsma , color = color.rgb(243, 243, 14), title="zlsma",linewidth=3)
// Linear Regression --------------------------------------------------------------


// --------------------------------
rsi = rsi(src, 6)

// xHH = sma(high, sma_length)
// xLL = sma(low, sma_length)
// movevalue = (xHH - xLL) / 2
// xHHM = xHH + movevalue
// xLLM = xLL - movevalue

// plot(xHHM, color = color.rgb(208, 120, 219), title="xHHM")
// plot(xLLM, color = color.rgb(208, 120, 219), title="xLLM")


xATR  = atr(c)
nLoss = a * xATR


xATRTrailingStop = 0.0
xATRTrailingStop := iff(src > nz(xATRTrailingStop[1], 0) and src[1] > nz(xATRTrailingStop[1], 0), max(nz(xATRTrailingStop[1]), src - nLoss),
   iff(src < nz(xATRTrailingStop[1], 0) and src[1] < nz(xATRTrailingStop[1], 0), min(nz(xATRTrailingStop[1]), src + nLoss),
   iff(src > nz(xATRTrailingStop[1], 0), src - nLoss, src + nLoss)))


pos = 0
pos :=	iff(src[1] < nz(xATRTrailingStop[1], 0) and src > nz(xATRTrailingStop[1], 0), 1,
   iff(src[1] > nz(xATRTrailingStop[1], 0) and src < nz(xATRTrailingStop[1], 0), -1, nz(pos[1], 0)))

xcolor = pos == -1 ? color.red: pos == 1 ? color.green : color.blue

ema   = ema(src,emaLengh)
// sma   = sma(src,emaLengh)
emaFast   = ema(src,100)
emaSlow   = ema(src,576)
emaShow   = ema(src, emaLengh2)
// sma       =  sma(src, 8)

// [superTrend, dir] = supertrend(3, 200)
// Determine consecutive rises

[diplus, diminus, adx] = dmi(adx_length, adx_length)


above = crossover(ema, xATRTrailingStop)
below = crossover(xATRTrailingStop, ema)
// above = ema == xATRTrailingStop
// below = xATRTrailingStop== ema

// smaabove = crossover(src, sma)
// smabelow = crossover(sma, src)
// smaabove = src > sma
// smabelow = sma > src
close_rate (n)=>
    abs(close[n]-open[n])/min(close[n],open[n])

rate_val = close_rate(0)
rate_val1 = close_rate(1)

buy  = src > xATRTrailingStop and above  and src > zlsma  and adx >adx_min
// and  src>emaShow
// and rate_val < rate_val1*2 and rate_val >=rate_val1
// and rate_val1<rateMax
// and close[1]>open[1]
sell = src < xATRTrailingStop and below  and src < zlsma and adx >adx_min
// and  src<emaShow
// and rate_val < rate_val1*2  and rate_val >=rate_val1
//  and rate_val1<rateMax
// and open[1]>close[1]  and rate_val1 > rate

// buy  = src > xATRTrailingStop
// sell = src < xATRTrailingStop
// plot(rate_val1 , color = color.red, title="rate_val1")


barbuy  = src > xATRTrailingStop
barsell = src < xATRTrailingStop

atrRsi = rsi(xATRTrailingStop,rsi_len)

// plot(emaFast , color = color.rgb(243, 206, 127), title="emaFast")
// plot(ema , color = color.rgb(47, 227, 27), title="ut-ema")


// plot(emaShow , color = color.rgb(47, 227, 27), title="ema9")

plot(xATRTrailingStop, color = color.rgb(233, 233, 232), title="xATRTrailingStop")

plotshape(buy,  title = "Buy",  text = 'Buy',  style = shape.labelup,   location = location.belowbar, color= color.green, textcolor = color.white, size = size.tiny)
plotshape(sell, title = "Sell", text = 'Sell', style = shape.labeldown, location = location.abovebar, color= color.red,   textcolor = color.white, size = size.tiny)


// plotshape(buy,  title = "Sell",  text = 'Sell',  style = shape.labelup,   location = location.belowbar, color= color.green, textcolor = color.white, transp = 0, size = size.tiny)
// plotshape(sell, title = "buy", text = 'buy', style = shape.labeldown, location = location.abovebar, color= color.red,   textcolor = color.white, transp = 0, size = size.tiny)

// barcolor(barbuy  ? color.green : na)
// barcolor(barsell ? color.red   : na)

// strategy.entry("short",   false, when = buy)
// strategy.entry("long ", true, when = sell)


strategy.entry("long",   true, when = buy and strategy.position_size == 0)
strategy.entry("short", false, when = sell and strategy.position_size == 0)


//Dynamic Take Profitstart------------------------------------------------------------------------------------------
profit = input( 0.015,     title = "Minimum rate of return")
close_profit_rate = input( 10,     title = "Profit-to-drawdown ratio for closing positions")
loss = input(0.004,    title = "Retracement rate")

// Profit drawdown ratio
profit_price_scale =profit/close_profit_rate

var float profit_price = 0


// Calculate small profit price

get_profit_price(long) =>
    float res = 0
    if long == true
        res := strategy.position_avg_price * (1+profit)
    if long == false
        res := strategy.position_avg_price * (1-profit)
    res

// Take-profit closing conditions
close_profit_position(long)=>
    bool result=false
    if long == true and profit_price>0 and profit_price*(1-profit_price_scale) >=close and  get_profit_price(true) <= close
        result:=true
    if long == false and profit_price>0 and profit_price*(1+profit_price_scale) <=close and  get_profit_price(false) >= close
        result:=true
    result

// Update dynamic take profit price
update_profit_price(price)=>
    float res = price
   // When no position, dynamic take-profit price is0
    if strategy.position_size == 0
        res := 0
   // long - Save when the price is greater than the minimum profit
    if strategy.position_size > 0 and get_profit_price(true) <= close and (res==0 or res < close)
        res := close
   // short - Save when the price is less than the minimum profit
    if strategy.position_size < 0 and get_profit_price(true) >= close and (res==0 or res > close)
        res := close
    res

///////


profit_price := update_profit_price(profit_price)
long_close_profit_position = close_profit_position(true)
short_close_profit_position = close_profit_position(false)

// plot(profit_price, color = color.green, title="profit_price")
//Dynamic Take Profitend------------------------------------------------------------------------------------------


strategy.close("long",comment="long-take profit",when = strategy.position_size > 0 and long_close_profit_position)

strategy.close("long",comment="long-stop loss",when = strategy.position_size >0 and strategy.position_avg_price * (1-loss) >= close)

strategy.close("short",comment="short-take profit",when = strategy.position_size <0 and short_close_profit_position)

strategy.close("short",comment="short-stop loss",when = strategy.position_size <0 and strategy.position_avg_price * (1+loss) <= close)
Published by ChaoZhang on the FMZ strategy square · last modified 2024-02-04. Collected in the Quant Trading Vault. Unvalidated research: re-test with your own data and costs before trusting it.
Build this with AgenKit
A spec is not a trading system. Paste this into your coding agent and AgenKit runs a specialist team — architecture, test-first build, risk gates, review — with paper trading on by default.
/agenkit build a production-grade trading bot with a backtest engine, risk controls and paper trading by default from strategies/Momentum-Breakout-Trading-Strategy-440964.md- npx agenkit install engineering-kit in your project
- Paste the command into your agent and approve each phase
- Get tests, backtest, risk controls and a paper-trading switch
Understand it first
Before you run this, read the lesson behind the idea and how to backtest it honestly. Specs like this one are the survivors of an unknown number of trials; deflate their results accordingly.
Related specs
- Quantitative Trading Strategy Based on Ichimoku with Multiple SignalsPine Script · Breakout · 1h
- Moving Average Crossover and Upper Rail Breakthrough Impulse StrategyPine Script · Breakout · 1m
- MACD Bollinger Turtle Trading StrategyPine Script · Breakout · 1d
- Cross Timeframe SuperTrend Breakout StrategyPine Script · Breakout · 1h
- Multi Moving Average Supertrend with Bollinger Breakout Trading StrategyPine Script · Breakout · 1d
- Triple Pattern Oscillation Trading StrategyPine Script · Breakout · 1h