Adaptive Multi Level Trading Strategy Based on Fibonacci Retracement
This strategy is an adaptive multi-level trading system based on Fibonacci retracement theory. It utilizes Fibonacci retracement levels to identify key support and resistance levels in the market and generates…
Overview
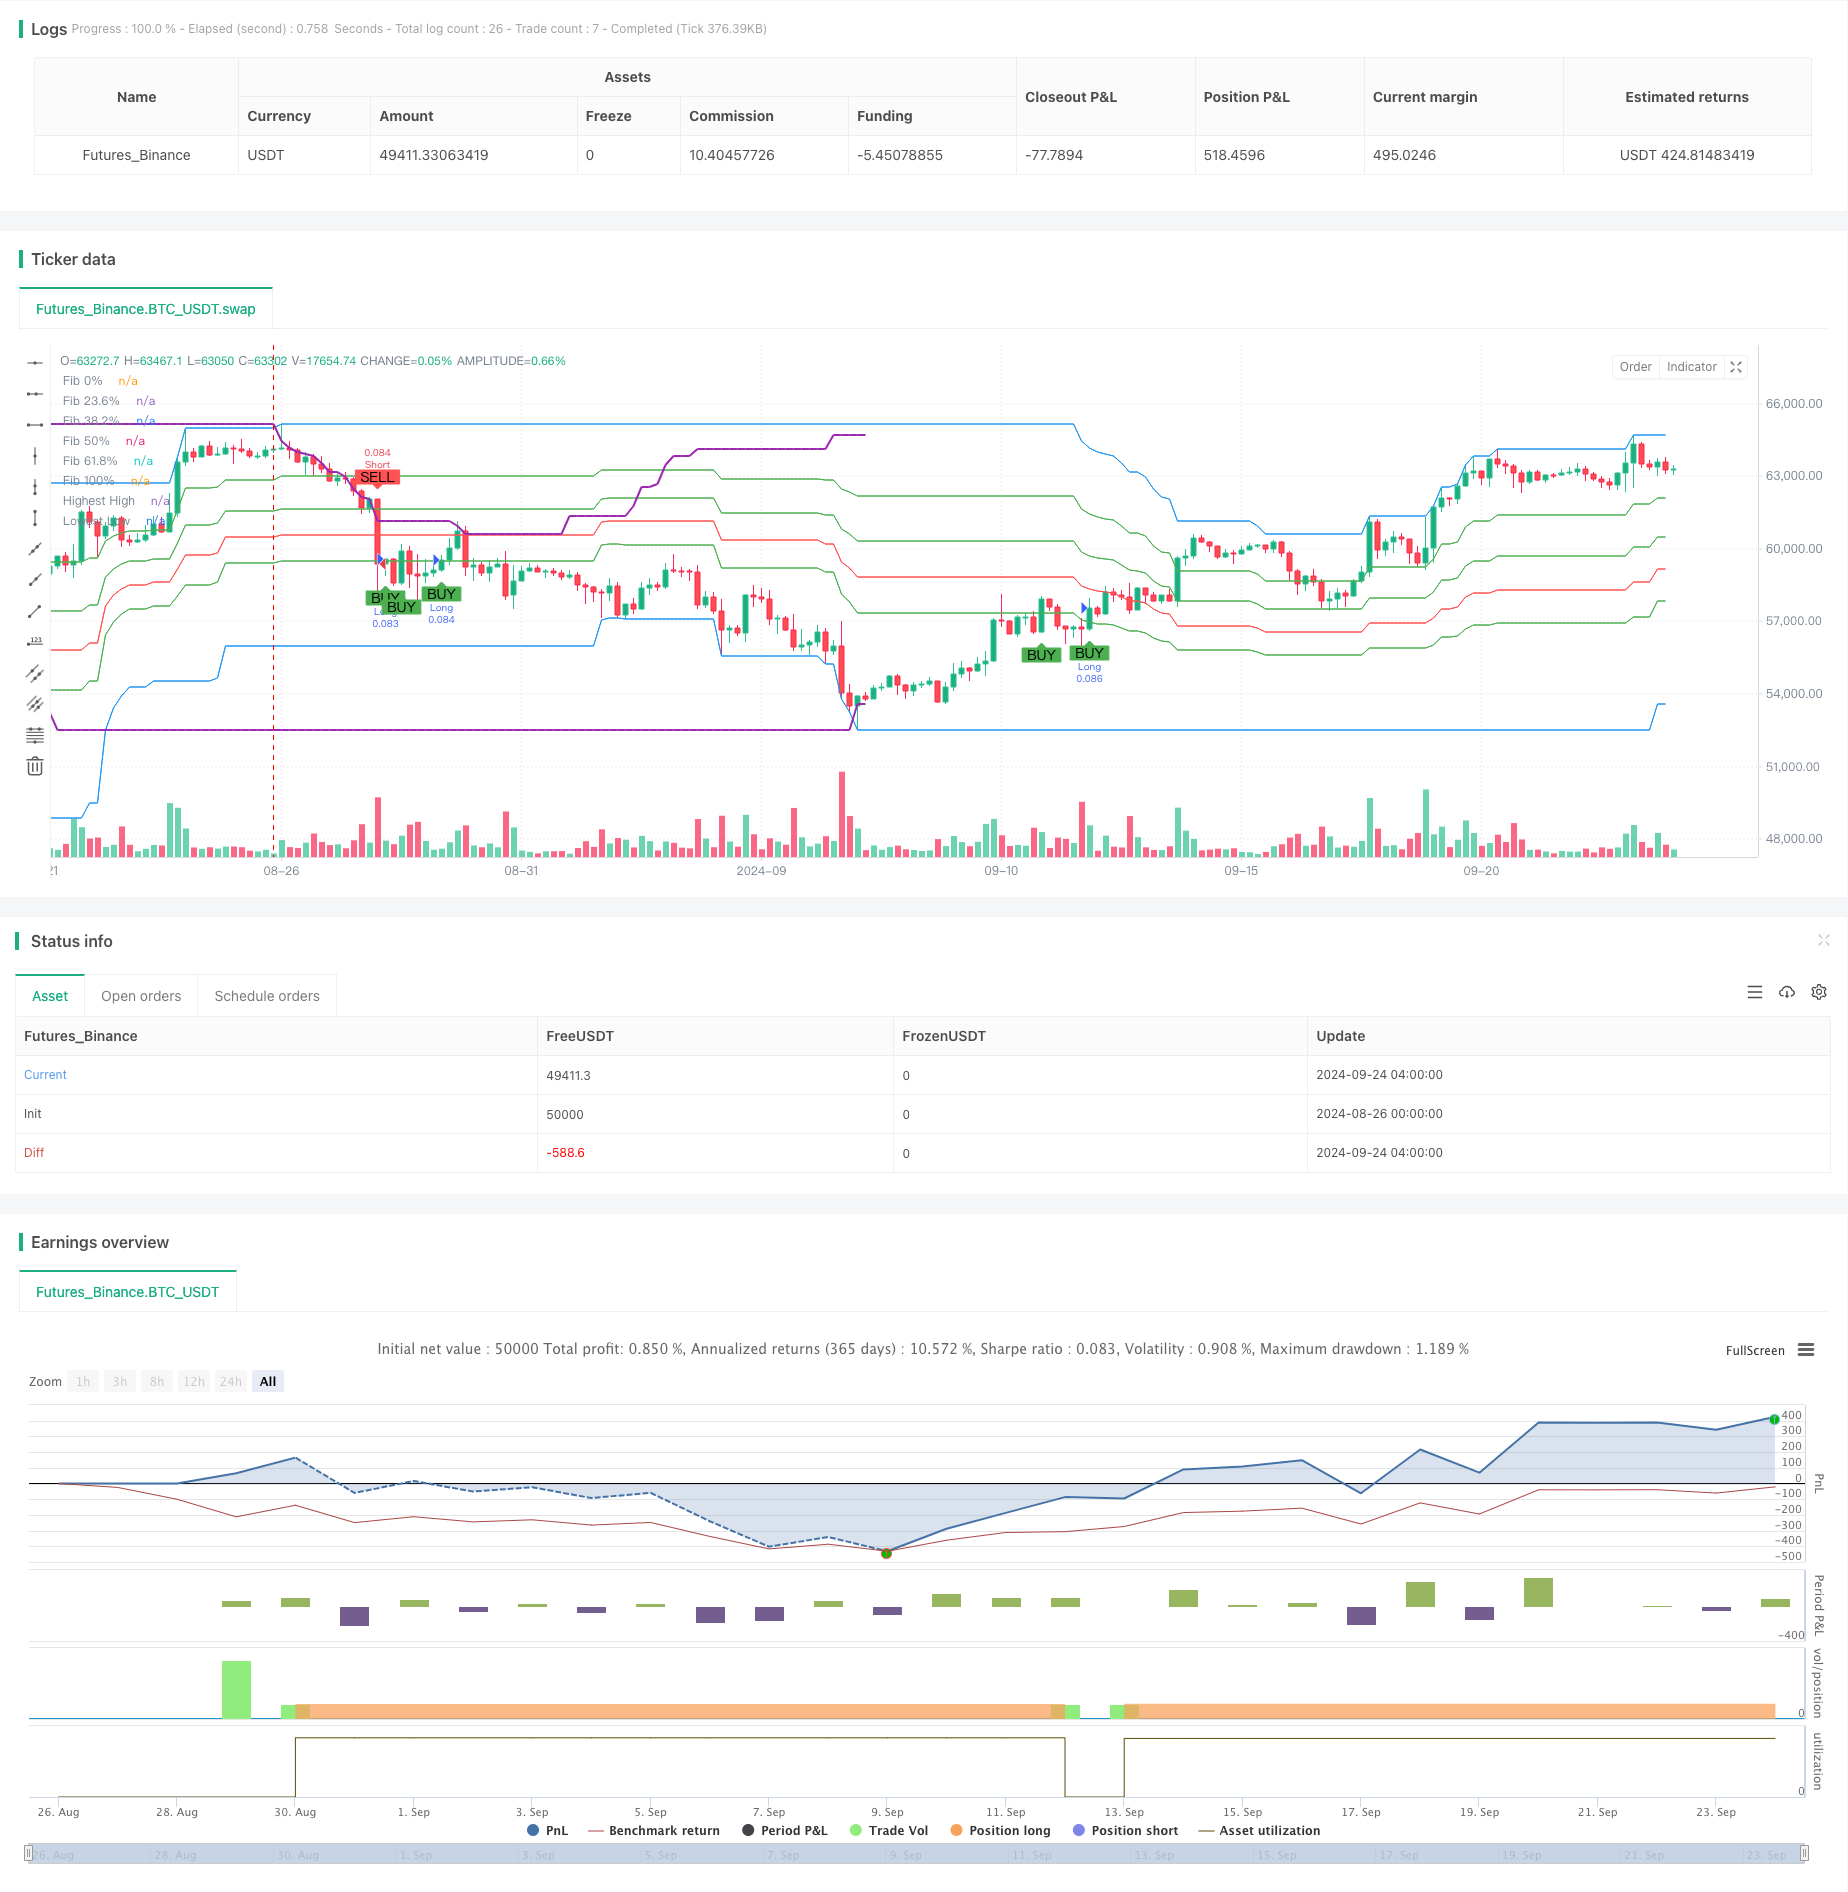
This strategy is an adaptive multi-level trading system based on Fibonacci retracement theory. It utilizes Fibonacci retracement levels to identify key support and resistance levels in the market and generates trading signals based on price interactions with these levels. The core of this strategy lies in its flexibility, allowing traders to adjust key parameters such as lookback period, Fibonacci direction, and entry levels according to market conditions and personal preferences.
Strategy Principle
The core logic of the strategy includes the following steps:
- Determine high and low points: Use a user-defined lookback period to identify the highest and lowest points.
- Calculate Fibonacci levels: Compute key Fibonacci retracement levels (23.6%, 38.2%, 50%, 61.8%) based on the high and low points.
- Generate trading signals: Trigger buy or sell signals when the price breaks through specific Fibonacci levels.
- Risk management: Use take profit and stop loss to manage the risk of each trade.
The uniqueness of the strategy lies in allowing users to choose the direction of Fibonacci calculation (top to bottom or bottom to top), as well as selecting different Fibonacci levels for buy and sell signals. This flexibility enables the strategy to adapt to different market environments and trading styles.
Strategy Advantages
- High adaptability: By allowing users to adjust key parameters, the strategy can adapt to different market conditions and trading instruments.
- Risk management: Built-in take profit and stop loss mechanisms help control the risk of each trade.
- Visual feedback: The strategy plots Fibonacci levels on the chart, providing traders with an intuitive view of market structure.
- Multi-dimensional analysis: By combining price action and Fibonacci levels, the strategy offers a more comprehensive market analysis.
Strategy Risks
- False breakouts: In ranging markets, price may frequently cross Fibonacci levels, leading to false signals.
- Parameter sensitivity: The strategy's performance is highly dependent on parameter settings; improper parameters may result in overtrading or missing important opportunities.
- Trend dependency: In strong trend markets, the strategy may frequently trigger counter-trend trades, increasing the risk of losses.
To mitigate these risks, consider:
- Combining other technical indicators (such as RSI or moving averages) to confirm signals.
- Implementing stricter entry conditions, such as requiring price to maintain a certain level after breakout.
- Dynamically adjusting take profit and stop loss levels based on market volatility.
Strategy Optimization Directions
- Dynamic parameter adjustment: Develop a mechanism to automatically adjust the lookback period and Fibonacci levels based on market volatility.
- Multi-timeframe analysis: Integrate Fibonacci levels from multiple timeframes to improve signal reliability.
- Quantify market environment: Introduce a market environment recognition mechanism to adopt different trading logic in various market states.
- Machine learning integration: Utilize machine learning algorithms to optimize parameter selection and signal generation processes.
- Sentiment indicator integration: Consider incorporating market sentiment indicators (such as VIX) into the decision-making process to better capture market turning points.
These optimizations can significantly enhance the strategy's adaptability and robustness, enabling it to maintain effectiveness across a wider range of market conditions.
Summary
The adaptive multi-level trading strategy based on Fibonacci retracement provides a flexible, customizable framework for identifying potential trading opportunities in financial markets. By combining classical technical analysis principles with modern risk management techniques, this strategy offers traders a powerful tool for seeking high-probability trading opportunities in various market environments. However, like all trading strategies, it is not infallible. Successful application of this strategy requires a deep understanding of its principles, careful parameter tuning, and integration with other analytical tools. Through continuous optimization and risk management, this strategy can become a potent weapon in a trader's toolkit.
Source Pine Script
/*backtest
start: 2024-08-26 00:00:00
end: 2024-09-24 08:00:00
period: 4h
basePeriod: 4h
exchanges: [{"eid":"Futures_Binance","currency":"BTC_USDT"}]
*/

//@version=5
strategy("Simple Fibonacci Retracement Strategy", overlay=true, default_qty_type=strategy.percent_of_equity, default_qty_value=10)

// Input period for high and low points identification
lookback = input.int(100, title="Lookback Period", minval=10)

// Input to choose Fibonacci calculation direction
fib_direction = input.string(title="Fibonacci Direction", defval="Top to Bottom", options=["Top to Bottom", "Bottom to Top"])

// Input for Fibonacci levels
fib_level_236 = input.float(0.236, title="Fib 23.6% Level")
fib_level_382 = input.float(0.382, title="Fib 38.2% Level")
fib_level_50 = input.float(0.5, title="Fib 50% Level")
fib_level_618 = input.float(0.618, title="Fib 61.8% Level")

// Input to choose the level for entry signals
buy_entry_level = input.string(title="Buy Entry Level", defval="Fib 61.8%", options=["Fib 23.6%", "Fib 38.2%", "Fib 50%", "Fib 61.8%"])
sell_entry_level = input.string(title="Sell Entry Level", defval="Fib 38.2%", options=["Fib 23.6%", "Fib 38.2%", "Fib 50%", "Fib 61.8%"])

// Input for take profit and stop loss in pips
take_profit_pips = input.int(50, title="Take Profit (pips)")
stop_loss_pips = input.int(20, title="Stop Loss (pips)")

// Identify high and low points within the lookback period
highestHigh = ta.highest(high, lookback)
lowestLow = ta.lowest(low, lookback)

// Calculate Fibonacci levels based on the selected direction
var float fib_0 = na
var float fib_100 = na
var float fib_236 = na
var float fib_382 = na
var float fib_50 = na
var float fib_618 = na

if fib_direction == "Top to Bottom"
    fib_0 := highestHigh
    fib_100 := lowestLow
    fib_236 := highestHigh - (highestHigh - lowestLow) * fib_level_236
    fib_382 := highestHigh - (highestHigh - lowestLow) * fib_level_382
    fib_50 := highestHigh - (highestHigh - lowestLow) * fib_level_50
    fib_618 := highestHigh - (highestHigh - lowestLow) * fib_level_618
else
    fib_0 := lowestLow
    fib_100 := highestHigh
    fib_236 := lowestLow + (highestHigh - lowestLow) * fib_level_236
    fib_382 := lowestLow + (highestHigh - lowestLow) * fib_level_382
    fib_50 := lowestLow + (highestHigh - lowestLow) * fib_level_50
    fib_618 := lowestLow + (highestHigh - lowestLow) * fib_level_618

// Determine which level to use for buy and sell signals based on user input
var float buy_fib_level = na
var float sell_fib_level = na

if buy_entry_level == "Fib 23.6%"
    buy_fib_level := fib_236
if buy_entry_level == "Fib 38.2%"
    buy_fib_level := fib_382
if buy_entry_level == "Fib 50%"
    buy_fib_level := fib_50
if buy_entry_level == "Fib 61.8%"
    buy_fib_level := fib_618

if sell_entry_level == "Fib 23.6%"
    sell_fib_level := fib_236
if sell_entry_level == "Fib 38.2%"
    sell_fib_level := fib_382
if sell_entry_level == "Fib 50%"
    sell_fib_level := fib_50
if sell_entry_level == "Fib 61.8%"
    sell_fib_level := fib_618

// Convert pips to price units (assuming 1 pip = 0.0001 for currency pairs like EURUSD)
pip_value = syminfo.mintick * 10
take_profit = take_profit_pips * pip_value
stop_loss = stop_loss_pips * pip_value

// Trading signals
var bool longSignal = na
var bool shortSignal = na

if fib_direction == "Top to Bottom"
    longSignal := ta.crossover(close, buy_fib_level) and close > buy_fib_level
    shortSignal := ta.crossunder(close, sell_fib_level) and close < sell_fib_level
else
    longSignal := ta.crossover(close, buy_fib_level) and close > buy_fib_level
    shortSignal := ta.crossunder(close, sell_fib_level) and close < sell_fib_level

// Execute trades based on signals with take profit and stop loss
if (longSignal)
    strategy.entry("Long", strategy.long, comment="BUY")
    strategy.exit("Take Profit/Stop Loss", "Long", limit=close + take_profit, stop=close - stop_loss)

if (shortSignal)
    strategy.entry("Short", strategy.short, comment="SELL")
    strategy.exit("Take Profit/Stop Loss", "Short", limit=close - take_profit, stop=close + stop_loss)

// Plot Fibonacci levels
plot(fib_0, title="Fib 0%", color=color.blue, linewidth=1, style=plot.style_line)
plot(fib_236, title="Fib 23.6%", color=color.green, linewidth=1, style=plot.style_line)
plot(fib_382, title="Fib 38.2%", color=color.green, linewidth=1, style=plot.style_line)
plot(fib_50, title="Fib 50%", color=color.red, linewidth=1, style=plot.style_line)
plot(fib_618, title="Fib 61.8%", color=color.green, linewidth=1, style=plot.style_line)
plot(fib_100, title="Fib 100%", color=color.blue, linewidth=1, style=plot.style_line)

// Create labels for Fibonacci levels with white text
var label fibLabel0 = na
var label fibLabel236 = na
var label fibLabel382 = na
var label fibLabel50 = na
var label fibLabel618 = na
var label fibLabel100 = na

if (na(fibLabel0))
    fibLabel0 := label.new(bar_index, fib_0, text="Fib 0%", color=na, textcolor=color.white, style=label.style_label_right, yloc=yloc.price)
    fibLabel236 := label.new(bar_index, fib_236, text="Fib 23.6%", color=na, textcolor=color.white, style=label.style_label_right, yloc=yloc.price)
    fibLabel382 := label.new(bar_index, fib_382, text="Fib 38.2%", color=na, textcolor=color.white, style=label.style_label_right, yloc=yloc.price)
    fibLabel50 := label.new(bar_index, fib_50, text="Fib 50%", color=na, textcolor=color.white, style=label.style_label_right, yloc=yloc.price)
    fibLabel618 := label.new(bar_index, fib_618, text="Fib 61.8%", color=na, textcolor=color.white, style=label.style_label_right, yloc=yloc.price)
    fibLabel100 := label.new(bar_index, fib_100, text="Fib 100%", color=na, textcolor=color.white, style=label.style_label_right, yloc=yloc.price)
else
    label.set_xy(fibLabel0, bar_index, fib_0)
    label.set_xy(fibLabel236, bar_index, fib_236)
    label.set_xy(fibLabel382, bar_index, fib_382)
    label.set_xy(fibLabel50, bar_index, fib_50)
    label.set_xy(fibLabel618, bar_index, fib_618)
    label.set_xy(fibLabel100, bar_index, fib_100)

// Plot signals
plotshape(series=longSignal, location=location.belowbar, color=color.green, style=shape.labelup, title="Buy Signal", text="BUY")
plotshape(series=shortSignal, location=location.abovebar, color=color.red, style=shape.labeldown, title="Sell Signal", text="SELL")

// Plot highest and lowest points
plot(highestHigh, title="Highest High", color=color.purple, linewidth=2, offset=-lookback)
plot(lowestLow, title="Lowest Low", color=color.purple, linewidth=2, offset=-lookback)
Published by ChaoZhang on the FMZ strategy square · last modified 2024-09-26. Collected in the Quant Trading Vault. Unvalidated research: re-test with your own data and costs before trusting it.
Build this with AgenKit
A spec is not a trading system. Paste this into your coding agent and AgenKit runs a specialist team — architecture, test-first build, risk gates, review — with paper trading on by default.
/agenkit build a production-grade trading bot with a backtest engine, risk controls and paper trading by default from strategies/Adaptive-Multi-Level-Trading-Strategy-Based-on-Fibonacci-Retracement.md- npx agenkit install engineering-kit in your project
- Paste the command into your agent and approve each phase
- Get tests, backtest, risk controls and a paper-trading switch
Understand it first
Before you run this, read the lesson behind the idea and how to backtest it honestly. Specs like this one are the survivors of an unknown number of trials; deflate their results accordingly.
Related specs
- Moving Average Crossover and Upper Rail Breakthrough Impulse StrategyPine Script · Breakout · 1m
- Multi factor Intelligent Trading StrategyPine Script · Breakout · 1d
- Multi Timeframe Trend Breakout Strategy with RSI Filter and ATR Based Risk ManagementPine Script · Breakout
- Fibonacci Bollinger Bands with RSI Dynamic Take Profit StrategyPine Script · Breakout · 1h
- Multi Timeframe Momentum Breakout StrategyPine Script · Breakout · 1d
- Bollinger Bands Dynamic Breakout StrategyPine Script · Breakout · 1h