Adaptive Volatility Breakout Strategy
The Adaptive Volatility Breakout Strategy is a trend-following strategy. It identifies breakout signals when prices rise strongly above a "certain level", establishes long positions, and continues to track the…
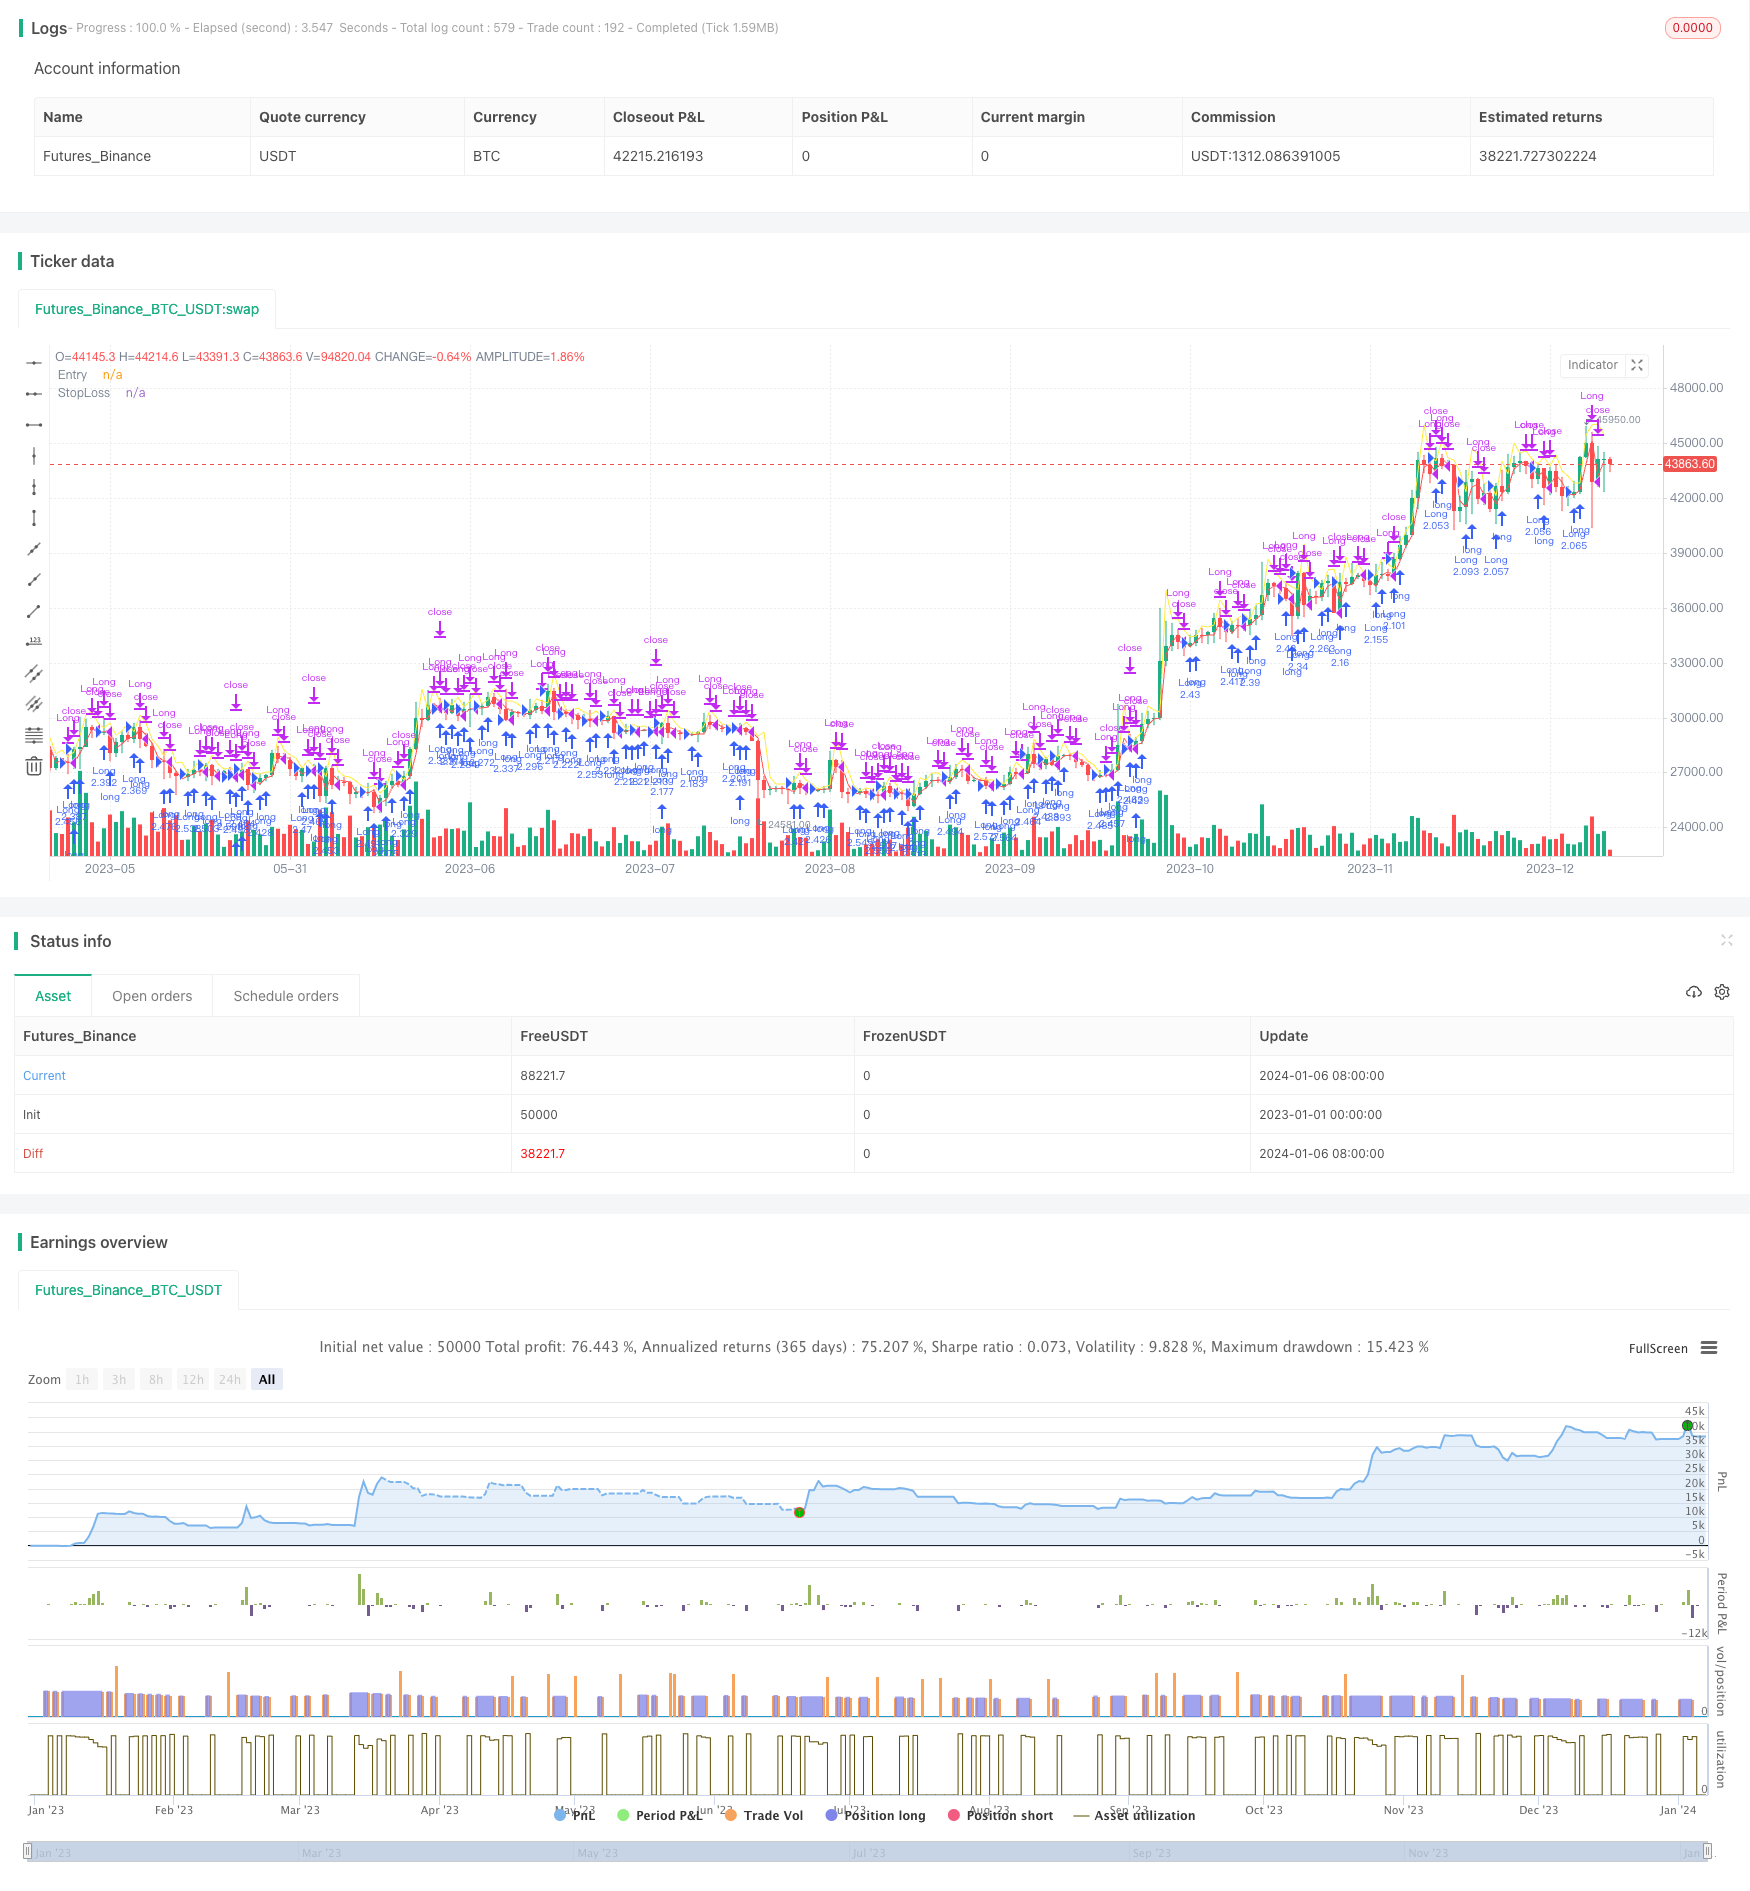
Overview
The Adaptive Volatility Breakout Strategy is a trend-following strategy. It identifies breakout signals when prices rise strongly above a "certain level", establishes long positions, and continues to track the uptrend to profit at the next day's open.
The strategy was proposed by Larry R. Williams, a famous futures and stock trader. It tries to capture price breakout points, which often signify turns in the market. By timely identifying these signals and establishing positions, profits can be obtained by following new trend directions.
Principle
The core metric of this strategy is the "certain level", calculated by:
Certain level = Close + k * (High - Low)
Where k is an empirical coefficient, valued at 0.6. This formula incorporates the volatility of highest and lowest prices, making the breakout points more flexible to adapt to market fluctuations.
When the day's highest price breaks through the calculated "certain level", it indicates a price breakout. The strategy will then establish a long position. The position will be entirely closed at the next day's open for profit.
The stop loss is set to half of the previous day's lowest price and entry price, preventing the loss from expanding.
Advantage Analysis
The advantages of this strategy include:
Capturing volatility, trend-following: The strategy incorporates highest and lowest prices to calculate flexible breakout points that capture price fluctuation rhythms.
Timely entry, trend tracking: Daily calculation of breakout signals allows timely identification of new trends to follow up price uptrend steps.
Proper risk control: Reasonable stop loss setting effectively controls single loss.
Risk Analysis
Risks of this strategy include:
Failed breakout risk: Price breakouts do not necessarily sustain an uptrend and may be short-term false breakouts, causing losses.
Extreme market risk: In extreme market events like market crashes, prices may gap up/down causing stop loss triggers and huge losses.
Excessive trading risk: Daily opening and closing of positions increases trading frequency and commission fees.
Optimization
The strategy can be optimized from the following aspects:
Adding a multiplier: Adding a multiplier to the breakout formula, properly reducing it when market volatility rises and increasing it when the market stabilizes, making the strategy more elastic.
Extending holding period: Extending the holding period to 2 or 3 days to filter out short-term false breakouts.
Optimizing stop loss: Setting stop loss to deeper support levels like Bollinger lower band or previous day's close.
Conclusion
The Adaptive Volatility Breakout Strategy tracks trends by dynamically tracking price volatility and rhythms. Compared to traditional breakout strategies, it is more flexible and capable in capturing price movements. But risks should be noted that stops can be hit in extreme markets. Further optimizations on holding period and stop loss can lead to better results.
Parameters
| Name | Default | What it controls |
|---|---|---|
| v_input_float_1 | 0.6 | k |
Source Pine Script
/*backtest
start: 2023-01-01 00:00:00
end: 2024-01-07 00:00:00
period: 1d
basePeriod: 1h
exchanges: [{"eid":"Futures_Binance","currency":"BTC_USDT"}]
*/

// This source code is subject to the terms of the Mozilla Public License 2.0 at https://mozilla.org/MPL/2.0/
// © Dicargo_Beam

//@version=5
strategy("Volatility Breakout Strategy", overlay=true, default_qty_type= strategy.percent_of_equity, default_qty_value=100,process_orders_on_close=false)

k = input.float(0.6)


[o,h,l,c] = request.security(syminfo.tickerid,"D",[open,high,low,close])

lp = math.log(c[1])+(math.log(h[1])-math.log(l[1]))*k
_lp = math.pow(2.718,lp)

longcond = _lp < high
exit = hour==0 or  math.log(close) < (math.log(l[1])+lp)/2


plot(_lp,"Entry",color=color.yellow)
//plot(l,"Yesterday's Low")
plot((_lp+l[1])/2,"StopLoss",color=color.red)


strategy.entry("Long", strategy.long,comment = "Long", when = longcond and strategy.opentrades == 0)

strategy.close("Long", comment="Exit", when = exit)


var bg = 0
bg := if hour == 0
    bg + 1
else
    bg[1]

bgcolor(bg/2== math.floor(bg/2) ? color.new(color.blue,95):na)
Published by ChaoZhang on the FMZ strategy square · last modified 2024-01-08. Collected in the Quant Trading Vault. Unvalidated research: re-test with your own data and costs before trusting it.
Build this with AgenKit
A spec is not a trading system. Paste this into your coding agent and AgenKit runs a specialist team — architecture, test-first build, risk gates, review — with paper trading on by default.
/agenkit build a production-grade trading bot with a backtest engine, risk controls and paper trading by default from strategies/Adaptive-Volatility-Breakout-Strategy.md- npx agenkit install engineering-kit in your project
- Paste the command into your agent and approve each phase
- Get tests, backtest, risk controls and a paper-trading switch
Understand it first
Before you run this, read the lesson behind the idea and how to backtest it honestly. Specs like this one are the survivors of an unknown number of trials; deflate their results accordingly.
Related specs
- Adaptive Bollinger Breakout with Moving Average Quantitative Strategy SystemPine Script · Breakout · 1h
- BB Breakout StrategyPine Script · Breakout · 1d
- Bollinger Band Breakout Trend Following StrategyPine Script · Breakout · 1d
- Bollinger Band Channel Breakout Trading StrategyPine Script · Breakout · 1d
- Bollinger Band T3 Moving Average StrategyPine Script · Breakout · 10m
- Bollinger Bands Breakout Trading StrategyPine Script · Breakout · 1h