Bollinger Band T3 Moving Average Strategy
This strategy makes full use of the trend judgment of moving averages and overbought/oversold judgment of Bollinger Bands. With the smoothing of T3 moving average, it can identify the trend reversal timely and enter…
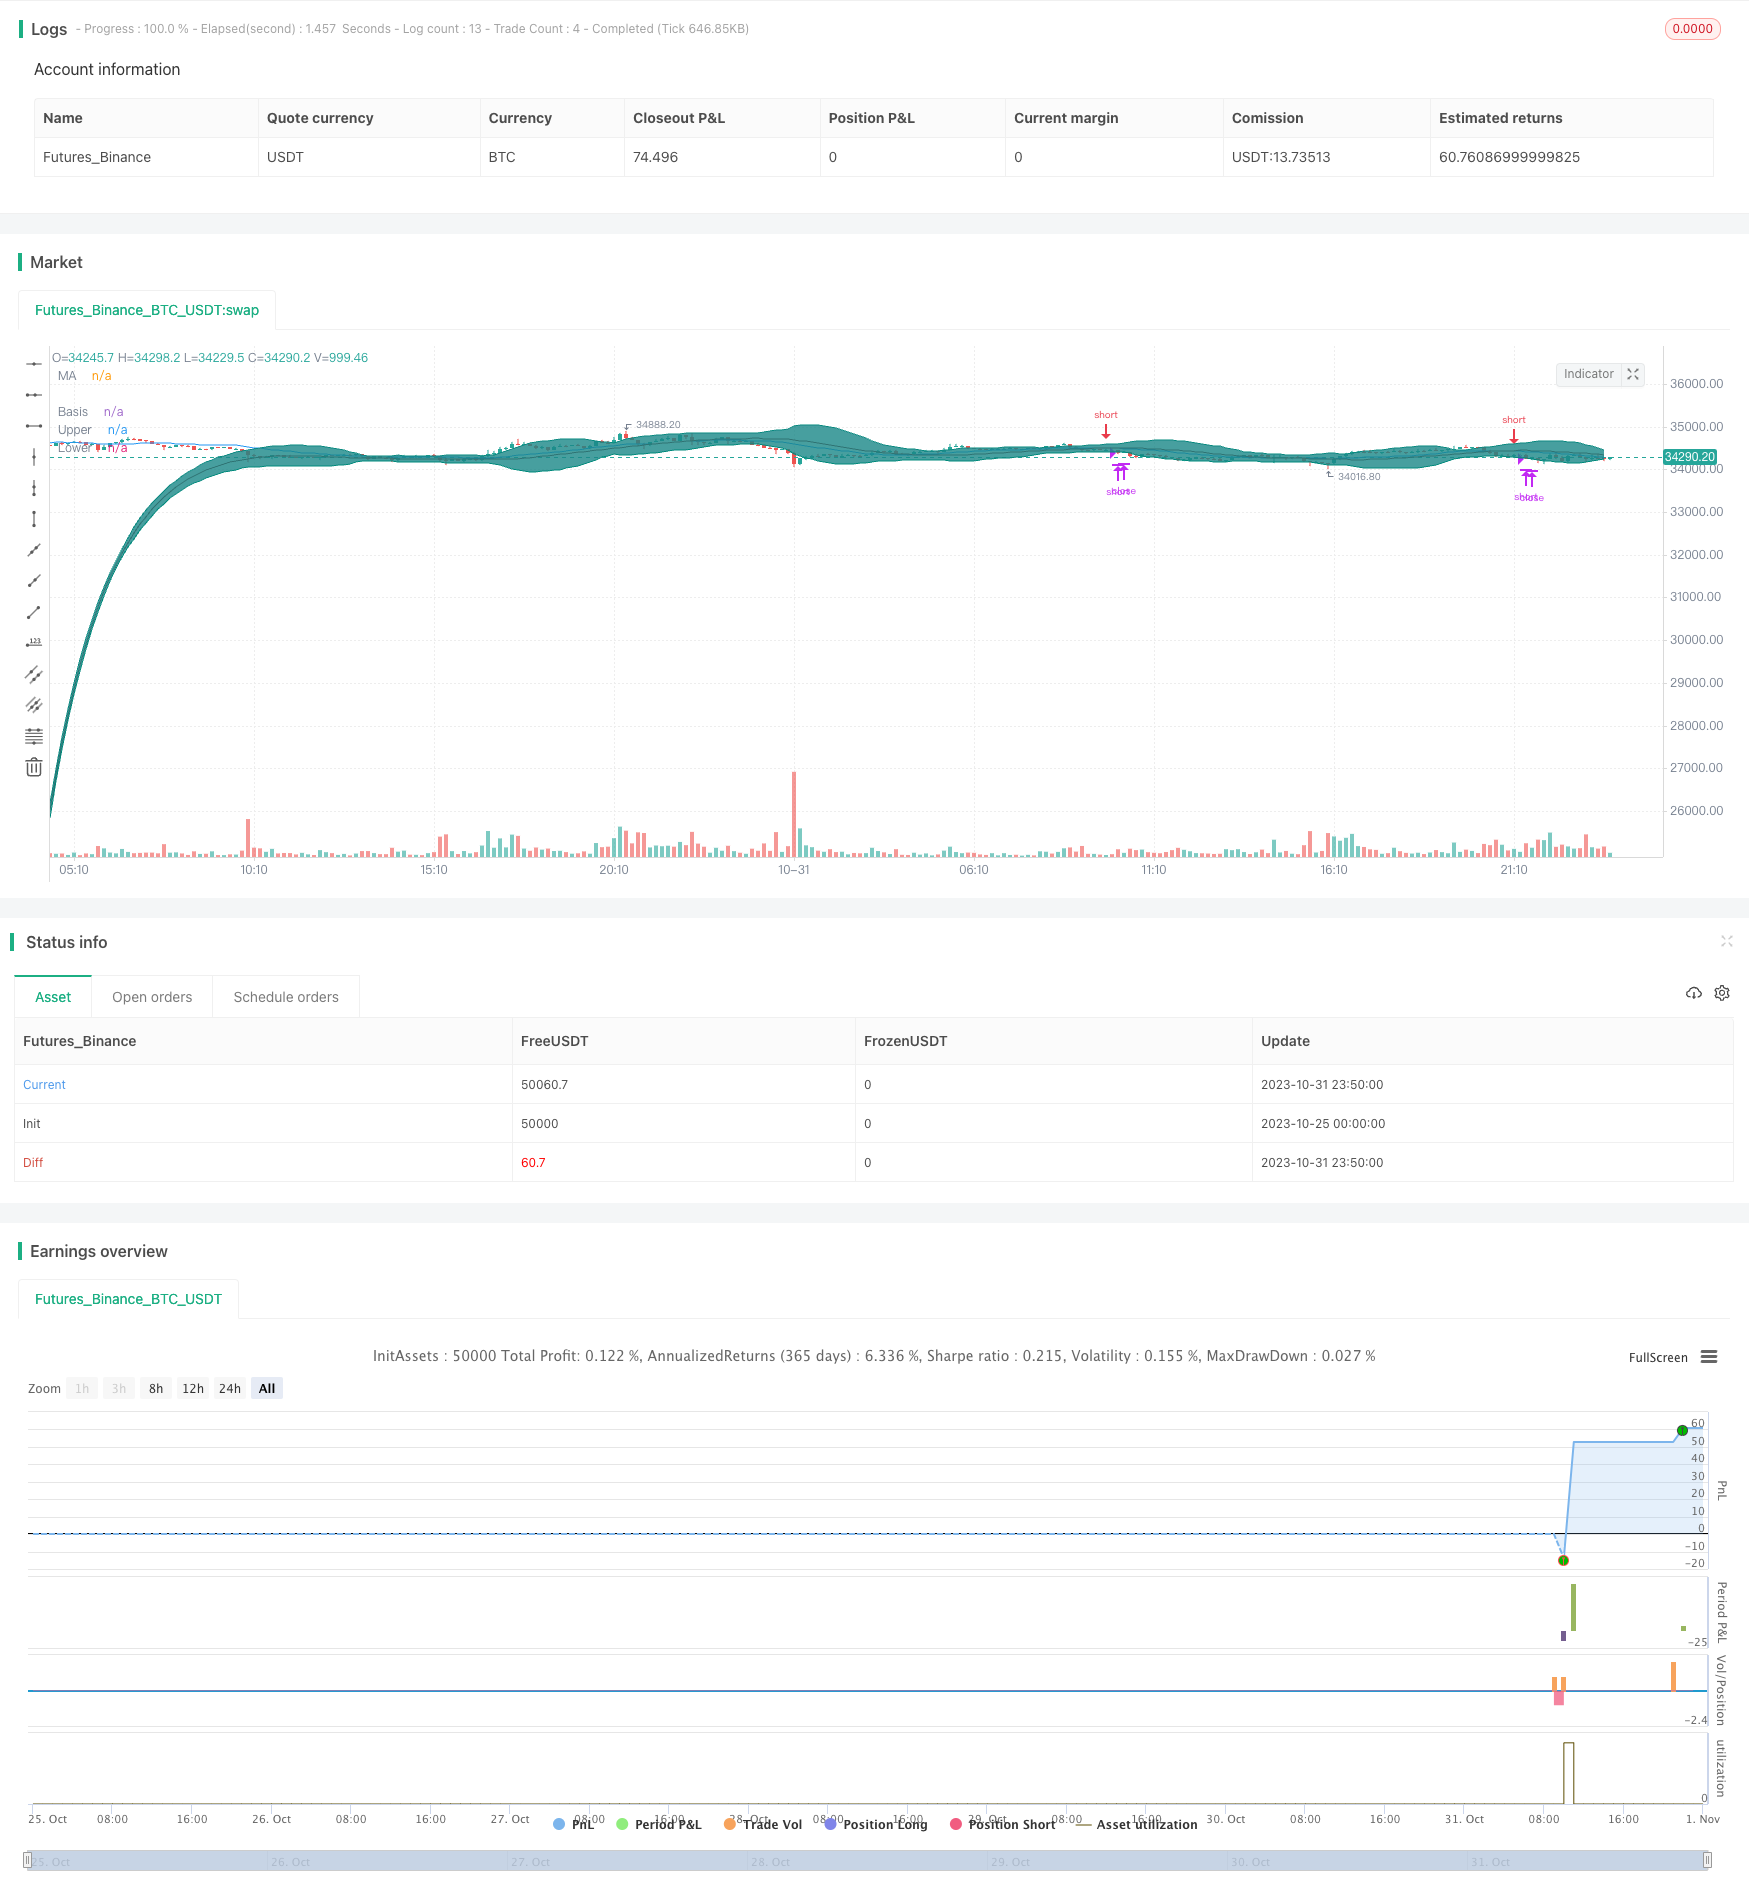
Overview
This strategy makes full use of the trend judgment of moving averages and overbought/oversold judgment of Bollinger Bands. With the smoothing of T3 moving average, it can identify the trend reversal timely and enter the market. In the oscillation zone, it uses the Bollinger Bands to identify overbought/oversold areas for counter trend trading. So it realizes ultra short-term trading.
Strategy Logic
The strategy mainly uses three groups of moving averages to identify the trend and generate trading signals. First is the T3 moving average, which can filter price fluctuations through exponential smoothing and judge the trend direction. Second is the middle-term moving average, here uses 20-period SMA to determine the middle-term trend. Last is the fast and slow moving averages, 50-period and 200-period T3 moving averages respectively. When fast line is greater than slow line, it indicates an upward trend, otherwise downward trend.
The trading signals are generated when the middle-term SMA crosses over the middle-term T3 upward combining with an upward trend, go long. When the middle-term SMA crosses below the middle-term T3 downward combining with a downward trend, go short. In addition, the Bollinger Bands can be used for profit taking and stop loss. If price breaks through the upper band, consider taking profit. If price breaks through the lower band, consider stop loss.
Specifically, the long condition is middle SMA crosses over middle T3 upward, and fast MA is greater than slow MA. If price breaks through the upper Bollinger band or middle SMA crosses below T3, consider taking profit. The short condition is middle SMA crosses below middle T3 downward, and fast MA is less than slow MA. If price breaks through the lower Bollinger band or middle SMA crosses above T3, consider stop loss.
Advantages
- Fully utilize the advantages of multiple moving averages, T3 for smoothing, middle SMA for trend, fast and slow MAs for long-term trend
- Bollinger Bands upper and lower bands judge overbought/oversold levels, reduce loss risk
- Strict trading signals combination, avoid misleading by fluctuations
Risks
- Improper T3 parameters may fail to smooth or cause lagging
- Improper Bollinger Bands parameters may cause invalid bands
- Wrong moving average periods lead to wrong trend direction
- Inaccurate breakout points for profit taking and stop loss, may exit too early or too late
Improvements:
- Adjust T3 parameters for balancing smoothing and lagging
- Adjust Bollinger Bands parameters to cover normal fluctuation range
- Test different moving average periods to find suitable ones for the asset
- Optimize take profit and stop loss points based on backtest results
Optimization Directions
- Add trend strength indicator like ADX to avoid reverse at trend turning points
- Add volatility indicator to adjust parameters based on market volatility
- Add trailing stop loss to allow more profits to run out
- Consider breakout strategy, trailing stop loss after breaking bands
Summary
In summary, this strategy uses moving averages systematically to determine the trend, and identifies overbought/oversold levels with Bollinger Bands. It can enter the market timely at trend reversals, and also effectively controls risks. But parameters tuning and optimization are important for the strategy to truly perform well. Further combining with trend strength, volatility, and trailing stop loss can make the strategy more robust and intelligent.
Parameters
| Name | Default | What it controls |
|---|---|---|
| v_input_1 | 20 | length |
| v_input_2 | 2.5 | StdDev |
| v_input_3 | false | Offset |
| v_input_4 | true | Stop Loss |
Source Pine Script
/*backtest
start: 2023-10-25 00:00:00
end: 2023-11-01 00:00:00
period: 10m
basePeriod: 1m
exchanges: [{"eid":"Futures_Binance","currency":"BTC_USDT"}]
*/

//@version=4
strategy(shorttitle="BB T3 Strategy", title="BB T3 Strategy", overlay=true)

//T3
b = 0.7
c1 = -b*b*b
c2 = 3*b*b+3*b*b*b
c3 = -6*b*b-3*b-3*b*b*b
c4 = 1+3*b+b*b*b+3*b*b

t3(len) => c1 * ema(ema(ema(ema(ema(ema(close, len), len), len), len), len), len) + c2 * ema(ema(ema(ema(ema(close, len), len), len), len), len) + c3 * ema(ema(ema(ema(close, len), len), len), len) + c4 * ema(ema(ema(close, len), len), len)
//T3 end

length = input(20, minval=1)

mult = input(2.5, minval=0.001, maxval=50, title="StdDev")
basis = t3(length)
basisDev = t3(length/10)

dev = mult * stdev(basisDev,length)
upper = basis + dev
lower = basis - dev
offset = input(0, "Offset", type = input.integer, minval = -500, maxval = 500)
plot(basis, "Basis", color=#872323, offset = offset)
p1 = plot(upper, "Upper", color=color.teal, offset = offset)
p2 = plot(lower, "Lower", color=color.teal, offset = offset)
fill(p1, p2, title = "Background", color=#198787, transp=95)

stoploss = input(true, "Stop Loss")

basisSma = sma(close, length)
p3 = plot(basisSma, color=color.blue, title="MA", offset=offset)

fastT3 = t3(50)
slowT3 = t3(200)

crossUp = crossover(basisSma, basis)
crossDown = crossunder(basisSma, basis)
bollBounce = crossover(close, upper)
bollReject = crossunder(close, lower)
underBasis = crossunder(close, basis)
overBasis = crossover(close, basis)

trendUp = fastT3 > slowT3
trendDown = fastT3 < slowT3

strategy.entry("long", strategy.long, when=(trendUp and crossUp), stop=(stoploss ? high+syminfo.mintick : na))
strategy.close("long", when=(bollBounce or crossDown or underBasis))
strategy.entry("short", strategy.short, when=(trendDown and crossDown), stop=(stoploss ? low-syminfo.mintick : na))
strategy.close("short", when=(bollReject or crossUp or overBasis))
Published by ChaoZhang on the FMZ strategy square · last modified 2023-11-02. Collected in the Quant Trading Vault. Unvalidated research: re-test with your own data and costs before trusting it.
Build this with AgenKit
A spec is not a trading system. Paste this into your coding agent and AgenKit runs a specialist team — architecture, test-first build, risk gates, review — with paper trading on by default.
/agenkit build a production-grade trading bot with a backtest engine, risk controls and paper trading by default from strategies/Bollinger-Band-T3-Moving-Average-Strategy.md- npx agenkit install engineering-kit in your project
- Paste the command into your agent and approve each phase
- Get tests, backtest, risk controls and a paper-trading switch
Understand it first
Before you run this, read the lesson behind the idea and how to backtest it honestly. Specs like this one are the survivors of an unknown number of trials; deflate their results accordingly.
Related specs
- BB Breakout StrategyPine Script · Breakout · 1d
- Bollinger Bands Dual track Breakthrough StrategyPine Script · Breakout · 30m
- Bollinger Breakout StrategyPine Script · Breakout · 30m
- Dynamic Bollinger Bands Breakout Quantitative Trading StrategyPine Script · Breakout · 2d
- EMA and Bollinger Bands Breakout StrategyPine Script · Breakout · 1h
- Momentum Breakout Moving Average StrategyPine Script · Breakout · 1d