Advanced Bollinger Band Moving Average Grid Trend Tracking Strategy
The strategy is named "Advanced Bollinger Band Moving Average Grid Trend Tracking Strategy". It is a strategy that uses Bollinger Bands and moving averages for trend determination and establishes grid positions to…
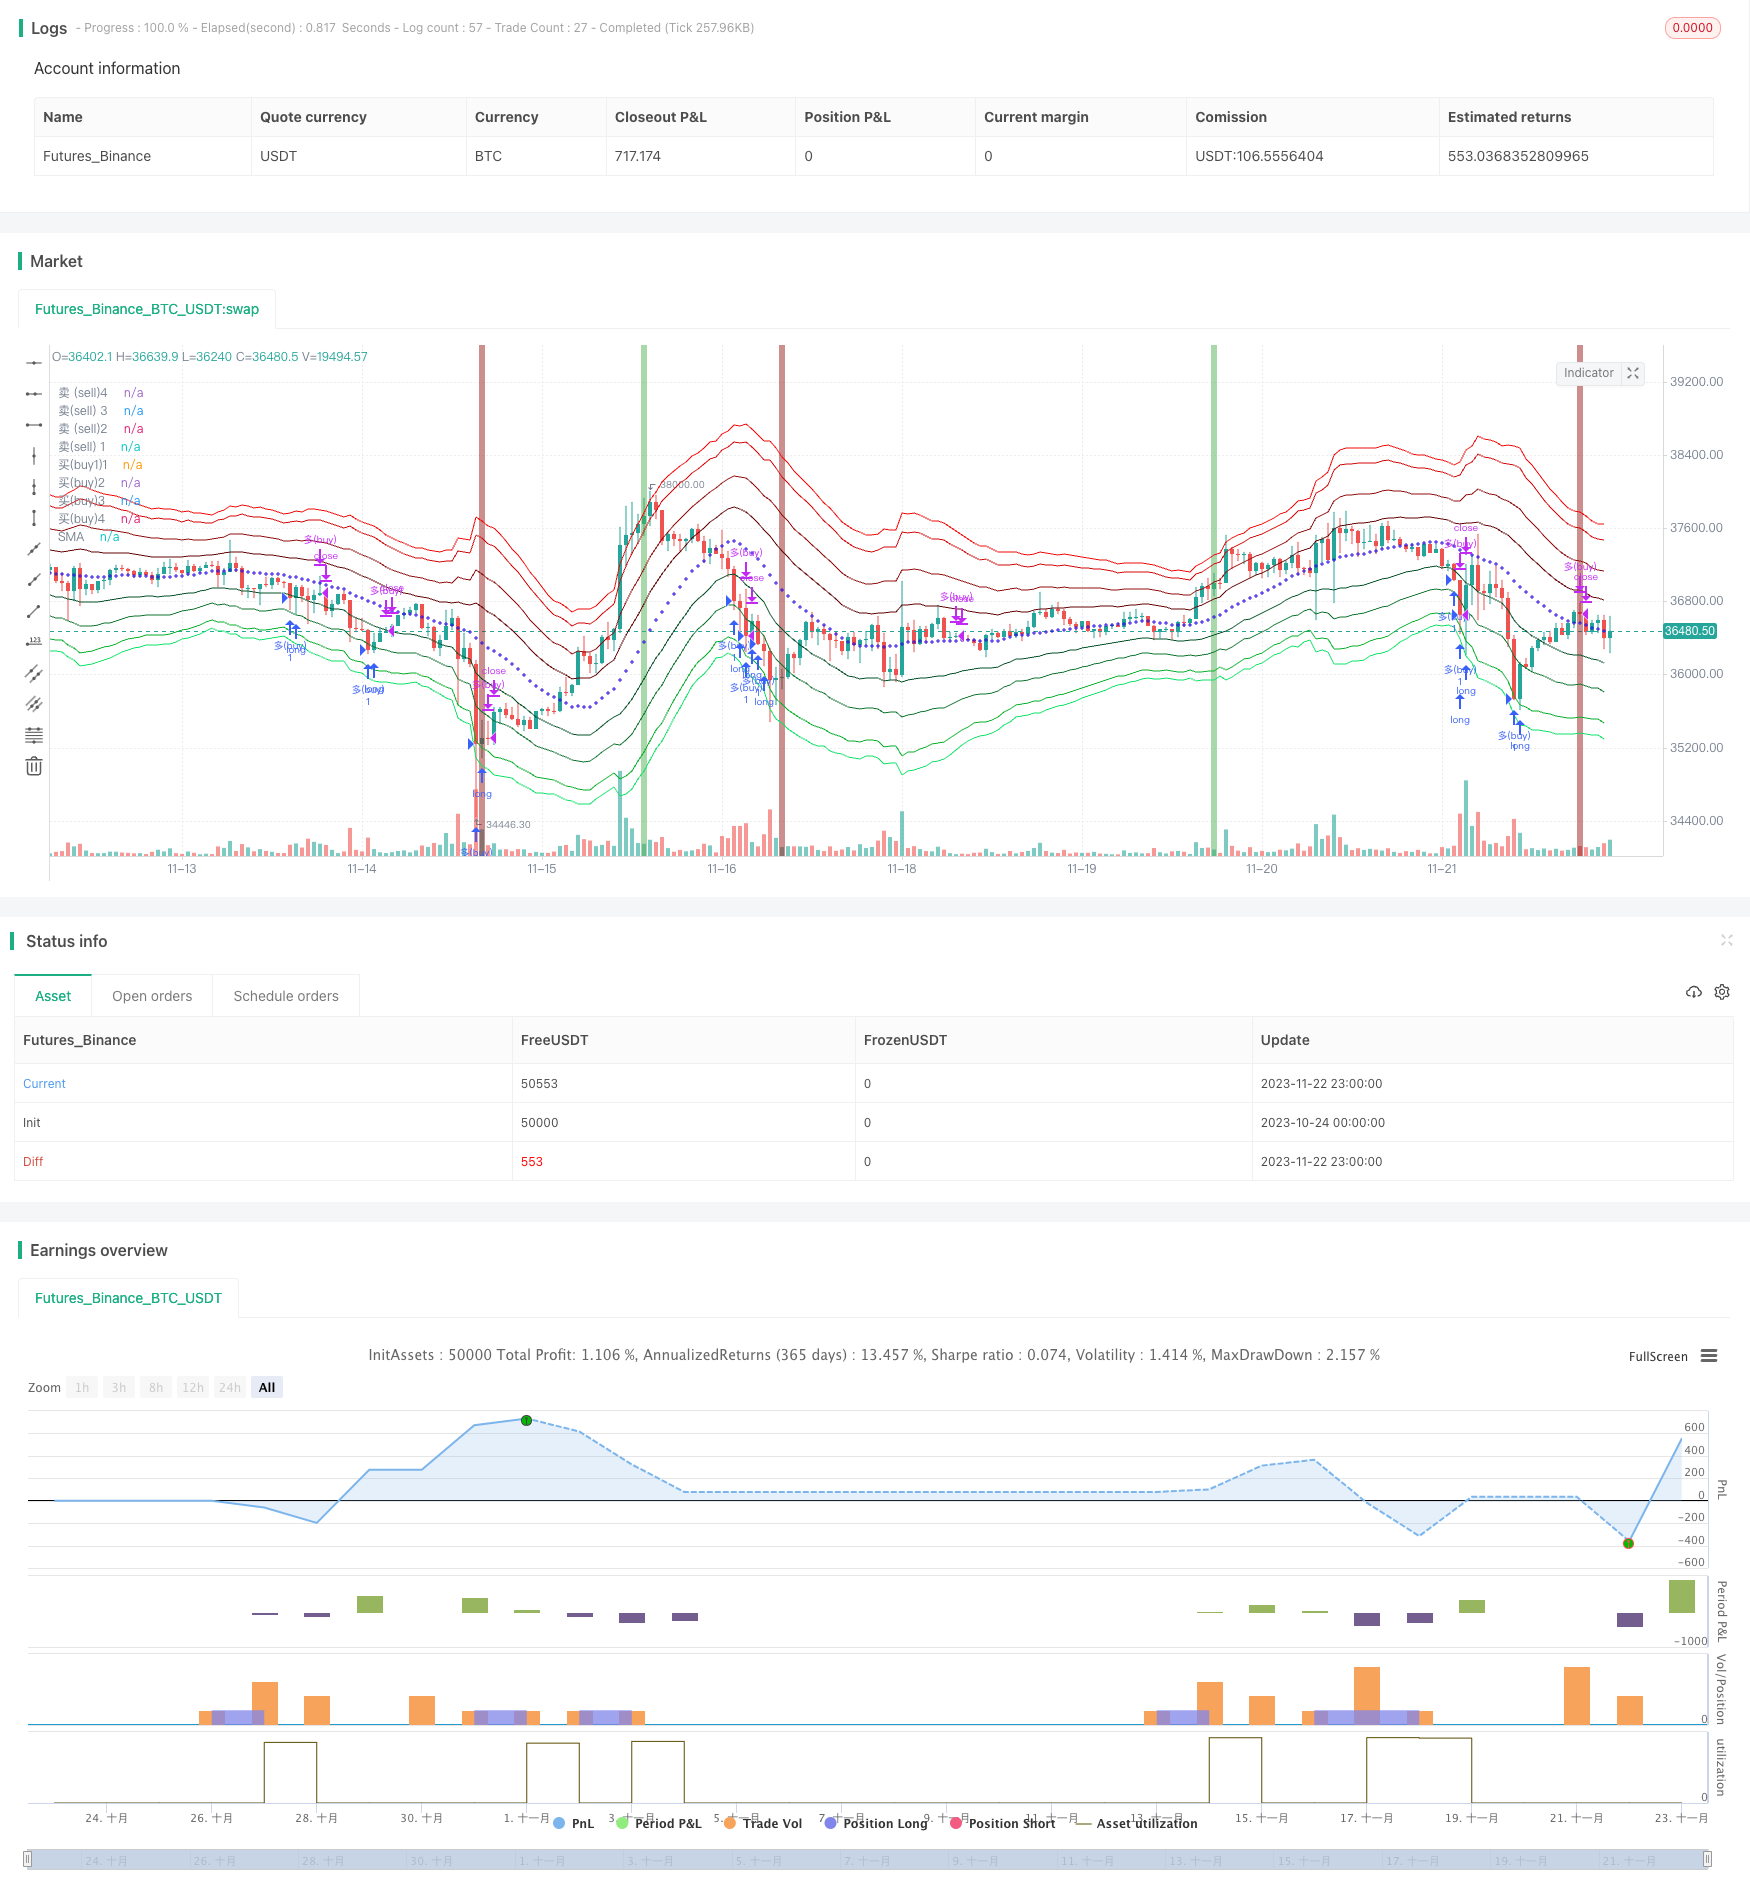
Overview
The strategy is named "Advanced Bollinger Band Moving Average Grid Trend Tracking Strategy". It is a strategy that uses Bollinger Bands and moving averages for trend determination and establishes grid positions to track the trend direction.
Principle
The main idea of this strategy is:
Use Bollinger Bands to judge the current market volatility range. The middle rail of Bollinger Bands is the n-day simple moving average, and the width is the n-day ATR average amplitude.
The four lines outside the Bollinger Bands are abnormal multiples of the average true volatility amplitude lines. The strategy establishes positions when breaking through different levels of lines.
The EMA fast and slow moving averages determine the big cycle trend direction. Go long only in the big cycle uptrend and go short on the contrary.
Track and build positions in the trend direction, close positions for profit when seeing pin bars.
Specifically, the main parts of this strategy are:
Determine Bollinger Band parameters. The middle rail of Bollinger Bands is the n-day SMA moving average, and the width of Bollinger Bands is the n-day ATR. The Bollinger length n in the strategy is 20.
Set four expanded lines outside Bollinger Bands. The distance between the lines and the middle rail is 1.236 times, 2.382 times, 3.618 times and 4.236 times the average true volatility amplitude.
Set fast and slow EMA moving averages to determine the big cycle trend. The fast line length is 25 days and the slow line is 200 days.
Establish long positions gradually when breaking through the four lines below in a big cycle uptrend. The short side is the same.
When a pin bar appears or the price crosses the big cycle moving average again, it is regarded as an pin bar ending signal to close positions for profit.
The above is the main technical principle of this strategy. By judging the current volatility range through Bollinger Bands and establishing positions under the big cycle trend, the final effect of high probability positions can be achieved.
Advantage Analysis
The main advantages of this strategy are:
Make full use of trend characteristics, determine trend direction in big cycles, build positions in trend direction to reduce unnecessary reverse operations.
The use of multiple Bollinger lines can more clearly judge the current volatility range, which is conducive to capturing most trends.
The grid position method can evenly distribute risks to each unit of funds to obtain stable returns.
The use of pin bar high efficiency signals for position closing can quickly lock in profits.
The overall strategy integrates trend determination, grid positions, and specific signal position closing. It is a relatively mature and complete quantitative strategy.
Risk Analysis
There are also some risks in this strategy:
Probability of incorrectly determining the big cycle trend. There is some probability of error in fast and slow moving averages, which may lead to unnecessary reverse operations.
Probability of Bollinger line breakout failures. Bollinger lines cannot predict price paths 100% accurately.
Pin bar signals may come out late and cannot lock in profits in time.
It is easy to form too many overlapping positions during big cycle shock adjustments.
The corresponding solutions are:
Adjust fast and slow moving average parameters to reduce probability of errors.
Adjust Bollinger line parameters to make Bollinger lines stick to most fluctuations as much as possible.
Test more sensitive specific patterns for profit taking signals.
Increase interval distance to control position size.
Optimization Directions
The strategy can be optimized in the following directions:
Test different moving average parameters to optimize big cycle trend determinations. For example, test other indicators like EMA, RSI, etc.
Test different multiples ATR parameters to optimize Bollinger channel width settings. Make Bollinger Bands stick closer to actual fluctuations.
Test other efficient profit taking signals. For example, SAR, Kalman Lines, etc.
Optimize grid interval to make volatility intervals divided more evenly to reduce overlapping positions.
Increase stop loss mechanisms. Avoid huge losses in extreme market conditions.
Summary
The strategy integrates the use of Bollinger channel, moving average indicators, specific K-line patterns and other technical means. Under the premise of determining the big cycle trend, it constructs a trend tracking grid strategy based on moving averages and Bollinger Bands. Compared with traditional Bollinger band breakouts, this strategy adds trend characteristic judgment, which can reduce unnecessary reverse positions. At the same time, the grid position method diversifies risks for each unit of funds to obtain stable returns. The strategy can be optimized from multiple angles such as trend determination, Bollinger width, profit taking signals, stop loss methods, etc. to obtain more stable strategy effects.
Parameters
| Name | Default | What it controls |
|---|---|---|
| v_input_7 | 25 | Fast Line Length(fastlength) |
| v_input_8 | 200 | Slow Line Length(slowlength) |
| v_input_bool_1 | true | (?Backtest range (backtest): enable time range limitation for backtesting(backtest) |
| v_input_1 | timestamp(1 Jan 2015) | Start time(Start) |
| v_input_2 | timestamp(1 Jan 2040) | End time(finish) |
| v_input_int_1 | 20 | (?Entry position (entry) Bollinger length,(boll length) |
| v_input_3 | 1.236 | Fib 1 |
| v_input_4 | 2.382 | Fib 2 |
| v_input_5 | 3.618 | fib 3 |
| v_input_6 | 4.236 | Fib 4 |
Source Pine Script
/*backtest
start: 2023-10-24 00:00:00
end: 2023-11-23 00:00:00
period: 1h
basePeriod: 15m
exchanges: [{"eid":"Futures_Binance","currency":"BTC_USDT"}]
*/

// This source code is subject to the terms of the Mozilla Public License 2.0 at https://mozilla.org/MPL/2.0/
// © Aayonga

//@version=5
strategy("fib trend grid@Aa", overlay=true)

//Backtesting period
useDateFilter=input.bool(true,title = "Enable backtest time range limitation(backtest)", group = "Backtest range(backtest)")
backtesStarDate=input(timestamp("1 Jan 2015"),title = "Start time (Start)", group = "Backtest range(backtest)")
backtestEndDate=input(timestamp("1 Jan 2040"),title = "End time (finish)",group = "Backtest range(backtest)")
inTradeWindow=true


//Admission entry
bolllen=input.int(defval=20,minval=1,title="Bollinger length,(boll length)",group = "Admission(entry)")
sma=ta.sma(close,bolllen)
avg=ta.atr(bolllen)
fib1=input(defval=1.236,title="Fib 1",group = "Admission(entry)")
fib2=input(defval=2.382,title="Fib 2",group = "Admission(entry)")
fib3=input(defval=3.618,title="fib 3",group = "Admission(entry)")
fib4=input(defval=4.236,title="Fib 4",group = "Admission(entry)")
r1=avg*fib1
r2=avg*fib2
r3=avg*fib3
r4=avg*fib4
top4=sma+r4
top3=sma+r3
top2=sma+r2
top1=sma+r1
bott1=sma-r1
bott2=sma-r2
bott3=sma-r3
bott4=sma-r4


//trend plot

t4=plot(top4,title="Sell (sell)4",color=color.rgb(244, 9, 9))
t3=plot(top3,title = "Sell(sell) 3",color=color.rgb(211, 8, 8))
t2=plot(top2,title="Sell (sell)2",color=color.rgb(146, 13, 13))
t1=plot(top1,title="Sell(sell) 1",color=color.rgb(100, 3, 3))

b1=plot(bott1,title="Buy(buy1)1",color=color.rgb(4, 81, 40))
b2=plot(bott2,title="Buy(buy)2",color=color.rgb(15, 117, 46))
b3=plot(bott3,title = "Buy(buy)3",color =color.rgb(8, 176, 42) )
b4=plot(bott4,title="Buy(buy)4",color=color.rgb(15, 226, 103))
plot(sma,style=plot.style_cross,title="SMA",color=color.rgb(47, 16, 225))

//trend
LengthF=input(defval = 25,title = "Fast Line Length(fastlength)")
LengthS=input(defval=200,title = "Slow Line Length(slowlength)")
emaF=ta.ema(close,LengthF)
smaS=ta.sma(close,LengthS)
longTrend=emaF>smaS
longb=ta.crossover(emaF,smaS)
bgcolor(longb ? color.new(color.green,40):na,title = "Bulls are strong(bull trend)")
shortTrend=smaS>emaF
shortb=ta.crossunder(emaF,smaS)
bgcolor(shortb ? color.new(#951313, 40):na,title = "Short positions are strong(bear trend)")

//pinbar
bullPinBar = ((close > open) and ((open - low) > 0.6* (high - low))) or ((close < open) and ((close - low) > 0.9 * (high - low)))
//plotshape(bullPinBar  , text ="pinbar", textcolor=color.rgb(9, 168, 144),location=location.belowbar, color=color.rgb(29, 103, 67), size=size.tiny)
bearPinBar = ((close > open) and ((high - close) > 0.7 * (high - low))) or ((close < open) and ((high - open) > 0.7 * (high - low)))
//plotshape(bearPinBar  , text ="pinbar", textcolor=color.rgb(219, 12, 12),location=location.abovebar, color=color.rgb(146, 7, 7), size=size.tiny)

buy1=ta.crossunder(close,bott1) and longTrend and close>ta.ema(close,100)
buy2=ta.crossunder(close,bott2) and longTrend
buy3=ta.crossunder(close,bott3) and longTrend
buy4=ta.crossunder(close,bott4) and longTrend
buyclose=bearPinBar or ta.crossunder(close,smaS)


if buy2 or buy3 or buy4 or buy1 and inTradeWindow
    strategy.order("Many(buy)",strategy.long)

if buyclose  and inTradeWindow
    strategy.close("Many(buy)")

sell1=ta.crossover(close,top1) and shortTrend and close<ta.ema(close,200)
sell2=ta.crossover(close,top2) and shortTrend and close<ta.ema(close,200)
sell3=ta.crossover(close,top3) and shortTrend and close<ta.ema(close,200)
sell4=ta.crossover(close,top4) and shortTrend and close<ta.ema(close,200)
sellclose=bullPinBar or ta.crossover(close,ta.sma(close,220))

if  sell1 or sell2 or sell3 or sell4 and inTradeWindow
    strategy.order("Empty(sell)",strategy.short)

if sellclose  and inTradeWindow
    strategy.close("Empty(sell)")
Published by ChaoZhang on the FMZ strategy square · last modified 2023-11-24. Collected in the Quant Trading Vault. Unvalidated research: re-test with your own data and costs before trusting it.
Build this with AgenKit
A spec is not a trading system. Paste this into your coding agent and AgenKit runs a specialist team — architecture, test-first build, risk gates, review — with paper trading on by default.
/agenkit build a grid bot with inventory caps and order deduplication from strategies/Advanced-Bollinger-Band-Moving-Average-Grid-Trend-Tracking-Strategy.md- npx agenkit install engineering-kit in your project
- Paste the command into your agent and approve each phase
- Get tests, backtest, risk controls and a paper-trading switch
Understand it first
Before you run this, read the lesson behind the idea and how to backtest it honestly. Specs like this one are the survivors of an unknown number of trials; deflate their results accordingly.
Related specs
- Bollinger Fibonacci Grid Tracking Trend StrategyPine Script · Grid · 1h
- Assassins Grid B A Dynamic Grid Trading StrategyPine Script · Grid · 1d
- Grid Strategy with Moving Average LinesPine Script · Grid · 1d
- Adaptive Bollinger Bands Grid Trading Strategy with Dynamic Level AdjustmentPine Script · Grid · 1d
- Moving Average Crossover and Upper Rail Breakthrough Impulse StrategyPine Script · Breakout · 1m
- Multi Zone MA100 Price Retracement Smart Grid Trading StrategyPine Script · Grid · 1d