Strategy vault / Trend following
Advanced Trend Tracking Strategy Based on Engulfing Pattern and Quantitative Indicators
This strategy integrates multiple quantitative techniques such as engulfing candlestick pattern recognition, oscillators, moving average, and demand-supply zones to precisely determine and trade the trend. It…
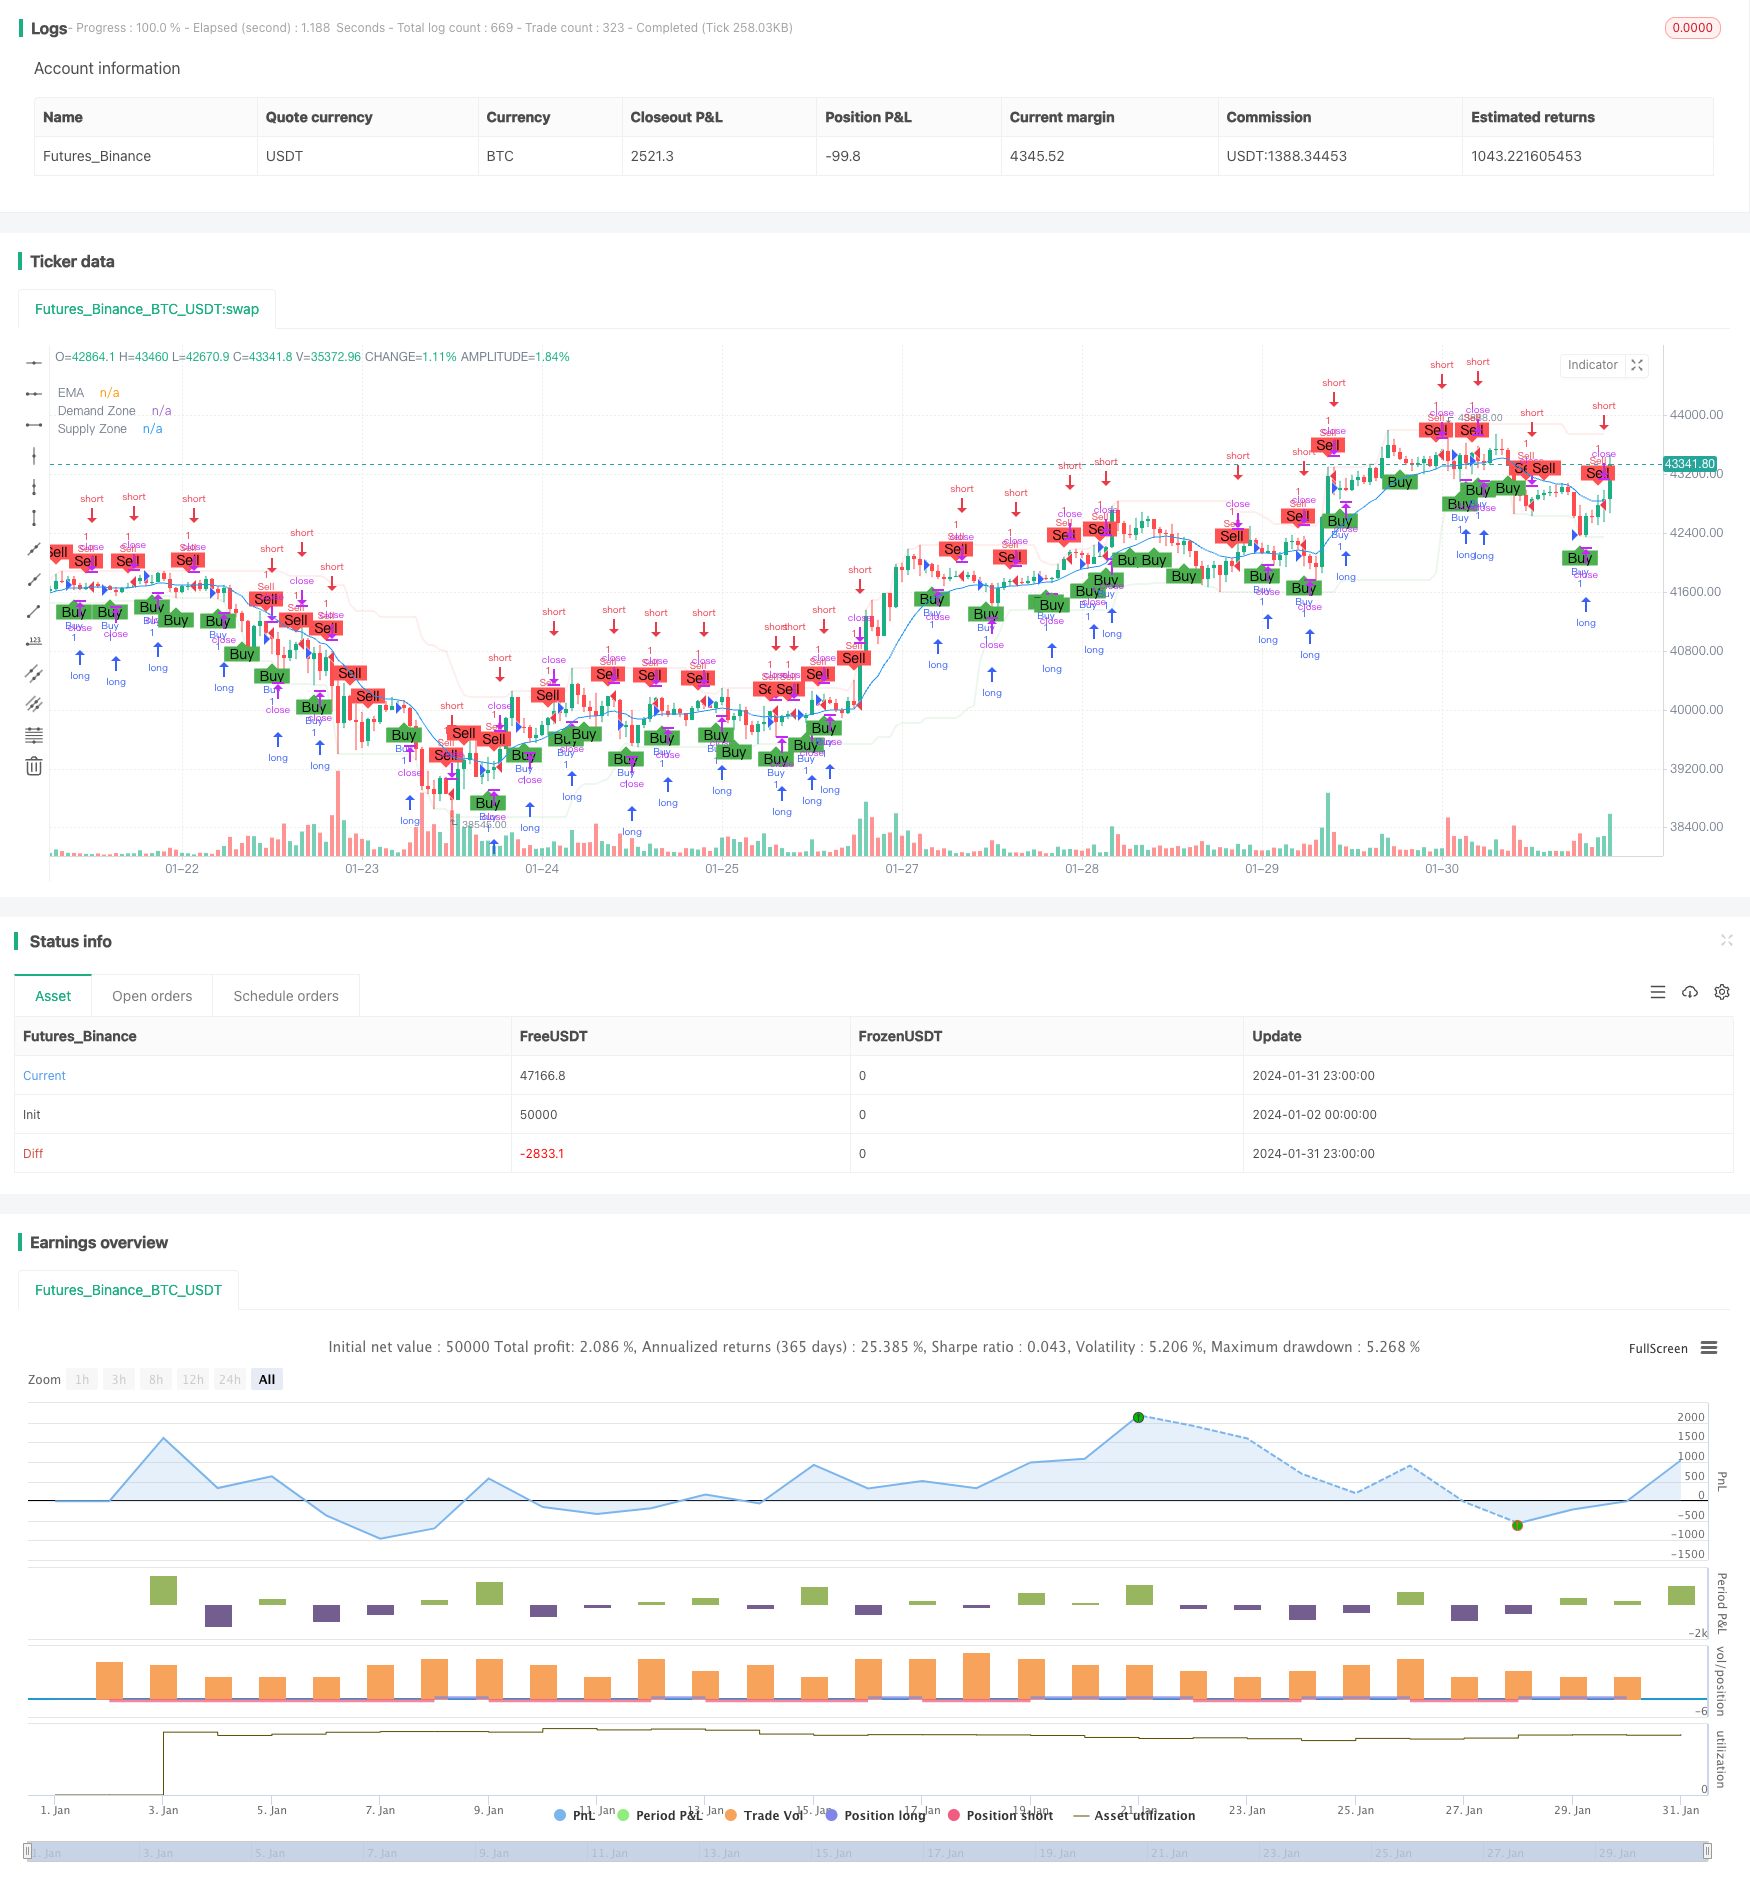
Overview
This strategy integrates multiple quantitative techniques such as engulfing candlestick pattern recognition, oscillators, moving average, and demand-supply zones to precisely determine and trade the trend. It extensively employs professional terminology and standard models of quantitative trading to improve decision accuracy through composite indicator judgment and effectively control risks.
Strategy Principle
The core logic of this strategy is based on identifying the engulfing candlestick patterns to catch turnarounds in the market. When a bullish engulfing pattern appears, close[1] > open[1] and open < close and close > open[1] and open[1] > close[1], a buy signal is triggered. When a bearish engulf pattern appears, close[1] < open[1] and open > close and close < open[1] and open[1] < close[1], a sell signal is triggered.
In addition, a 20-period demand zone and supply zone indicator is introduced. When the close breaks through the supply zone, it is determined as a bullish signal. When it breaks through the demand zone, it is determined as a bearish signal. The EMA moving average is used to determine the trend direction. Trading signals are generated only when the close breaks through the EMA. The fractal oscillator that finds pivot points assists in confirming the time of reversals.
In summary, this strategy determines potential reversals through engulfing patterns and uses filters like moving averages and supply-demand zones to confirm and trade only the highest probability points, thereby accurately tracking trends and avoiding losing all capital to whipsaws.
Advantage Analysis
This is a highly professional and advanced trend tracking strategy with the following main advantages:
- Multiple indicator combo improves judgment accuracy and effectively filters false signals
- Engulfing patterns catch reversals
- Oscillators and trends determine high probability trade points
- Automatic pattern and indicator plotting, readable
- Concise logic, easily extensible and optimizable
Overall, this strategy has high accuracy and good risk control. It is suitable for mid-to-long term trend tracking and can deliver steady profits.
Risk Analysis
Despite its numerous strengths, some potential risks to note:
- Inaccurate engulfing pattern recognition might miss actual reversals or generate false signals
- Wrong signals probability exists in moving average systems, may buy the top and sell the bottom
- Improper demand zone and supply zone range setting increases unnecessary trades
- Limited optimization space, higher avalanche risks
Countermeasures:
- Introduce machine learning to improve reversal pattern recognition accuracy
- Add indicators judging violent trend to avoid unnecessary losses
- Dynamically optimize demand and supply zone parameters
- Reasonably assess and control risks, adjust position sizing
Optimization Directions
Further optimization directions:
- Add AI-based pattern recognition module using machine learning for engulfing and reversals
- Introduce more filters like BOLL and MACD for timing
- Add stop loss strategies like trailing stop loss and time-based stop loss
- Dynamically optimize indicator parameters for different products and markets
- Incorporate advanced strategies like trailing stops and martingale to manage equity curve
The above optimizations can improve accuracy, reduce risks, and smooth equity curve.
Summary
In summary, this is an extremely professional and efficient strategy that fully utilizes multiple quantitative indicators and models to judge market changes. It captures reversal signals through engulfing patterns and issues high probability trading signals collaborating with trend and oscillator indicators. This allows effective mid-to-long term trend tracking and steady profits. Meanwhile, certain risks need attention. Continual optimizations and strict risk management significantly lower risks, making the strategy more reliable. It has strong practicality and extensibility, suitable for traders with some quantitative basis.
Parameters
| Name | Default | What it controls |
|---|---|---|
| v_input_1 | 14 | EMA Length |
| v_input_2 | 20 | Demand & Supply Length |
Source Pine Script
/*backtest
start: 2024-01-02 00:00:00
end: 2024-02-01 00:00:00
period: 1h
basePeriod: 15m
exchanges: [{"eid":"Futures_Binance","currency":"BTC_USDT"}]
*/

//@version=5
strategy("Engulfing Candles with Fractals, Moving Average, Demand & Supply", overlay=true)

// Input parameters
emaLength = input(14, title="EMA Length")
demandSupplyLength = input(20, title="Demand & Supply Length")

// Calculate EMA
emaValue = ta.ema(close, emaLength)

// Calculate Demand and Supply Zones
demandZone = ta.lowest(low, demandSupplyLength)
supplyZone = ta.highest(high, demandSupplyLength)

// Plot Demand and Supply Zones
plot(demandZone, color=color.new(color.green, 90), linewidth=2, title="Demand Zone")
plot(supplyZone, color=color.new(color.red, 90), linewidth=2, title="Supply Zone")

// Determine Engulfing Candles
bullishEngulfing = close[1] > open[1] and open < close and close > open[1] and open[1] > close[1]
bearishEngulfing = close[1] < open[1] and open > close and close < open[1] and open[1] < close[1]

// Plot Engulfing Candle Bars
bgcolor(bullishEngulfing ? color.new(color.green, 90) : na)
bgcolor(bearishEngulfing ? color.new(color.red, 90) : na)

// Plot Moving Average
plot(emaValue, color=color.blue, title="EMA")

// Fractal Indicator
fractalUp = ta.pivothigh(high, 2, 2)
fractalDown = ta.pivotlow(low, 2, 2)

// Plot Buy and Sell Fractals
plotshape(series=fractalUp, title="Buy Fractal", location=location.belowbar, color=color.green, style=shape.labelup, text="Buy")
plotshape(series=fractalDown, title="Sell Fractal", location=location.abovebar, color=color.red, style=shape.labeldown, text="Sell")

// Strategy logic
buySignal = bullishEngulfing and close > emaValue and close > supplyZone
sellSignal = bearishEngulfing and close < emaValue and close < demandZone

// Execute strategy
if (fractalUp)
    strategy.entry("Buy", strategy.long)

if (fractalDown)
    strategy.entry("Sell", strategy.short)

// Plot strategy entry points on the chart
plotshape(series=buySignal ? 1 : na, title="Buy Signal", color=color.green, style=shape.triangleup, location=location.belowbar, size=size.small)
plotshape(series=sellSignal ? 1 : na, title="Sell Signal", color=color.red, style=shape.triangledown, location=location.abovebar, size=size.small)
Published by ChaoZhang on the FMZ strategy square · last modified 2024-02-02. Collected in the Quant Trading Vault. Unvalidated research: re-test with your own data and costs before trusting it.
Build this with AgenKit
A spec is not a trading system. Paste this into your coding agent and AgenKit runs a specialist team — architecture, test-first build, risk gates, review — with paper trading on by default.
/agenkit build a production-grade trading bot with a backtest engine, risk controls and paper trading by default from strategies/Advanced-Trend-Tracking-Strategy-Based-on-Engulfing-Pattern-and-Quantitative-Indicators.md- npx agenkit install engineering-kit in your project
- Paste the command into your agent and approve each phase
- Get tests, backtest, risk controls and a paper-trading switch
Understand it first
Before you run this, read the lesson behind the idea and how to backtest it honestly. Specs like this one are the survivors of an unknown number of trials; deflate their results accordingly.
Related specs
- Dual EMA Crossover StrategyPine Script · Trend following · 1d
- Dual Hull Moving Average Trading StrategyPine Script · Trend following · 1d
- Dual Moving Average Trend Following System with Adaptive Dynamic Filtering StrategyPine Script · Trend following · 30m
- EMA AROON ASHPine Script · Trend following · 3m
- EMA Crossover and MACD Signals Trend Following StrategyPine Script · Trend following · 1h
- EMA SMA Trend Following with Swing Trading Strategy Combined Volume Filter and Percentage Take Profit Stop Loss SystemPine Script · Trend following · 1d