Strategy vault / Mean reversion
Aroon Williams MA BB ADX Powerful Multi indicator Strategy
This strategy combines multiple strong indicators with different periods such as Aroon, MA, BB, Williams, %R, ADX to form a multi-dimensional powerful open position indicator system that can efficiently open…
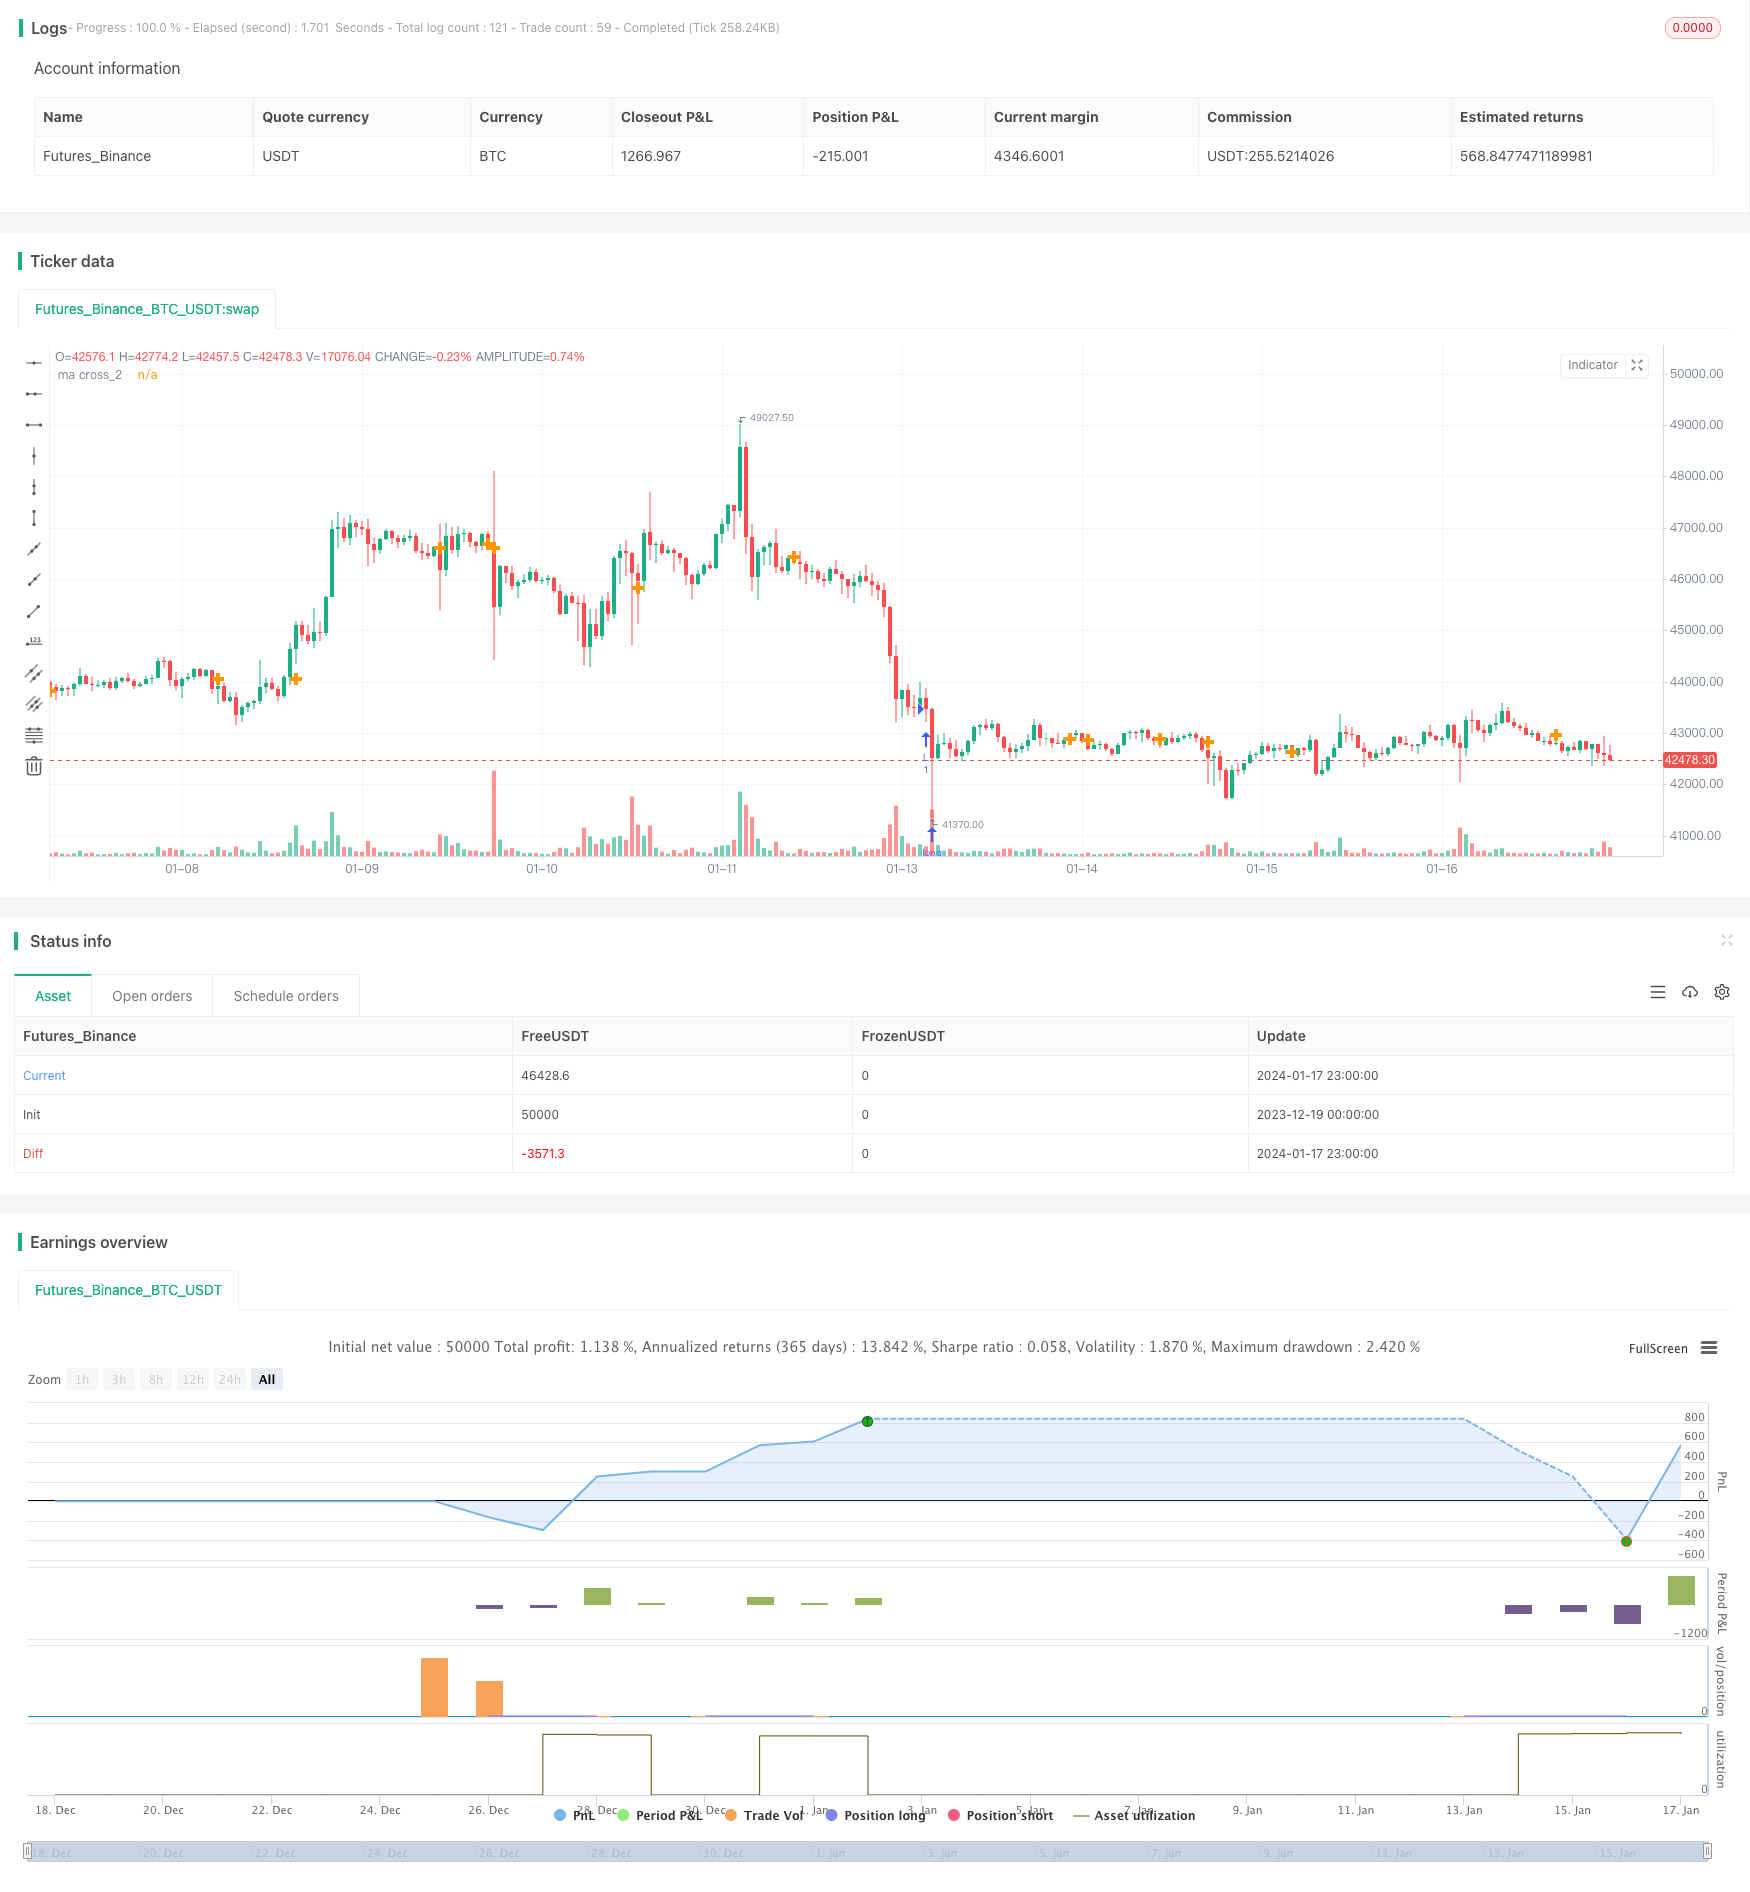
Overview
This strategy combines multiple strong indicators with different periods such as Aroon, MA, BB, Williams, %R, ADX to form a multi-dimensional powerful open position indicator system that can efficiently open positions when the trend is obvious.
Strategy Principle
The strategy mainly uses the combination of the following indicators to generate strong opening signals:
Aroon Indicator: Calculate the highest and lowest prices over a certain period to form an oscillating indicator. Judging the trend direction through the combination of Aroon indicators with multiple cycle lengths.
MA: Calculate the cross of short-period and long-period MA to determine turning points of the trend.
BB Band: When the price breaks through the upper rail of the BB band, it is a sell signal.
Williams %R Indicator: Forming divergence in overbought and oversold areas as opening signals.
ADX: Judging the strength of the trend. ADX above a certain position generates opening signals.
The above indicators, with different cycle length parameters, form a multi-dimensional judgment system that can generate strong opening signals when the trend is obvious.
Specifically, the buy conditions are:
- When Aroon_1 is lower than -85
- When the MA forms a golden cross
- When Williams %R is lower than -99
- When ADX is higher than 14
- When Aroon_2 is higher than -39
When 3 of the 5 buy conditions are met, a strong buy signal is generated.
The sell conditions are similar, with 5 sell conditions. When 3 of them are met, a sell signal is generated.
So this strategy can produce high certainty strong opening signals when the trend is obvious, through the combination of different indicators.
Advantage Analysis
The biggest advantage of this strategy is the multi-dimensional combination of indicator signals, which greatly reduces the probability of erroneous signals caused by a single indicator, thereby being able to generate high-quality opening signals when the trend is obvious. This is the biggest highlight of this strategy.
Other advantages include:
The parameters can be adjusted to adapt to different market characteristics
The parameter settings of the indicators are scientifically reasonable and highly robust
The combination of multiple time cycles is realized to improve the accuracy of judgment
The code structure is clear and easy to understand and secondary development
Risk Analysis
This strategy also has some risks:
Although the combination of multiple indicators can improve the quality of judgment, it also increases the complexity of the strategy and expands the risk of over-optimization.
The parameter settings are not 100% perfect and may fail under specific market conditions.
There is still room for optimization in the combination of indicator methods. The combination logic can be further refined.
Short-term adjustment opportunities may be missed.
Corresponding solutions:
Increase sample backtesting to test the robustness of parameters
Adjust some parameters to adapt to more markets
Optimize the integration method of indicators to improve judgment quality
Appropriately shorten some indicator parameters to increase capturing of short-term adjustments
Optimization Directions
The main optimization direction of this strategy is the optimization of the indicator integration method, which mainly includes:
Add more different types of indicators to form an indicator forest to further improve judgment accuracy
Optimize indicator parameter settings to automatically adapt to market changes
Use machine learning and other methods to automatically search for optimal indicator integration solutions
Increase stop-loss strategies to control risks
Combine sentiment indicators, judge market heat, and dynamically adjust parameters
There is still a lot of room for improvement in the judgment quality and robustness of this strategy by integrating more indicators, automatically optimizing parameters and integration schemes.
Summary
The biggest highlight of this strategy is the scientific integration of multiple indicators to form a powerful opening signal that performs significantly when the trend is obvious. There is a lot of room for optimization in the integration methods of this strategy. By introducing more indicators and intelligent optimization of parameters and integration methods, this strategy can become a very powerful quantitative trading strategy.
Parameters
| Name | Default | What it controls |
|---|---|---|
| v_input_1 | 264 | Length Aroon_1 |
| v_input_2 | 72 | Length Aroon_2 |
| v_input_3 | 137 | Length Aroon_3 |
| v_input_4 | 62 | Length Aroon_4 |
| v_input_5 | 270 | BB length |
| v_input_6_close | 0 | Source: close | high | low | open | hl2 | hlc3 | hlcc4 | ohlc4 |
| v_input_7 | 2 | BB mult |
| v_input_8 | 130 | Length Williams %R |
| v_input_9 | 14 | ADX Smoothing |
| v_input_10 | 145 | DI Length |
| v_input_11 | 14 | ADX Smoothing |
| v_input_12 | 150 | DI Length |
| v_input_13 | -85 | Aroon_1 Position Index_Down |
| v_input_14 | 117 | ma double_1 wma_Short |
| v_input_15 | 86 | ma double_1 sma_Long |
| v_input_16 | -99 | Williams Position Index_Down |
| v_input_17 | 14 | ADX Position Index_Up |
| v_input_18 | -39 | Aroon_2 Position Index_Up |
| v_input_19 | 120 | BB Position Index_Up |
| v_input_20 | 99 | Aroon_3 Position Index_Up |
| v_input_21 | 88 | ma double_2 ema_Short |
| v_input_22 | 96 | ma double_2 sma_Long |
| v_input_23 | 9 | ADX_2 Position Index_Up |
| v_input_24 | 35 | Aroon_4 Position Index_Down |
| v_input_25 | 8 | From Month |
| v_input_26 | true | From Day |
| v_input_27 | 2018 | From Year |
| v_input_28 | 12 | To Month |
| v_input_29 | 31 | To Day |
| v_input_30 | 2018 | To Year |
Source Pine Script
/*backtest
start: 2023-12-19 00:00:00
end: 2024-01-18 00:00:00
period: 1h
basePeriod: 15m
exchanges: [{"eid":"Futures_Binance","currency":"BTC_USDT"}]
*/

//@version=3
strategy(title="Aroon+Williams+MA2+ADX+Aroon Str.", shorttitle="Aroon+Williams+MA2+ADX+Aroon Str.", overlay=true)
//https://cafe.naver.com/watchbot/1945
//<<빙썸 매각 기념>> 바이낸스 이오스 복합지표

//Aroon_1
length_1 = input(264, minval=1, title="Length Aroon_1")
upper_1 = 100 * (highestbars(high, length_1+1) + length_1)/length_1
lower_1 = 100 * (lowestbars(low, length_1+1) + length_1)/length_1
midp_1 = 0
oscillator_1 = upper_1 - lower_1
//osc_1 = plot(oscillator_1, color=red)

//Aroon_2
length_2 = input(72, minval=1, title="Length Aroon_2")
upper_2 = 100 * (highestbars(high, length_2+1) + length_2)/length_2
lower_2 = 100 * (lowestbars(low, length_2+1) + length_2)/length_2
midp_2 = 0
oscillator_2 = upper_2 - lower_2
//osc_2 = plot(oscillator_2, color=red)

//Aroon_3
length_3 = input(137, minval=1, title="Length Aroon_3")
upper_3 = 100 * (highestbars(high, length_3+1) + length_3)/length_3
lower_3 = 100 * (lowestbars(low, length_3+1) + length_3)/length_3
midp_3 = 0
oscillator_3 = upper_3 - lower_3
//osc_3 = plot(oscillator_3, color=red)

//Aroon_4
length_4 = input(62, minval=1, title="Length Aroon_4")
upper_4 = 100 * (highestbars(high, length_4+1) + length_4)/length_4
lower_4 = 100 * (lowestbars(low, length_4+1) + length_4)/length_4
midp_4 = 0
oscillator_4 = upper_4 - lower_4
//osc_4 = plot(oscillator_4, color=red)

//Ma double
short_ma_1 = sma(close, 9)
long_ma_1 = sma(close, 21)
// plot(short_ma_1, color = red)
// plot(long_ma_1, color = green)
// plot(cross(short_ma_1, long_ma_1) ? short_ma_1 : na, style = cross, linewidth = 4)

short_ma_2 = sma(close, 9)
long_ma_2 = sma(close, 21)
// plot(short_ma_2, color = red)
// plot(long_ma_2, color = green)
plot(cross(short_ma_2, long_ma_2) ? short_ma_2 : na, transp= 100, title = "ma cross_2", style = cross, linewidth = 4)

//BB
length_bb = input(270, minval=1, title="BB length")
src_bb = input(close, title="Source")
mult_bb = input(2.0, minval=0.001, maxval=50, title="BB mult")
basis_bb = sma(src_bb, length_bb)
dev_bb = mult_bb * stdev(src_bb, length_bb)
upper_bb = basis_bb + dev_bb
lower_bb = basis_bb - dev_bb
// plot(basis_bb, color=red)
// p1 = plot(upper_bb, color=blue)
// p2 = plot(lower_bb, color=blue)
// fill(p1, p2)

//Williams
length_wil = input(130, minval=1, title="Length Williams %R")
upper_wil = highest(length_wil)
lower_wil = lowest(length_wil)
out_wil = 100 * (close - upper_wil) / (upper_wil - lower_wil)
// plot(out_wil)
// band1 = hline(-20)
// band0 = hline(-80)
// fill(band1, band0)


//ADX
adxlen = input(14, title="ADX Smoothing")
dilen = input(145, title="DI Length")
dirmov(len) =>
	up_adx = change(high)
	down_adx = -change(low)
	plusDM = na(up_adx) ? na : (up_adx > down_adx and up_adx > 0 ? up_adx : 0)
    minusDM = na(down_adx) ? na : (down_adx > up_adx and down_adx > 0 ? down_adx : 0)
	truerange = rma(tr, len)
	plus_adx = fixnan(100 * rma(plusDM, len) / truerange)
	minus_adx = fixnan(100 * rma(minusDM, len) / truerange)
	[plus_adx, minus_adx]

adx(dilen, adxlen) =>
	[plus_adx, minus_adx] = dirmov(dilen)
	sum_adx = plus_adx + minus_adx
	adx = 100 * rma(abs(plus_adx - minus_adx) / (sum_adx == 0 ? 1 : sum_adx), adxlen)

sig_adx = adx(dilen, adxlen)

// plot(sig_adx, color=red, title="ADX")


//ADX 2
adxlen_2 = input(14, title="ADX Smoothing")
dilen_2 = input(150, title="DI Length")
dirmov_2(len) =>
	up_adx_2 = change(high)
	down_adx_2 = -change(low)
	plusDM_2 = na(up_adx_2) ? na : (up_adx_2 > down_adx_2 and up_adx_2 > 0 ? up_adx_2 : 0)
    minusDM_2 = na(down_adx_2) ? na : (down_adx_2 > up_adx_2 and down_adx_2 > 0 ? down_adx_2 : 0)
	truerange_2 = rma(tr, len)
	plus_adx_2 = fixnan(100 * rma(plusDM_2, len) / truerange_2)
	minus_adx_2 = fixnan(100 * rma(minusDM_2, len) / truerange_2)
	[plus_adx_2, minus_adx_2]

adx_2(dilen_2, adxlen_2) =>
	[plus_adx_2, minus_adx_2] = dirmov_2(dilen_2)
	sum_adx_2 = plus_adx_2 + minus_adx_2
	adx_2 = 100 * rma(abs(plus_adx_2 - minus_adx_2) / (sum_adx_2 == 0 ? 1 : sum_adx_2), adxlen_2)

sig_adx_2 = adx(dilen_2, adxlen_2)

// plot(sig_adx_2, color=red, title="ADX_2")

//Input Position
//buy position
pos_aroon1 = input(-85, title="Aroon_1 Position Index_Down")
pos_madouble1_short = input(117, title="ma double_1 wma_Short")
pos_madouble1_long =  input(86, title="ma double_1 sma_Long")
pos_wil = input(-99, title="Williams Position Index_Down")
pos_adx= input(14, title="ADX Position Index_Up")
pos_aroon2 = input(-39, title="Aroon_2 Position Index_Up")

//sell position
pos_bb = input(120, title="BB Position Index_Up")
pos_aroon_3 = input(99, title="Aroon_3 Position Index_Up")
pos_madouble2_short= input(88, title="ma double_2 ema_Short")
pos_madouble2_long= input(96, title="ma double_2 sma_Long")
pos_adx_2= input(9, title="ADX_2 Position Index_Up")
pos_aroon_4 = input(35, title="Aroon_4 Position Index_Down")

//Condition
longCondition_aroon_1 = (oscillator_1 <= pos_aroon1)
longCondition_ma2 = (pos_madouble1_short > pos_madouble1_long)
longCondition_wil = (out_wil <= pos_wil)
longCondition_adx = (sig_adx >= pos_adx)
longCondition_aroon_2 = (oscillator_2 >= pos_aroon2)

shortCondition_bb = (close > basis_bb)
shortCondition_aroon_3 = (oscillator_3 >= pos_aroon_3)
shortCondition_ma2 = (pos_madouble2_short < pos_madouble2_long)
shortCondition_adx = (sig_adx_2 >= pos_adx_2)
shortCondition_aroon_4 = (oscillator_4 <= pos_aroon_4)

vl_aroon_1 = 0
vl_ma2 = 0
vl_wil = 0
vl_adx = 0
vl_aroon_2 = 0

if longCondition_aroon_1
    vl_aroon_1 := 1

if longCondition_ma2
    vl_ma2 := 3

if longCondition_wil
    vl_wil := 1

if longCondition_adx
    vl_adx := -1

if longCondition_aroon_2
    vl_aroon_2 := -1


vs_bb = 0
vs_aroon_3 = 0
vs_ma2 = 0
vs_adx = 0
vs_aroon_4 = 0

if shortCondition_bb
    vs_bb := 1

if shortCondition_aroon_3
    vs_aroon_3 := 1

if shortCondition_ma2
    vs_ma2 := 3

if shortCondition_adx
    vs_adx := -2

if shortCondition_aroon_4
    vs_aroon_4 := -1

// plotshape(vl_aroon_1, title= "vl_aroon_1", location=location.belowbar, color=green, text="vl_aroon_1")
// plotshape(vl_ma2, title= "vl_ma2", location=location.belowbar, color=green, text="\nvl_ma2")
// plotshape(vl_wil, title= "vl_wil", location=location.belowbar, color=green, text="\n\nvl_wil")
// plotshape(vl_adx, title= "vl_adx", location=location.belowbar, color=green, text="\n\n\nvl_adx")
// plotshape(vl_aroon_2, title= "vl_aroon_2", location=location.belowbar, color=green, text="\n\n\n\nvl_aroon_2")

// plotshape(vs_bb, title= "vs_bb", location=location.abovebar, color=orange, text="vs_bb")
// plotshape(vs_aroon_3, title= "vs_aroon_3", location=location.abovebar, color=orange, text="vs_aroon_3\n")
// plotshape(vs_ma2, title= "vs_ma2", location=location.abovebar, color=orange, text="vs_ma2\n\n")
// plotshape(vs_adx, title= "vs_adx", location=location.abovebar, color=orange, text="vs_adx\n\n\n")
// plotshape(vs_aroon_4, title= "vs_aroon_4", location=location.abovebar, color=orange, text="vs_aroon_4\n\n\n\n")

longCondition = (vl_aroon_1 + vl_ma2 + vl_wil + vl_adx + vl_aroon_2) >= 3 ? true : na
shortCondition = (vs_bb + vs_aroon_3 + vs_ma2 + vs_adx + vs_aroon_4) >= 3 ? true : na

buy = longCondition == 1 ? longCondition : na
sell = shortCondition == 1? shortCondition : na

// plotshape(buy, title= "buy", location=location.bottom, color=green, text="buy")
// plotshape(sell, title= "sell", location=location.top, color=orange, text="sell")


// === BACKTEST RANGE ===
FromMonth = input(defval = 8, title = "From Month", minval = 1, maxval = 12)
FromDay   = input(defval = 1, title = "From Day", minval = 1, maxval = 31)
FromYear  = input(defval = 2018, title = "From Year", minval = 2014)
ToMonth   = input(defval = 12, title = "To Month", minval = 1, maxval = 12)
ToDay     = input(defval = 31, title = "To Day", minval = 1, maxval = 31)
ToYear    = input(defval = 2018, title = "To Year", minval = 2014)

strategy.entry("L", strategy.long, when=(buy))
strategy.close("L", when=(sell))
// strategy.entry("S", strategy.short, when=(sell and (time >= timestamp(FromYear, FromMonth, FromDay, 00, 00)) and (time <= timestamp(ToYear, ToMonth, ToDay, 23, 59))))
// strategy.close("S", when=(buy and (time <= timestamp(ToYear, ToMonth, ToDay, 23, 59))))Published by ChaoZhang on the FMZ strategy square · last modified 2024-01-19. Collected in the Quant Trading Vault. Unvalidated research: re-test with your own data and costs before trusting it.
Build this with AgenKit
A spec is not a trading system. Paste this into your coding agent and AgenKit runs a specialist team — architecture, test-first build, risk gates, review — with paper trading on by default.
/agenkit build a production-grade trading bot with a backtest engine, risk controls and paper trading by default from strategies/Aroon-Williams-MA-BB-ADX-Powerful-Multi-indicator-Strategy.md- npx agenkit install engineering-kit in your project
- Paste the command into your agent and approve each phase
- Get tests, backtest, risk controls and a paper-trading switch
Understand it first
Before you run this, read the lesson behind the idea and how to backtest it honestly. Specs like this one are the survivors of an unknown number of trials; deflate their results accordingly.
Related specs
- Advanced Momentum EMA Trend Following with RSI Overbought Oversold Trading StrategyPine Script · Mean reversion · 1d
- Momentum Indicator RSI Reversal Trading StrategyPine Script · Mean reversion · 1d
- Moving Average Envelopes Trading StrategyPine Script · Mean reversion · 1h
- Multi Indicator Reversal Point Capture Trading StrategyPine Script · Mean reversion · 1d
- Reversal Trading Strategy with Bollinger Bands RSI ADX and ATRPine Script · Mean reversion · 1h
- Trend Reversal Momentum Indicators Crossover Tracking StrategyPine Script · Mean reversion · 1h