Strategy vault / Trend following
ATR Trend Following Strategy Based on Standard Deviation Channel
This strategy named "ATR Trend Following Strategy" is a trend following trading strategy based on Average True Range (ATR) for stop loss and standard deviation channel for entry signals. It is suitable for financial…
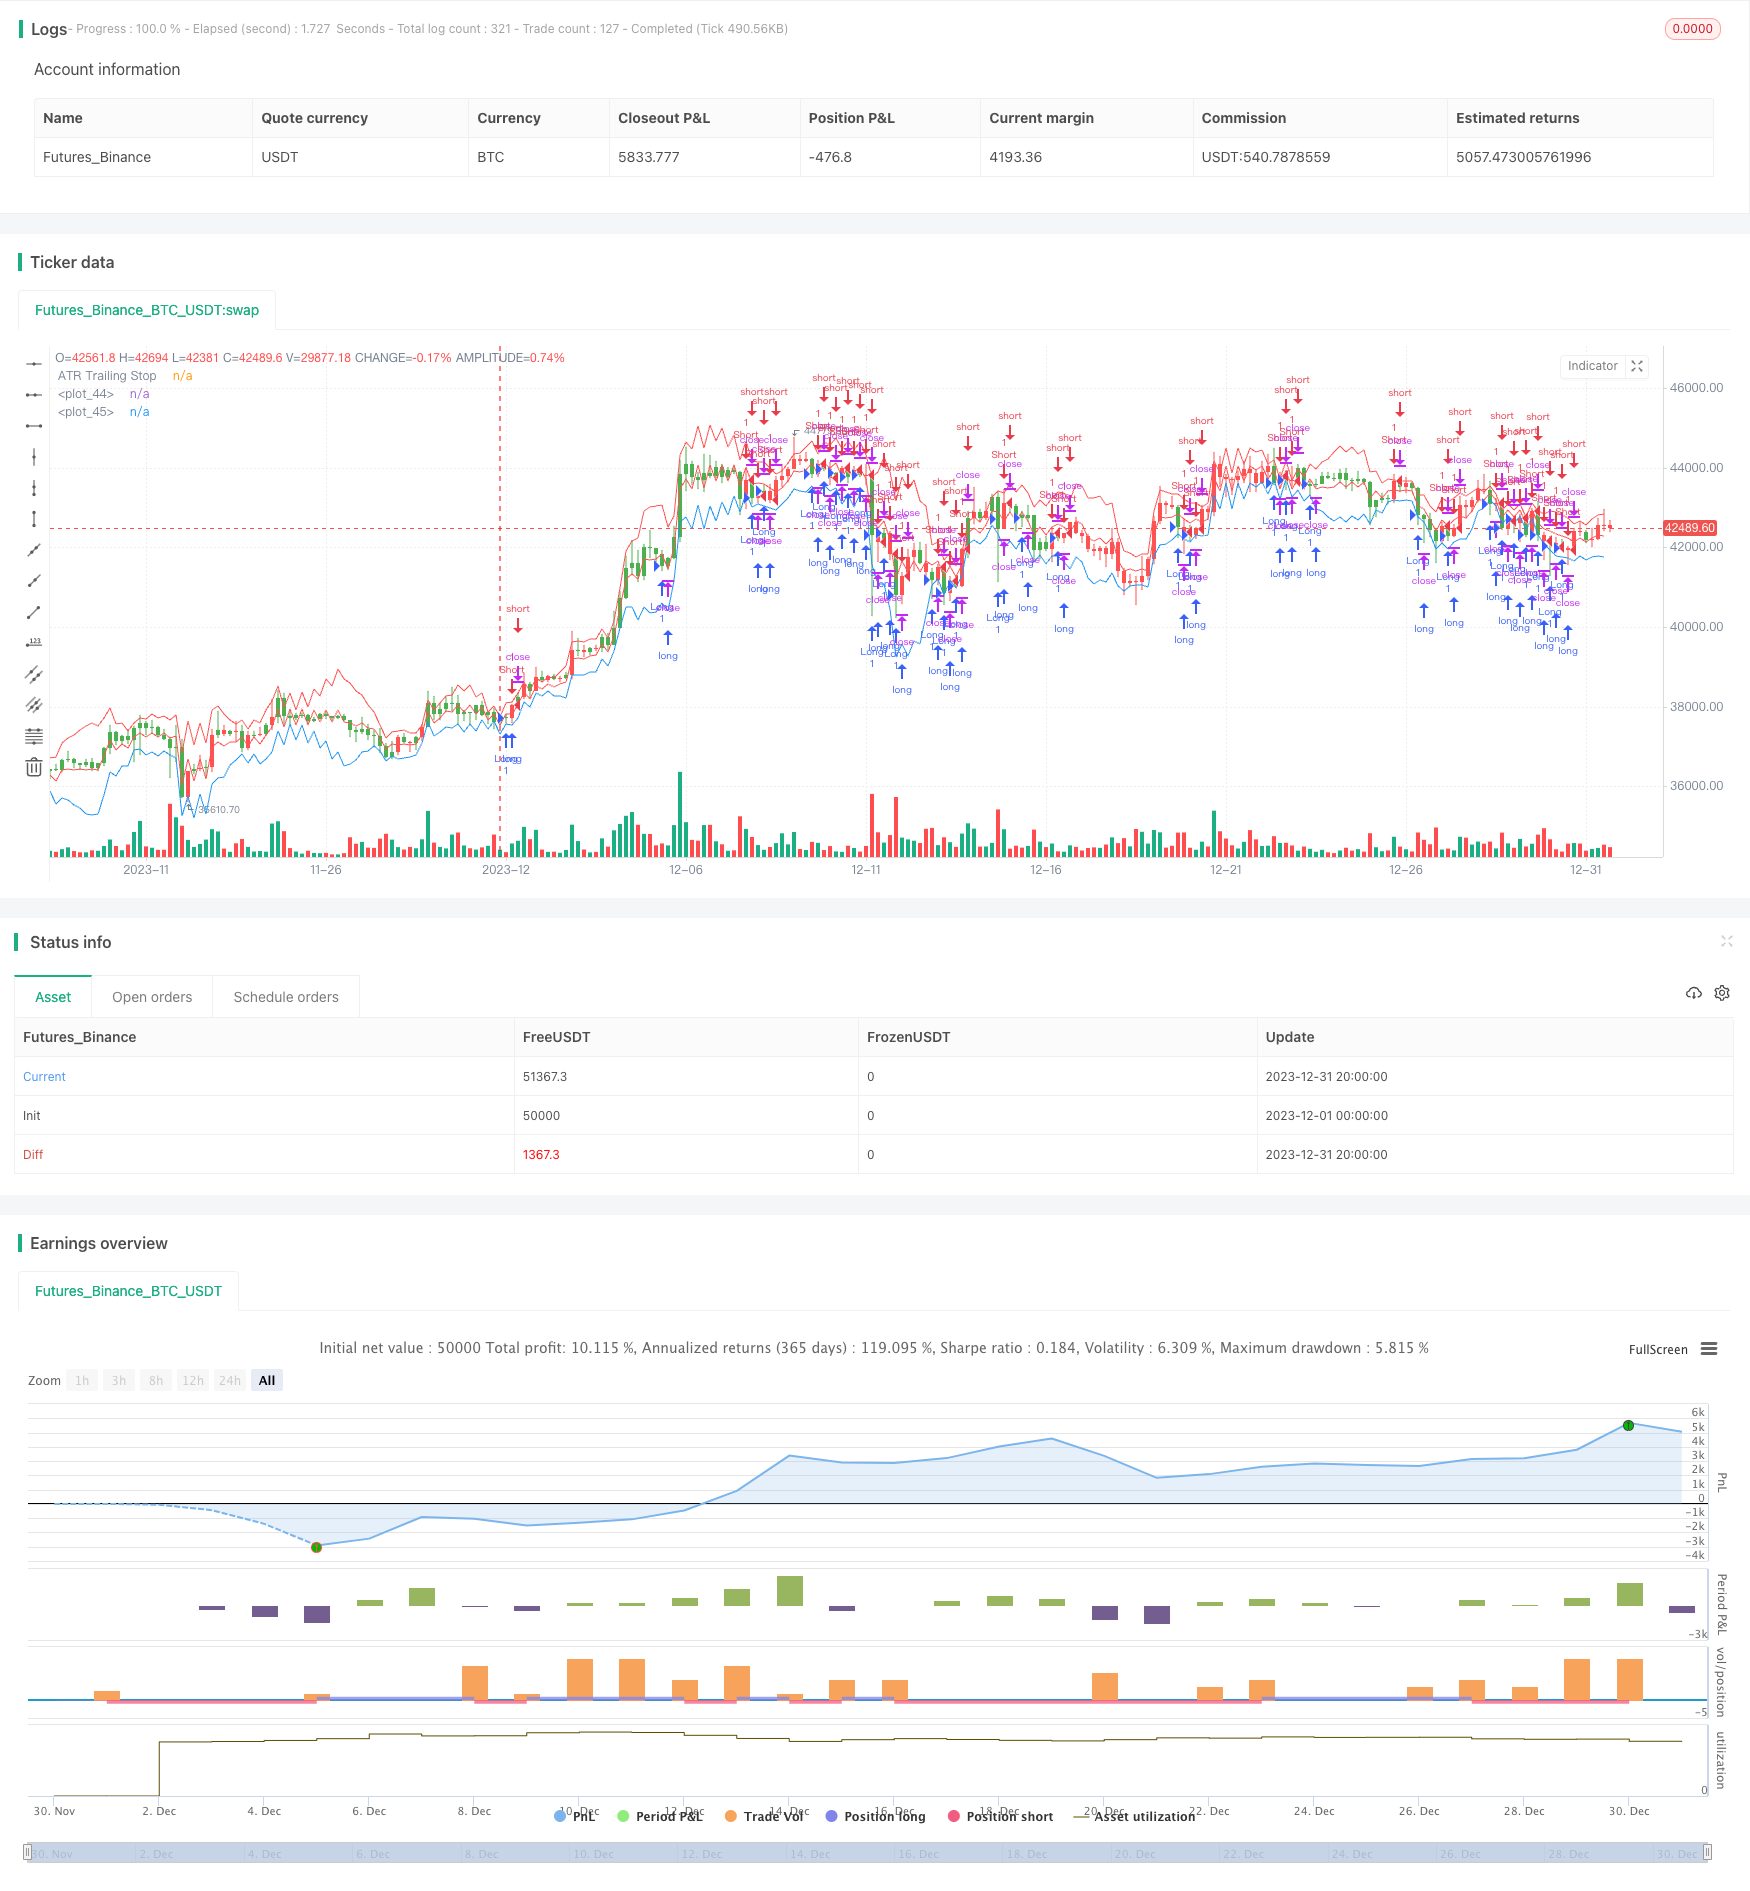
Overview
This strategy named "ATR Trend Following Strategy" is a trend following trading strategy based on Average True Range (ATR) for stop loss and standard deviation channel for entry signals. It is suitable for financial products with obvious trends, such as indexes, forex and commodities.
Trading Logic
The strategy uses ATR indicator to set stop loss price. ATR reflects the volatility of the market and can be used to dynamically set stop loss distance. The strategy calculates ATR value based on user input ATR period and multiplier, and uses the ATR value multiplied by the multiplier as stop loss distance. Specifically, the ATR trailing stop calculation formula is:
ATR Line = Prior ATR Line ± nLoss (nLoss = nATRMultip * ATR value)

If close > ATR Line, adjust ATR Line up to close - nLoss
If close < ATR Line, adjust ATR Line down to close + nLoss
This way, the ATR line can adjust dynamically based on price fluctuation to achieve trend following stop loss.
In addition to ATR trailing stop, the strategy also uses standard deviation channel to determine entry signals. The standard deviation channel calculation formula is:
Middle Line = ATR Trailing Stop Line
Upper Band = Middle Line + n * Standard Deviation
Lower Band = Middle Line - n * Standard Deviation
Go long when price breaks middle line upwards. Go short when price breaks middle line downwards.
Advantages
The biggest advantage of this strategy is that it uses ATR indicator to set stop loss dynamically based on market volatility, enabling trend following stop loss and effective risk control.
Additionally, using standard deviation channel for entry signals avoids frequently opening positions due to small price fluctuations.
Risks and Solutions
The main risk is that if stop loss distance is too big it cannot control risk effectively, but if it is too small it can be easily stopped out by market noise. To address this risk, ATR period and multiplier can be optimized to find the best parameter combination.
Another risk is inappropriate standard deviation channel parameters leading to overly high/low entry frequency. Parameters can be optimized to find the optimum.
Enhancement Opportunities
The strategy can be enhanced from the following aspects:
Optimize ATR period and multiplier to achieve better stop loss effect.
Optimize standard deviation channel parameters for better entry signals.
Add other indicators for filtering, e.g. moving average, candlestick patterns etc., to assist judging trend direction and improve profitability.
Optimize entry and exit logic, e.g. open positions only after confirming candlestick pattern when price reaches channel bands.
Summary
The strategy achieves trend following stop loss based on ATR indicator and uses standard deviation channel for entry signals. Its advantages lie in good risk control capability for trend trading. Risks and enhancements are also clearly analyzed. The strategy is worth further testing and optimization and has practical trading value.
Parameters
| Name | Default | What it controls |
|---|---|---|
| v_input_1 | 11 | nATRPeriod |
| v_input_2 | 0.5 | nATRMultip |
| v_input_3 | 8 | From Month |
| v_input_4 | 18 | From Day |
| v_input_5 | 2013 | From Year |
| v_input_6 | true | To Month |
| v_input_7 | true | To Day |
| v_input_8 | 2020 | To Year |
Source Pine Script
/*backtest
start: 2023-12-01 00:00:00
end: 2023-12-31 23:59:59
period: 4h
basePeriod: 15m
exchanges: [{"eid":"Futures_Binance","currency":"BTC_USDT"}]
*/

//@version = 2
strategy(title="Average True Range Strategy", overlay = true)
nATRPeriod = input(11) //Hur många perioder ATR är på
nATRMultip = input(0.5) //Hur många gånger nuvarande ATR multipliceras med
xATR = atr(nATRPeriod)
nLoss = nATRMultip * xATR
xATRTrailingStop =  iff(close > nz(xATRTrailingStop[1], 0) and close[1] > nz(xATRTrailingStop[1], 0), max(nz(xATRTrailingStop[1]), close - nLoss),
                     iff(close < nz(xATRTrailingStop[1], 0) and close[1] < nz(xATRTrailingStop[1], 0), min(nz(xATRTrailingStop[1]), close + nLoss),
                      iff(close > nz(xATRTrailingStop[1], 0), close - nLoss, close + nLoss)))
pos = iff(close[1] < nz(xATRTrailingStop[1], 0) and close > nz(xATRTrailingStop[1], 0), -1,
	   iff(close[1] > nz(xATRTrailingStop[1], 0) and close < nz(xATRTrailingStop[1], 0), 1, nz(pos[1], 0)))

stdev3 = 14*stdev(xATR, nATRPeriod)
band1 = xATRTrailingStop+stdev3 //Översta stdev bandet
band2 = xATRTrailingStop-stdev3 //Nedersta stdev bandet


// Datum och tid
FromMonth = input(defval = 8, title = "From Month", minval = 1, maxval = 12)
FromDay   = input(defval = 18, title = "From Day", minval = 1, maxval = 31)
FromYear  = input(defval = 2013, title = "From Year", minval = 2013)
ToMonth   = input(defval = 1, title = "To Month", minval = 1, maxval = 12)
ToDay     = input(defval = 1, title = "To Day", minval = 1, maxval = 31)
ToYear    = input(defval = 2020, title = "To Year", minval = 2017)

start     = timestamp(FromYear, FromMonth, FromDay, 00, 00)  // backtest start
finish    = timestamp(ToYear, ToMonth, ToDay, 23, 59)        // backtest slut
startTimeOk()  => true
initial_capital = 100000

take = close > xATRTrailingStop

if( startTimeOk() ) and (pos == 1)
//if (pos == 1)
    strategy.entry("Long", strategy.long, comment = "KOP")
    strategy.exit("Long", when = take)

if( startTimeOk() ) and (pos == -1)
//if (pos == -1)
    strategy.entry("Short", strategy.short, comment = "SALJ")

barcolor(pos == -1 ? red: pos == 1 ? green : blue )
plot(xATRTrailingStop, color=red, title="ATR Trailing Stop") //Mittersta linjen som är triggerlinjen för köp/sälj
plot(band1, color=red)
plot(band2, color=blue)
Published by ChaoZhang on the FMZ strategy square · last modified 2024-01-05. Collected in the Quant Trading Vault. Unvalidated research: re-test with your own data and costs before trusting it.
Build this with AgenKit
A spec is not a trading system. Paste this into your coding agent and AgenKit runs a specialist team — architecture, test-first build, risk gates, review — with paper trading on by default.
/agenkit build a production-grade trading bot with a backtest engine, risk controls and paper trading by default from strategies/ATR-Trend-Following-Strategy-Based-on-Standard-Deviation-Channel.md- npx agenkit install engineering-kit in your project
- Paste the command into your agent and approve each phase
- Get tests, backtest, risk controls and a paper-trading switch
Understand it first
Before you run this, read the lesson behind the idea and how to backtest it honestly. Specs like this one are the survivors of an unknown number of trials; deflate their results accordingly.
Related specs
- ATR Dynamic Profit Target and Stop Loss StrategyPine Script · Trend following · 1d
- ATR Dynamic Trend Following and EMA Crossover Trading StrategyPine Script · Trend following · 1d
- ATR and Moving Average Crossover Hybrid StrategyPine Script · Trend following · 1h
- ATR and T3 Moving Average StrategyPine Script · Trend following · 5m
- Adaptive ATR and RSI Trend Following Strategy with Trailing Stop LossPine Script · Trend following · 1h
- Adaptive Risk Management Strategy Based on Dynamic ATR and Moving Average CrossoverPine Script · Trend following · 2h