Strategy vault / Trend following
Adaptive ATR and RSI Trend Following Strategy with Trailing Stop Loss
This strategy combines Average True Range (ATR), Relative Strength Index (RSI) and trailing stop loss to achieve adaptive trend following. Dynamic stop loss is calculated by ATR to reflect market volatility, RSI…
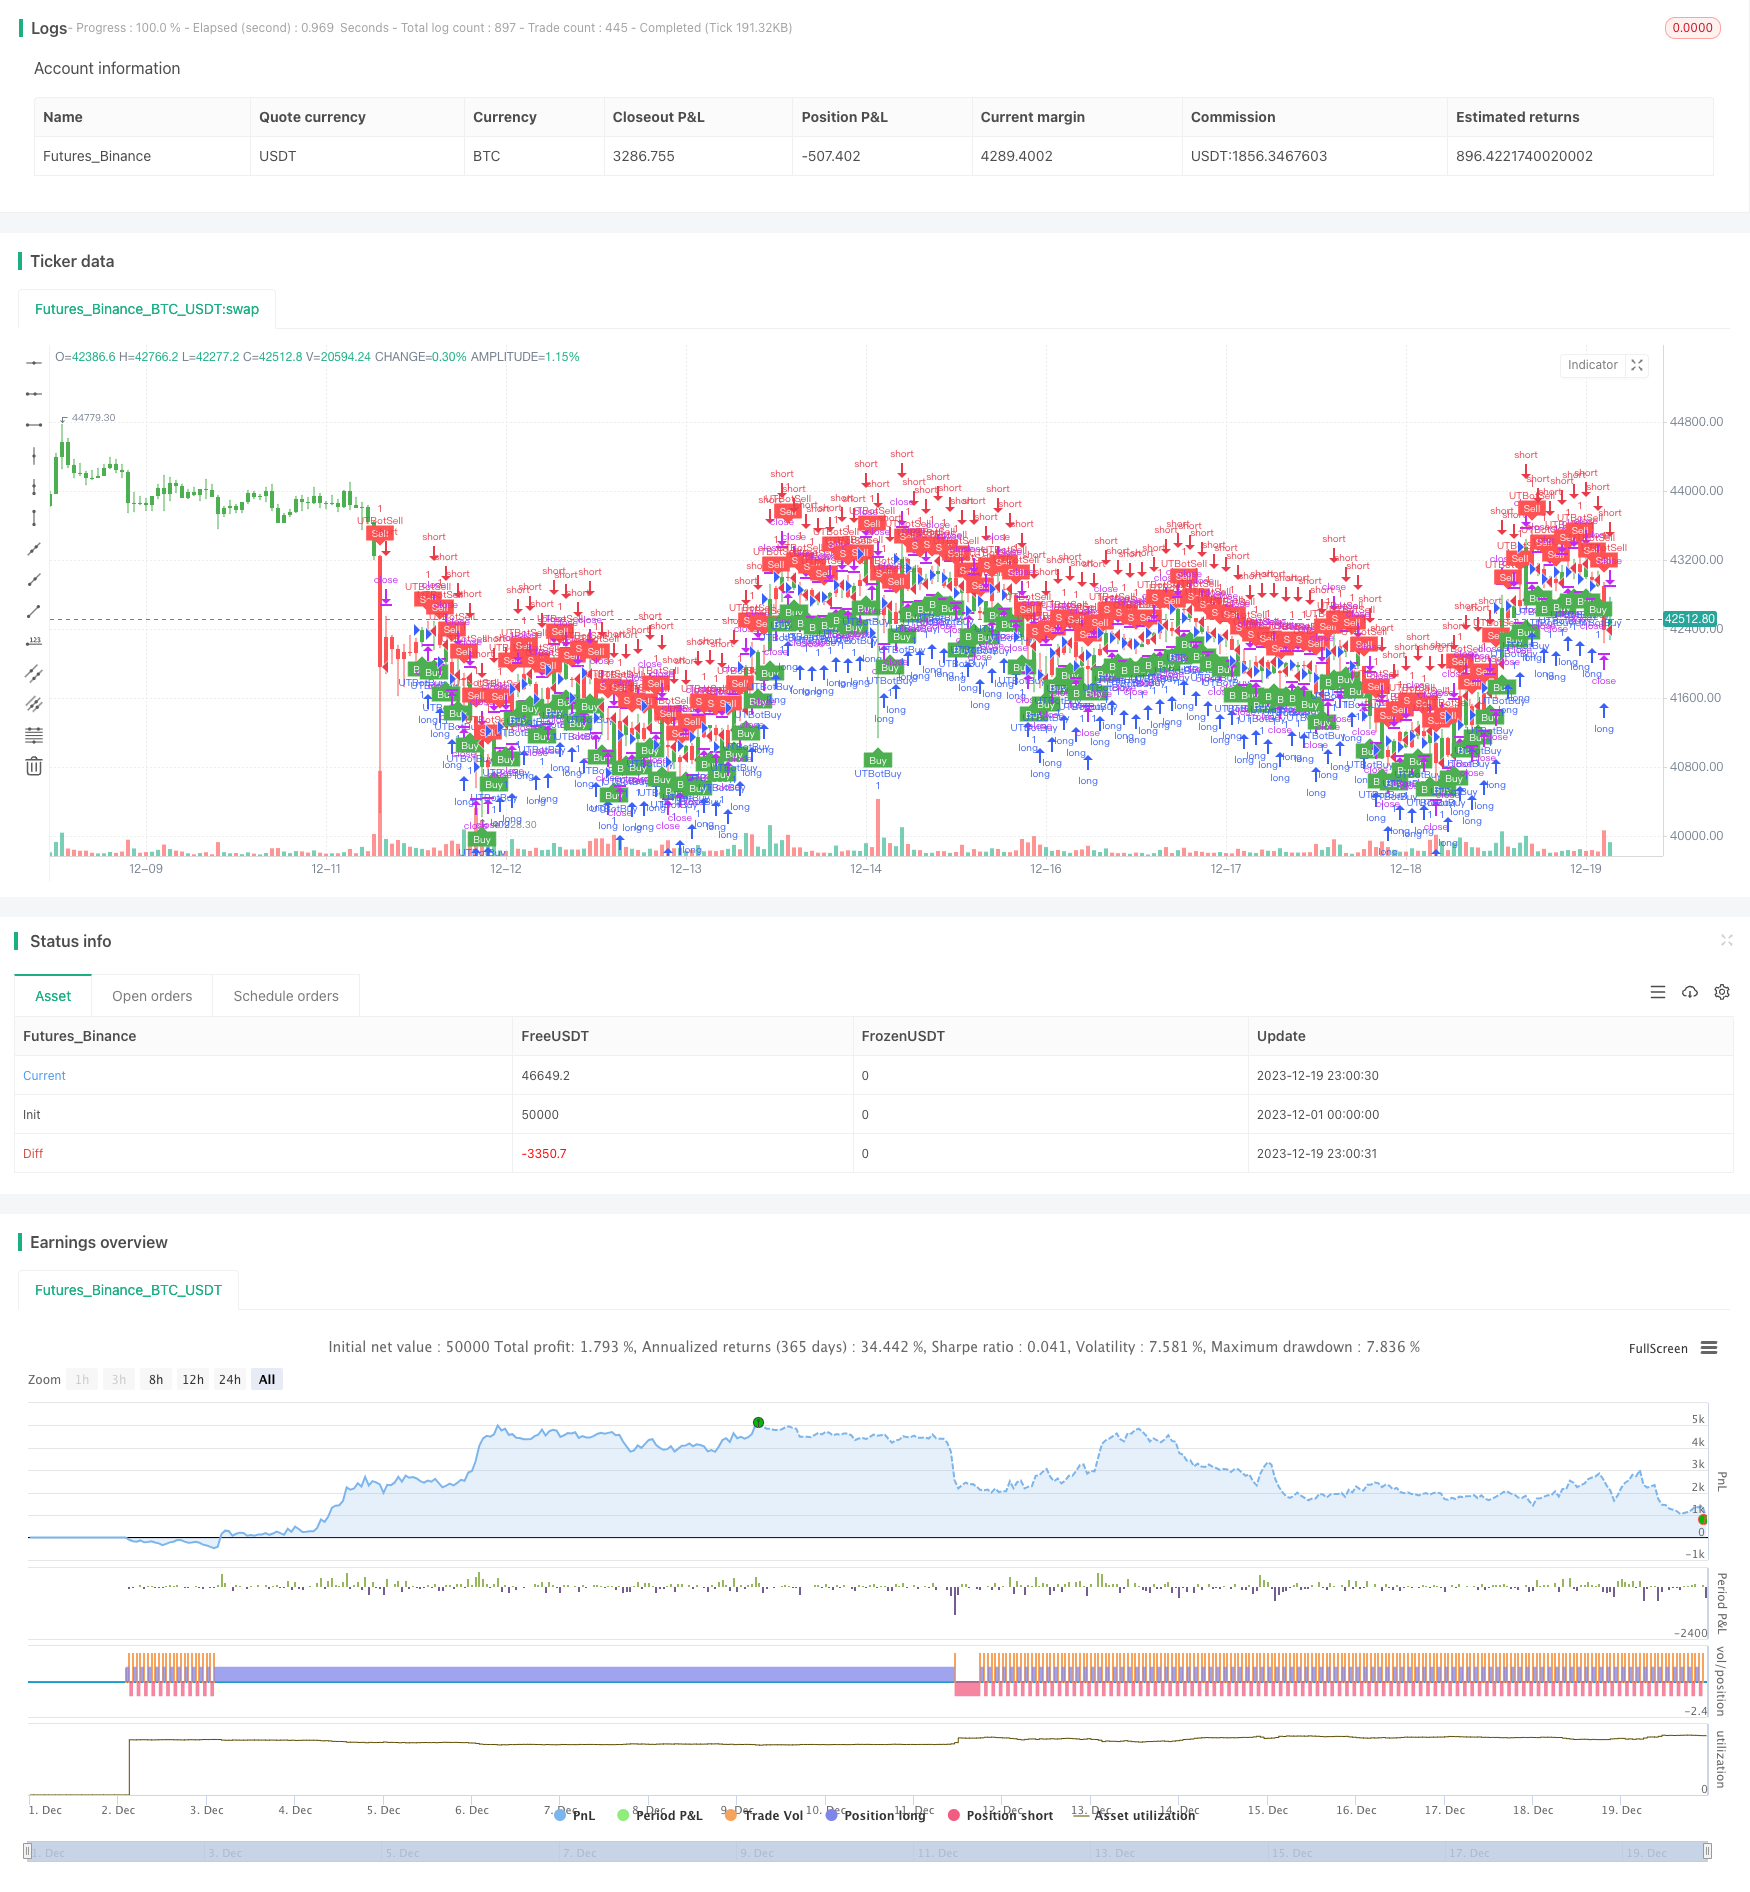
Overview
This strategy combines Average True Range (ATR), Relative Strength Index (RSI) and trailing stop loss to achieve adaptive trend following. Dynamic stop loss is calculated by ATR to reflect market volatility, RSI identifies the trend direction, and trailing stop loss tracks price fluctuation to maximize profit. It is a very typical trend following strategy.
Principles
Calculate ATR. ATR shows market volatility and risk level. This strategy uses ATR to compute dynamic stop loss for adaptive risk control.
Calculate RSI. RSI judges overbought/oversold status. When RSI is above 50 it signals bullish outlook, when below 50 bearish outlook. This strategy utilizes RSI to determine trend direction.
Trailing stop loss tracking. According to stop loss level calculated by ATR and trend direction by RSI, this strategy keeps moving stop loss to track price fluctuation, to maximize profit while ensuring effective stop loss.
Specifically, long when RSI goes above 50, short when goes below 50. Then moving stop loss based on ATR to lock in profit along the trend.
Advantage Analysis
ATR adaptive stop loss considers market volatility, avoids too wide or too tight stop loss.
RSI reliably identifies trend, avoids whipsaws.
Trailing stop loss tracks trend to expand profit target.
Risk Analysis
ATR and RSI parameters need backtest optimization, otherwise impact strategy performance.
Although with stop loss protection, risk still exists for sudden price jump to penetrate stop loss. Can consider position sizing to control risk.
Strategy performance relies much on parameter tuning for different products.
Enhancement
Consider machine learning algorithms for adaptive parameter optimization.
Add position sizing control for dynamic adjustment based on market condition, to reduce stop loss penetration probability.
Add more trend indicators to avoid missing major trend reversal points.
Conclusion
This strategy integrates ATR, RSI and trailing stop loss for a typical adaptive trend following system. Through parameter tuning it can be flexibly adapted to different trading products, a recommended universal trend following strategy. With more judgements and machine learning optimization it can achieve even better performance.
Parameters
| Name | Default | What it controls |
|---|---|---|
| v_input_1 | 2019 | BACKTEST START YEAR |
| v_input_2 | true | BACKTEST START MONTH |
| v_input_3 | true | BACKTEST START DAY |
| v_input_4 | 2222 | BACKTEST STOP YEAR |
| v_input_5 | 12 | BACKTEST STOP MONTH |
| v_input_6 | 31 | BACKTEST STOP DAY |
| v_input_7_hlc3 | 0 | SOURCE: hlc3 | high | low | open | hl2 | close | hlcc4 | ohlc4 |
| v_input_8 | 14 | RSI LENGTH |
| v_input_9 | 52 | RSI CENTER LINE |
| v_input_10 | 7 | MACD FAST LENGTH |
| v_input_11 | 12 | MACD SLOW LENGTH |
| v_input_12 | 12 | MACD SIGNAL SMOOTHING |
| v_input_13 | 10 | Key Vaule. 'This changes the sensitivity' |
| v_input_14 | 3 | SmoothK |
| v_input_15 | 3 | SmoothD |
| v_input_16 | 14 | LengthRSI |
| v_input_17 | 14 | LengthStoch |
| v_input_18_close | 0 | RSISource: close | high | low | open | hl2 | hlc3 | hlcc4 | ohlc4 |
| v_input_19 | 10 | ATR Period |
Source Pine Script
/*backtest
start: 2023-12-01 00:00:00
end: 2023-12-19 23:59:59
period: 1h
basePeriod: 15m
exchanges: [{"eid":"Futures_Binance","currency":"BTC_USDT"}]
*/

//@version=2
strategy(title="UTBot Strategy", overlay = true )

// CREDITS to @HPotter for the orginal code.
// CREDITS to @Yo_adriiiiaan for recently publishing the UT Bot study based on the original code -
// CREDITS to @TradersAITradingPlans for making this Strategy.
// Strategy fixed with Time period by Kirk65.
// I am using this UT bot with 2 hours time frame with god resultss. Alert with "Once per bar" and stoploss 1.5%. If Alerts triggered and price goes against Alert. Stoploss will catch it. Wait until next Alert.
// While @Yo_adriiiiaan mentions it works best on a 4-hour timeframe or above, witch is a lot less risky, but less profitable.

testStartYear = input(2019, "BACKTEST START YEAR", minval = 1980, maxval = 2222)
testStartMonth = input(01, "BACKTEST START MONTH", minval = 1, maxval = 12)
testStartDay = input(01, "BACKTEST START DAY", minval = 1, maxval = 31)
testPeriodStart = timestamp(testStartYear,testStartMonth,testStartDay,0,0)
testStopYear = input(2222, "BACKTEST STOP YEAR", minval=1980, maxval = 2222)
testStopMonth = input(12, "BACKTEST STOP MONTH", minval=1, maxval=12)
testStopDay = input(31, "BACKTEST STOP DAY", minval=1, maxval=31)
testPeriodStop = timestamp(testStopYear, testStopMonth, testStopDay, 0, 0)

testPeriod = true

SOURCE = input(hlc3)
RSILENGTH = input(14, title = "RSI LENGTH")
RSICENTERLINE = input(52, title = "RSI CENTER LINE")
MACDFASTLENGTH = input(7, title = "MACD FAST LENGTH")
MACDSLOWLENGTH = input(12, title = "MACD SLOW LENGTH")
MACDSIGNALSMOOTHING = input(12, title = "MACD SIGNAL SMOOTHING")
a = input(10, title = "Key Vaule. 'This changes the sensitivity'")
SmoothK = input(3)
SmoothD = input(3)
LengthRSI = input(14)
LengthStoch = input(14)
RSISource = input(close)
c = input(10, title="ATR Period")
xATR = atr(c)
nLoss = a * xATR
xATRTrailingStop = iff(close > nz(xATRTrailingStop[1], 0) and close[1] > nz(xATRTrailingStop[1], 0), max(nz(xATRTrailingStop[1]), close - nLoss),
     iff(close < nz(xATRTrailingStop[1], 0) and close[1] < nz(xATRTrailingStop[1], 0), min(nz(xATRTrailingStop[1]), close + nLoss),
     iff(close > nz(xATRTrailingStop[1], 0), close - nLoss, close + nLoss)))
pos =	iff(close[1] < nz(xATRTrailingStop[1], 0) and close > nz(xATRTrailingStop[1], 0), 1,
     iff(close[1] > nz(xATRTrailingStop[1], 0) and close < nz(xATRTrailingStop[1], 0), -1, nz(pos[1], 0)))
color = pos == -1 ? red: pos == 1 ? green : blue
ema= ema(close,1)
above = crossover(ema,xATRTrailingStop )
below = crossover(xATRTrailingStop,ema)
buy = close > xATRTrailingStop and above
sell = close < xATRTrailingStop and below
barbuy = close > xATRTrailingStop
barsell = close < xATRTrailingStop
plotshape(buy, title = "Buy", text = 'Buy', style = shape.labelup, location = location.belowbar, color= green,textcolor = white, transp = 0, size = size.tiny)
plotshape(sell, title = "Sell", text = 'Sell', style = shape.labeldown, location = location.abovebar, color= red,textcolor = white, transp = 0, size = size.tiny)
barcolor(barbuy? green:na)
barcolor(barsell? red:na)
//alertcondition(buy, title='Buy', message='Buy')
//alertcondition(sell, title='Sell', message='Sell')

if (buy)
    strategy.entry("UTBotBuy",strategy.long, when=testPeriod)
if (sell)
strategy.entry("UTBotSell",strategy.short, when=testPeriod)Published by ChaoZhang on the FMZ strategy square · last modified 2024-01-23. Collected in the Quant Trading Vault. Unvalidated research: re-test with your own data and costs before trusting it.
Build this with AgenKit
A spec is not a trading system. Paste this into your coding agent and AgenKit runs a specialist team — architecture, test-first build, risk gates, review — with paper trading on by default.
/agenkit build a production-grade trading bot with a backtest engine, risk controls and paper trading by default from strategies/Adaptive-ATR-and-RSI-Trend-Following-Strategy-with-Trailing-Stop-Loss.md- npx agenkit install engineering-kit in your project
- Paste the command into your agent and approve each phase
- Get tests, backtest, risk controls and a paper-trading switch
Understand it first
Before you run this, read the lesson behind the idea and how to backtest it honestly. Specs like this one are the survivors of an unknown number of trials; deflate their results accordingly.
Related specs
- Bollinger Bands and RSI Trend Following StrategyPine Script · Trend following · 1h
- Dual ATR Channel Trend Following StrategyPine Script · Trend following · 15m
- Dynamic Dual EMA Crossover Strategy with Adaptive Profit Loss ControlPine Script · Trend following · 1d
- EMA and RSI Trend Trading StrategyPine Script · Trend following · 1d
- Fixed Range Volume Profile And Anchored VWAP Trend Identification Strategy With Dynamic Stop LossPine Script · Trend following · 1h
- Multi Moving Average Trend Capture and Crossover Confirmation Trading SystemPine Script · Trend following · 1m