Beyond The Clouds Strategy
This strategy uses the Super Trend indicator to assist in placing orders, and filters by cloud layers and candlestick colors to place limit orders for increasing profitability. Its goal is to quickly capture trends…
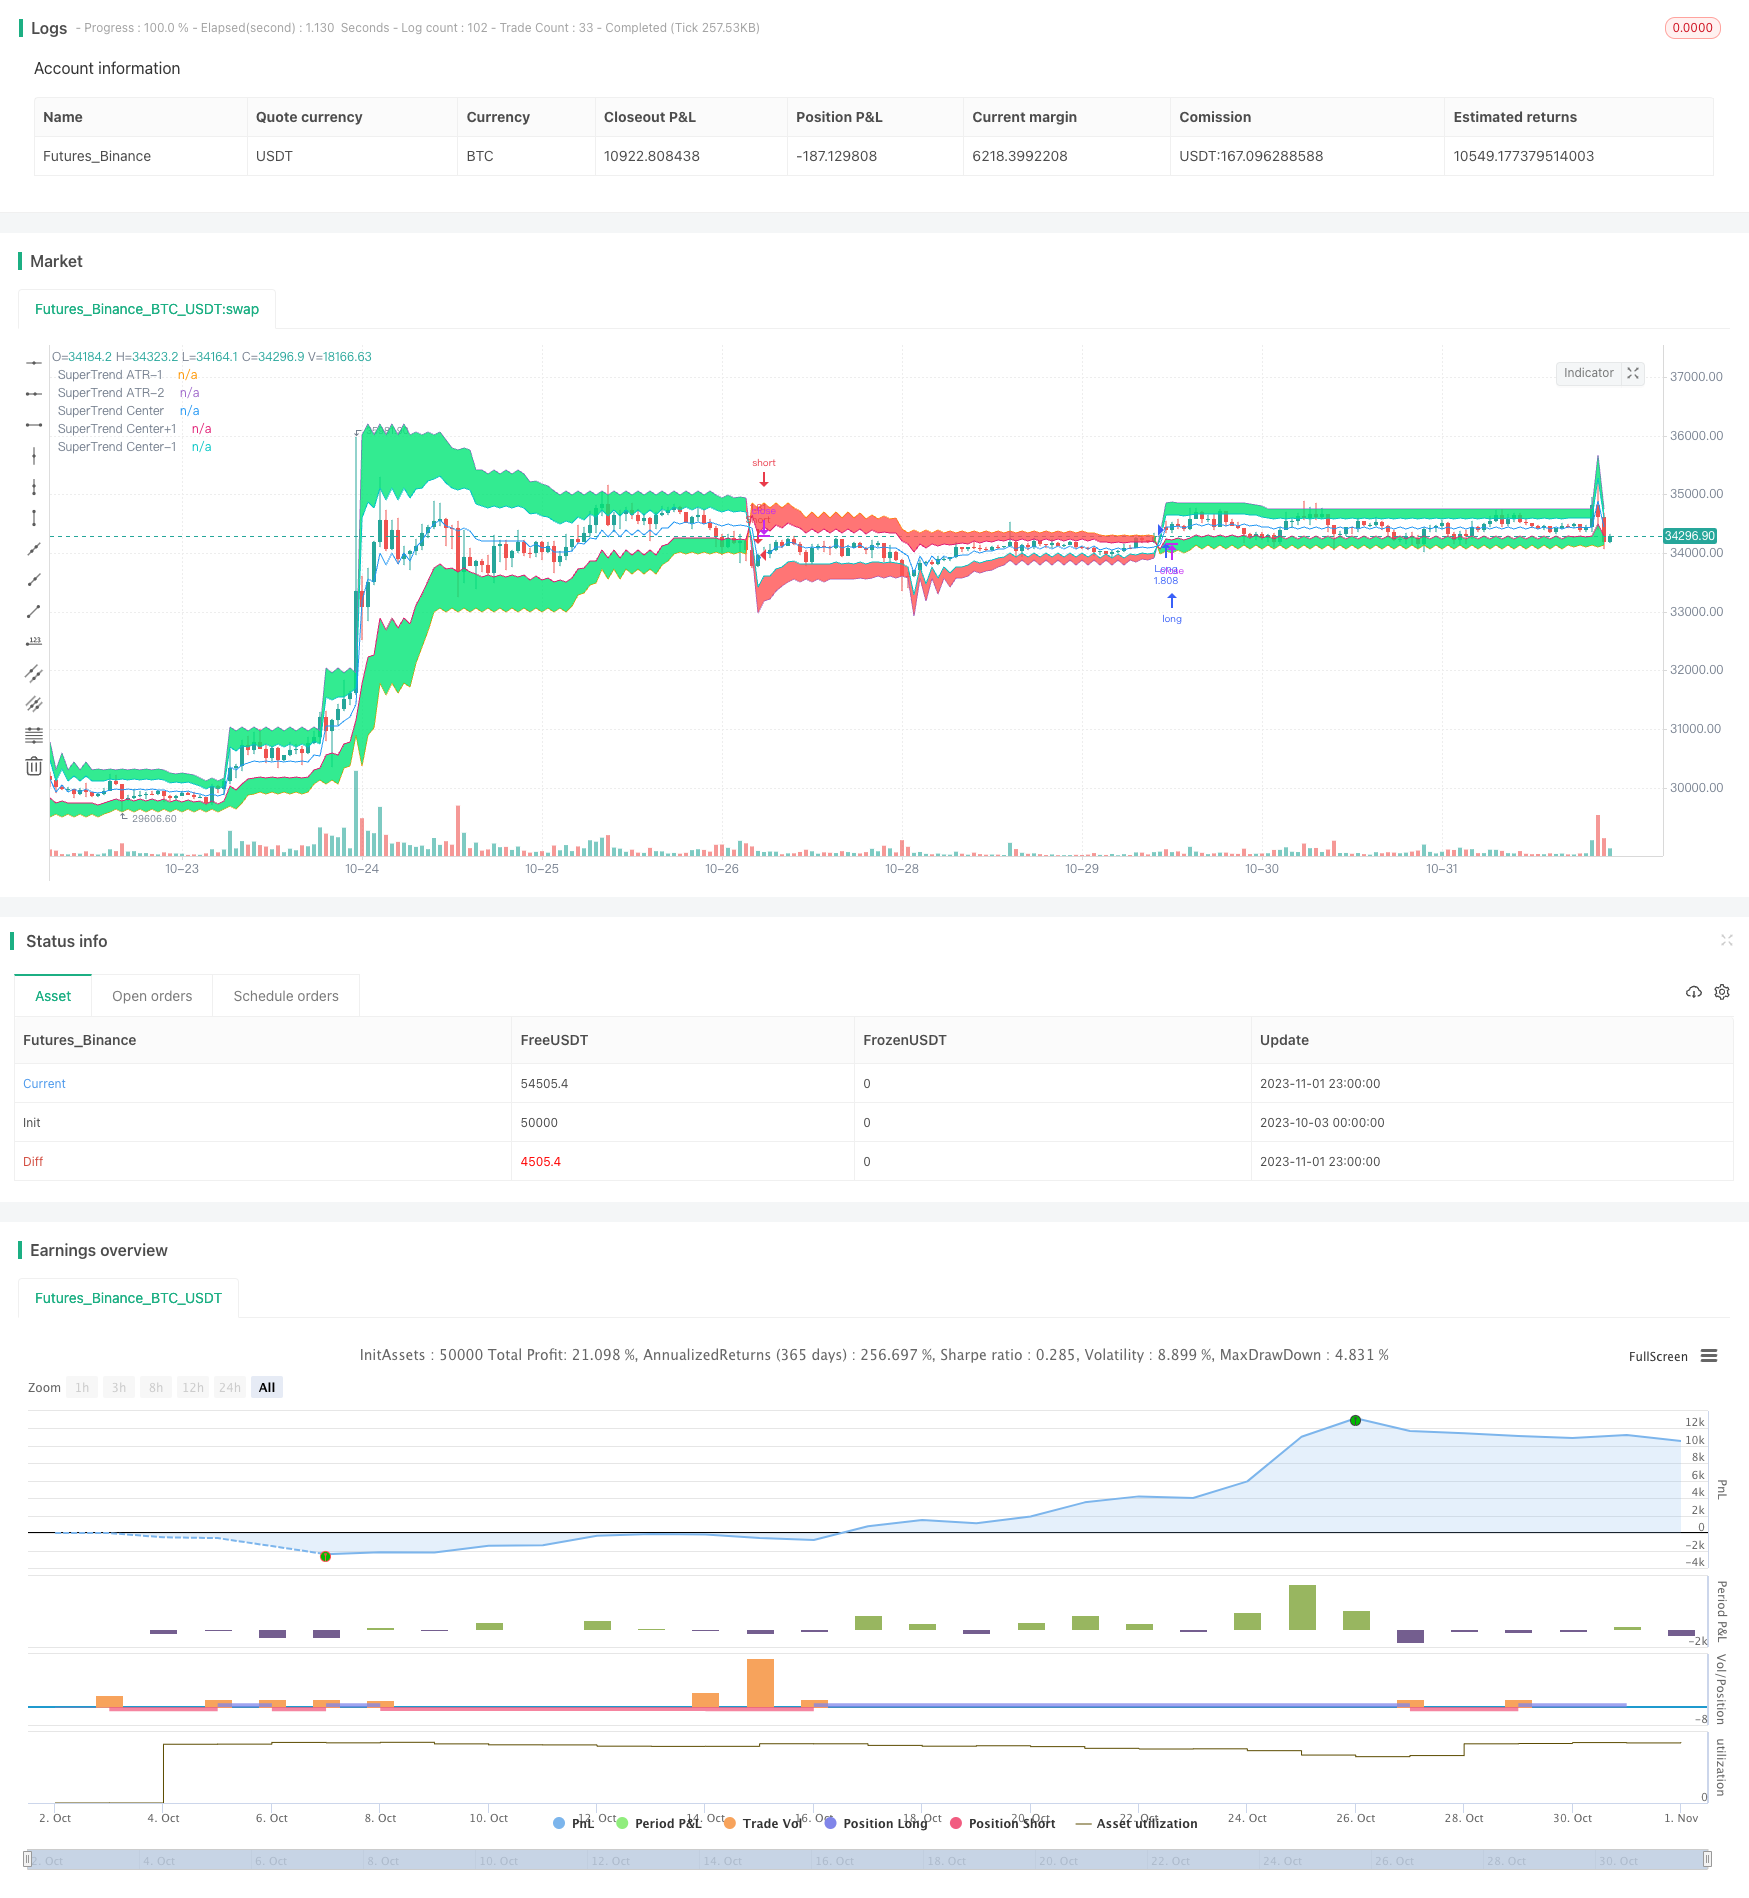
Overview
This strategy uses the Super Trend indicator to assist in placing orders, and filters by cloud layers and candlestick colors to place limit orders for increasing profitability. Its goal is to quickly capture trends after they start, and reduce risk during consolidation.
Strategy Logic
Calculate the average of highest and lowest prices within ATR period as the baseline.
Calculate the upper and lower bands based on the Factor multiplier.
When close is above upper band, mark as 1; below lower band, mark as -1. Otherwise, maintain previous state.
Dynamically adjust stop loss line based on close price's position relative to upper/lower bands.
Calculate cloud layer range based on a certain percentage of upper/lower band interval.
For long, need close < open when Super Trend is 1. For short, need close > open when Super Trend is -1.
Place limit buy orders at previous bar's close price for long. Place limit sell orders for short.
Filter by time range, close all positions available.
Advantage Analysis
This strategy combines Super Trend and cloud concept, which allows fast trend capturing after trend starts. Super Trend stop loss responds faster than normal moving stop loss. Cloud layers avoid losses from false breakouts. Limit orders reduce slippage and increase profitability. The main advantages are:
Super Trend is sensitive and tracks trends strongly.
Cloud layers filter reduces losses from false breakouts.
Candlestick color helps avoid reversals.
Limit orders decrease slippage impact and increase win rate.
Customizable time range and position management suit different trading needs.
Risk Analysis
There are also some risks to note:
Improper Super Trend parameters may cause too much sensitivity and whipsaws.
Excessive cloud range may filter out valid breakout signals, impacting profitability.
Limit orders may not get filled during high volatility, missing opportunities.
No stop loss can fully avoid systemic risk and huge losses.
Larger position sizes also amplify losses. Need to control risks.
Optimization Directions
This strategy can be improved in the following aspects:
Test different markets and instruments for optimal Super Trend parameters.
Dynamically adjust stop loss level based on market volatility.
Optimize cloud range to balance noise filtering and signal retention.
Add position sizing module to dynamically size positions based on market conditions.
Use different parameter sets for different trading sessions to adapt to market rhythms.
Test effectiveness when combining with other indicators.
Conclusion
In conclusion, this strategy has clear logic and obvious advantage in trend catching. But no strategy can completely avoid systemic risks. Need to control position sizing, keep optimizing to minimize risks in live trading, and maximize the edge. This strategy has great potential for further testing and enhancements to adapt to evolving market dynamics.
Parameters
| Name | Default | What it controls |
|---|---|---|
| v_input_1 | true | Long |
| v_input_2 | true | Short |
| v_input_3 | 100 | Lot, % |
| v_input_4 | 25 | cloud, % of ATR |
| v_input_5 | 3 | Super Trend |
| v_input_6 | 7 | ATR |
| v_input_7 | true | need center of ATR? |
| v_input_8 | false | need border? |
| v_input_9 | 1900 | From Year |
| v_input_10 | 2100 | To Year |
| v_input_11 | true | From Month |
| v_input_12 | 12 | To Month |
| v_input_13 | true | From day |
| v_input_14 | 31 | To day |
Source Pine Script
/*backtest
start: 2023-10-03 00:00:00
end: 2023-11-02 00:00:00
period: 1h
basePeriod: 15m
exchanges: [{"eid":"Futures_Binance","currency":"BTC_USDT"}]
*/

//Noro
//2018

//@version=2
strategy("Noro's SuperTrend Strategy v2.0 Limit", shorttitle = "STL str", overlay = true, default_qty_type = strategy.percent_of_equity, default_qty_value = 100, pyramiding = 0)

//Settings
needlong = input(true, defval = true, title = "Long")
needshort = input(true, defval = true, title = "Short")
capital = input(100, defval = 100, minval = 1, maxval = 10000, title = "Lot, %")
cloud = input(25, defval = 25, minval = 5, maxval = 50, title = "cloud, % of ATR")
Factor = input(title = "Super Trend", defval = 3, minval = 1, maxval = 100)
ATR = input(title = "ATR", defval = 7, minval = 1,maxval = 100)
centr = input(true, defval = true, title = "need center of ATR?")
border = input(false, defval = false, title = "need border?")
fromyear = input(1900, defval = 1900, minval = 1900, maxval = 2100, title = "From Year")
toyear = input(2100, defval = 2100, minval = 1900, maxval = 2100, title = "To Year")
frommonth = input(01, defval = 01, minval = 01, maxval = 12, title = "From Month")
tomonth = input(12, defval = 12, minval = 01, maxval = 12, title = "To Month")
fromday = input(01, defval = 01, minval = 01, maxval = 31, title = "From day")
today = input(31, defval = 31, minval = 01, maxval = 31, title = "To day")

//Super Trend ATR 1
src = close
Up=hl2-(Factor*atr(ATR))
Dn=hl2+(Factor*atr(ATR))
TUp=close[1]>TUp[1]? max(Up,TUp[1]) : Up
TDown=close[1]<TDown[1]? min(Dn,TDown[1]) : Dn
Trend = close > TDown[1] ? 1: close< TUp[1]? -1: nz(Trend[1],1)
Tsl1 = Trend==1? TUp: TDown
Tsl2 = Trend==1? TDown: TUp
limit = (Tsl1 - Tsl2) / 100 * cloud
upcloud = Tsl1 - limit
dncloud = Tsl2 + limit

//Cloud
linecolor = Trend == 1 ? green : red
centercolor = centr == true ? blue : na
cloudcolor = Trend == 1 ? green : red
cline = (Tsl1 + Tsl2) / 2
P1 = plot(Tsl1, color = border == false ? na : linecolor , style = line , linewidth = 1,title = "SuperTrend ATR-1")
P2 = plot(Tsl2, color = border == false ? na : linecolor , style = line , linewidth = 1,title = "SuperTrend ATR-2")
P3 = plot(cline, color = centercolor , style = line , linewidth = 1,title = "SuperTrend Center")
P4 = plot(upcloud, color = border == false ? na : linecolor , style = line , linewidth = 1,title = "SuperTrend Center+1")
P5 = plot(dncloud, color = border == false ? na : linecolor , style = line , linewidth = 1,title = "SuperTrend Center-1")
fill(P1, P4, color = linecolor == red ? red : lime, transp = 50)
fill(P2, P5, color = linecolor == red ? red : lime, transp = 50)

//Signals
up = 0.0
dn = 0.0
up := Trend != 1 ? 0 : Trend == 1 and close < open ? close : up[1]
dn := Trend != -1 ? close * 1000 : Trend == -1 and close > open ? close : dn[1]

//Trading
size = strategy.position_size
lot = 0.0
lot := size != size[1] ? strategy.equity / close * capital / 100 : lot[1]
if true
    strategy.entry("Long", strategy.long, needlong ? lot : 0, limit = up, when = (Trend == 1 and time > timestamp(fromyear, frommonth, fromday, 00, 00) and time < timestamp(toyear, tomonth, today, 23, 59)))
    strategy.entry("Short", strategy.short, needshort ? lot : 0, limit = dn, when = (Trend == -1 and time > timestamp(fromyear, frommonth, fromday, 00, 00) and time < timestamp(toyear, tomonth, today, 23, 59)))

if time > timestamp(toyear, tomonth, today, 23, 59)
strategy.close_all()Published by ChaoZhang on the FMZ strategy square · last modified 2023-11-03. Collected in the Quant Trading Vault. Unvalidated research: re-test with your own data and costs before trusting it.
Build this with AgenKit
A spec is not a trading system. Paste this into your coding agent and AgenKit runs a specialist team — architecture, test-first build, risk gates, review — with paper trading on by default.
/agenkit build a production-grade trading bot with a backtest engine, risk controls and paper trading by default from strategies/Beyond-The-Clouds-Strategy.md- npx agenkit install engineering-kit in your project
- Paste the command into your agent and approve each phase
- Get tests, backtest, risk controls and a paper-trading switch
Understand it first
Before you run this, read the lesson behind the idea and how to backtest it honestly. Specs like this one are the survivors of an unknown number of trials; deflate their results accordingly.
Related specs
- Momentum Breakout Trading Strategy 440964Pine Script · Breakout · 5m
- Quantitative Trading Strategy Based on Ichimoku with Multiple SignalsPine Script · Breakout · 1h
- Moonshot Dual Triangle Breakout StrategyPine Script · Breakout · 10m
- Dual MA Indicator Oscillating Price Tracking StrategyPine Script · Breakout · 2h
- Dual Moving Average Oscillation Breakthrough StrategyPine Script · Breakout · 1d
- Intraday Trend Breakout StrategyPine Script · Breakout · 1h