Strategy vault / Trend following
Bilinear Regression Trend Following Strategy
The Bilinear Regression Trend Following strategy uses the difference between fast and slow linear regression to determine price trends and uses it as entry signals. It goes long when the fast linear regression…
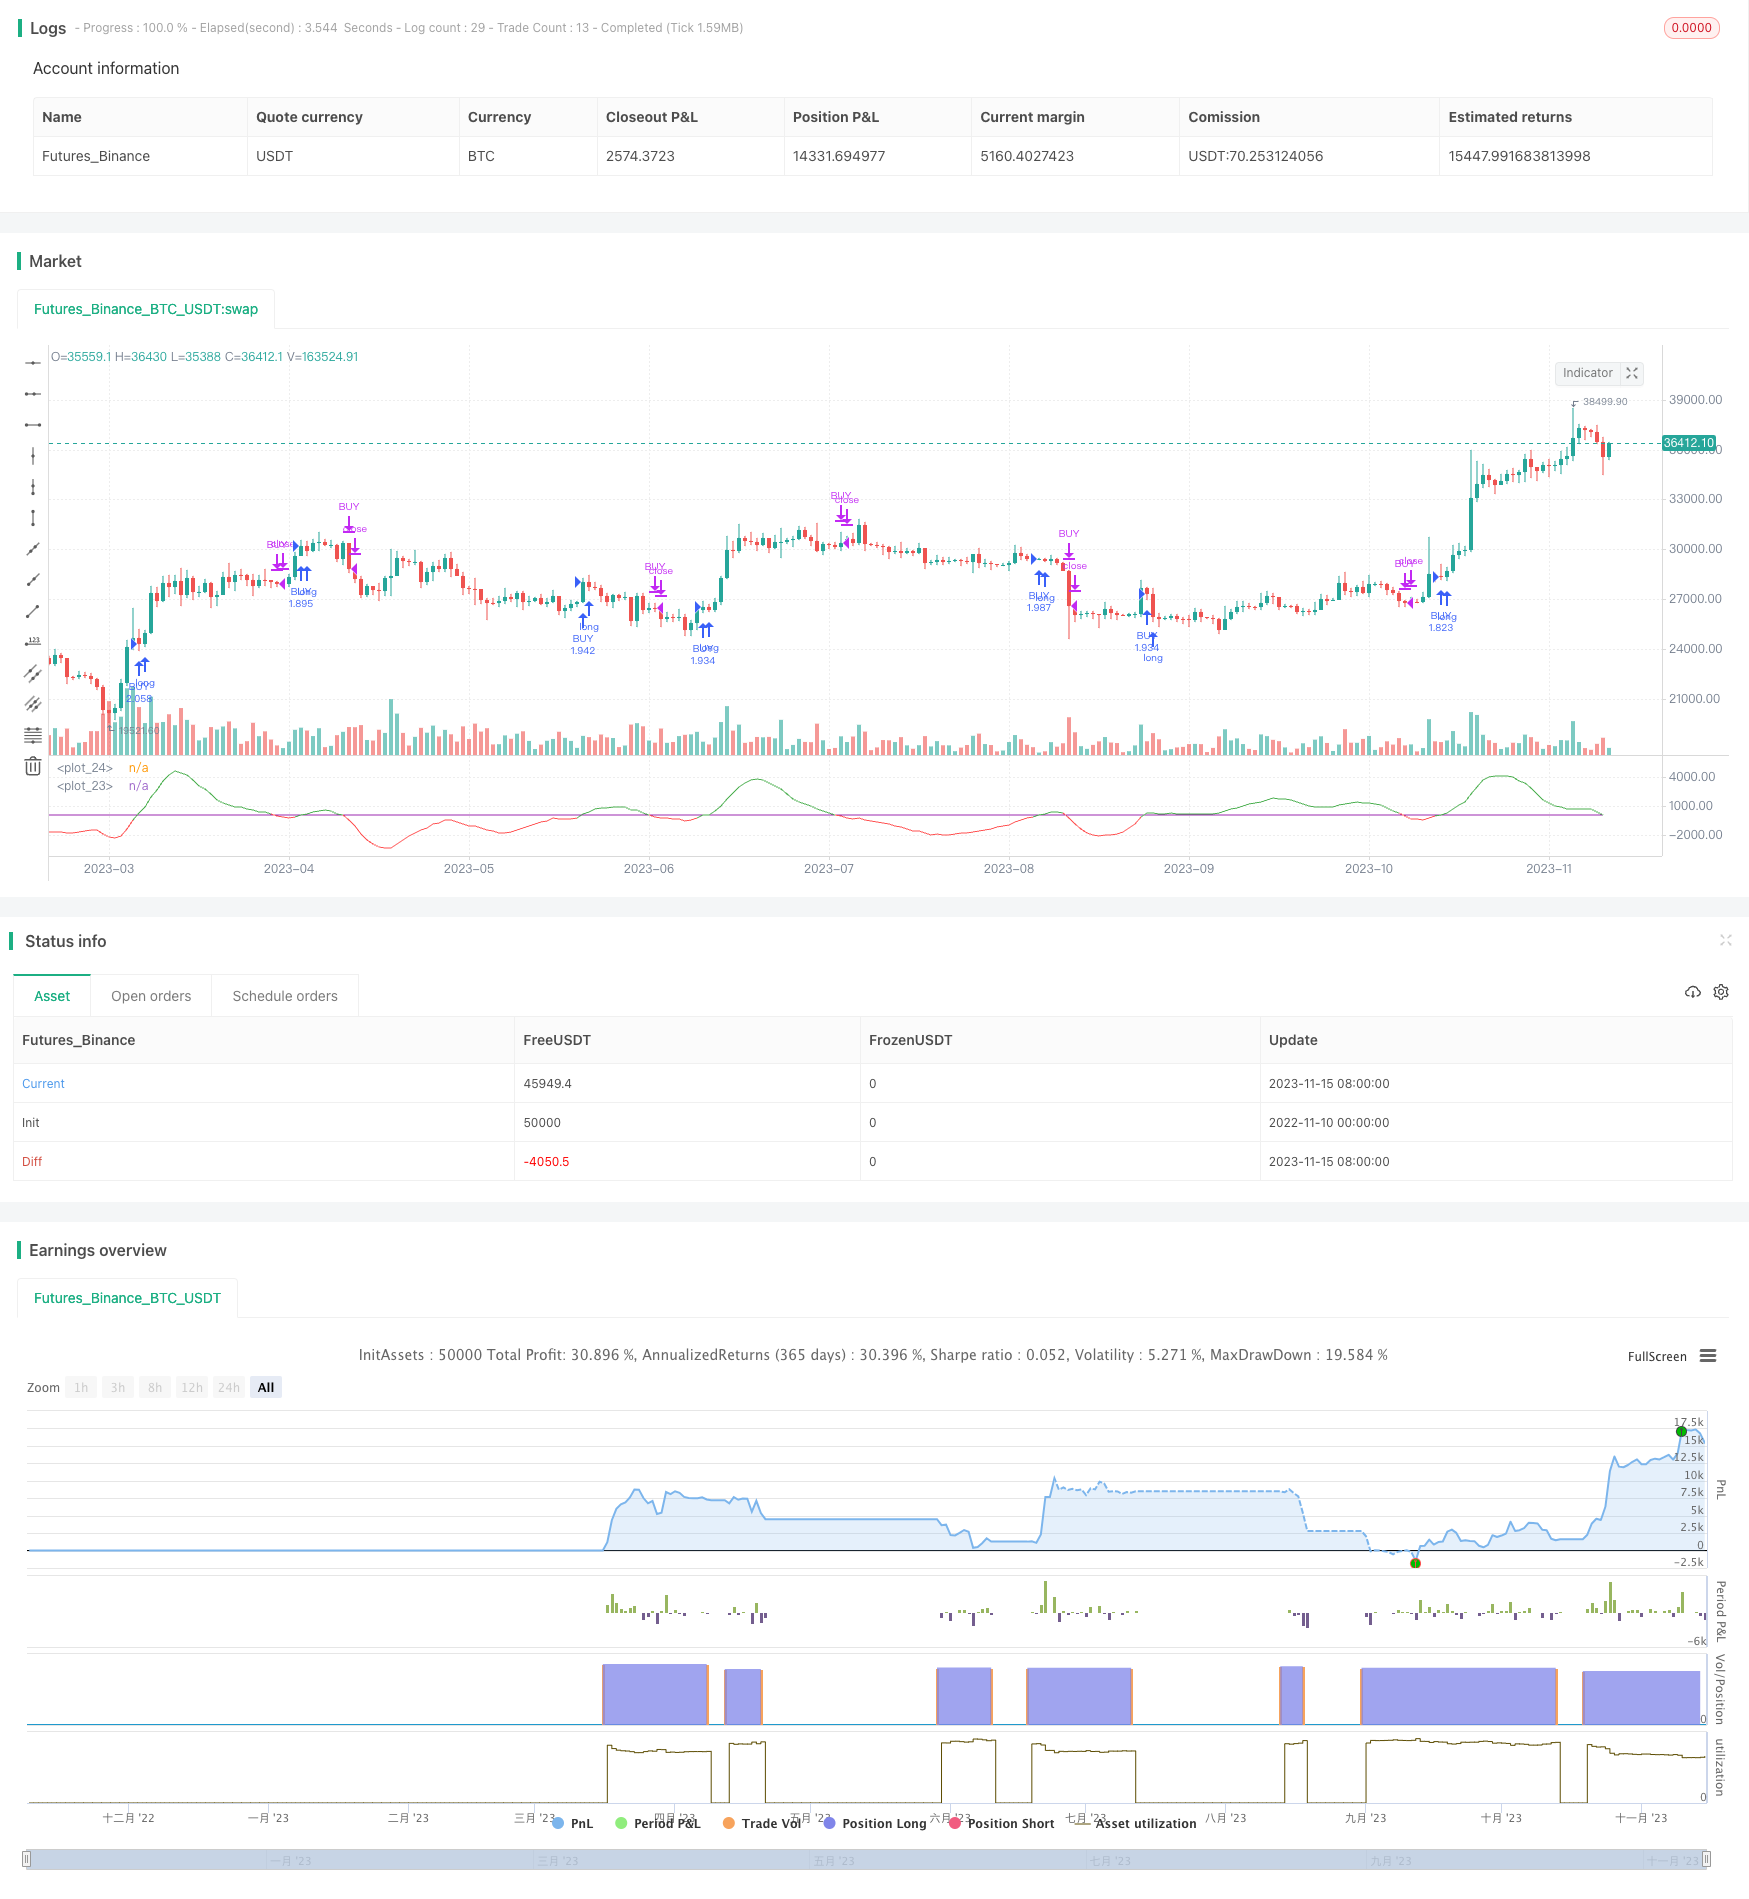
Overview
The Bilinear Regression Trend Following strategy uses the difference between fast and slow linear regression to determine price trends and uses it as entry signals. It goes long when the fast linear regression crosses above the threshold and exits when it crosses below. It also uses EMA as a filter to only enter when price is above EMA.
Strategy Logic
The strategy first calculates two linear regression lines with different periods, one fast with shorter period and one slow with longer period. Then it calculates the difference between the two, when fast regression is above slow regression, the difference is positive, indicating an uptrend. When fast is below slow, the difference is negative, indicating a downtrend.
The strategy enters long when the difference line crosses above the threshold and exits when it crosses below. It also requires price to be above 200-period EMA to filter out non-trending moves.
Advantage Analysis
Dual linear regression can capture price trends well.
EMA filter eliminates some false signals from non-trending moves.
Simple and clear logic, easy to understand and implement.
Risk Analysis
Improper LR periods may generate excessive noise.
EMA filter may miss opportunities in strong trends.
Prone to whipsaws and losses in ranging markets.
Solutions:
Optimize LR periods to reduce noise.
Dynamically adjust EMA period based on market conditions.
Add stop loss to control losses.
Optimization
The strategy can be optimized in the following aspects:
Optimize fast and slow LR periods to find best combination.
Try other filters like Bollinger Bands, KDJ instead of EMA.
Add dynamic stop loss to control risks.
Combine with stock picking to select trending stocks.
Develop adaptive parameters based on market conditions.
Summary
The Bilinear Regression strategy is simple and direct in capturing trends with dual linear regression and EMA filter. But it also has risks that need to be addressed through parameter optimization, stop loss, etc. When properly tuned, it can effectively trade trending markets.
Parameters
| Name | Default | What it controls |
|---|---|---|
| v_input_1 | 2017 | Start Year |
| v_input_2 | 12 | Month |
| v_input_3 | 17 | Day |
| v_input_4 | 9999 | End Year |
| v_input_5 | true | Month |
| v_input_6 | true | Day |
| v_input_7 | 13 | Fast LR |
| v_input_8 | 55 | Slow LR |
| v_input_9 | false | Lag for fast |
| v_input_10 | false | Lag for slow |
| v_input_11 | false | Threshold |
Source Pine Script
/*backtest
start: 2022-11-10 00:00:00
end: 2023-11-16 00:00:00
period: 1d
basePeriod: 1h
exchanges: [{"eid":"Futures_Binance","currency":"BTC_USDT"}]
*/

// This source code is subject to the terms of the Mozilla Public License 2.0 at https://mozilla.org/MPL/2.0/
// © TradingAmmo

//@version=4
strategy("Linear trend", overlay=false, default_qty_type=strategy.percent_of_equity, default_qty_value=100, commission_type=strategy.commission.percent, commission_value=0.075, currency='USD')
startP = timestamp(input(2017, "Start Year"), input(12, "Month"), input(17, "Day"), 0, 0)
end   = timestamp(input(9999, "End Year"),   input(1, "Month"),   input(1, "Day"),   0, 0)
_testPeriod() =>
    iff(time >= startP and time <= end, true, false)

src = close
len1 = input(defval=13, minval=1, title="Fast LR")
len2 = input(defval=55, minval=1, title="Slow LR")

lag1 = input(0, title="Lag for fast")
lag2 = input(0, title="Lag for slow")

threshold  = input(0,step=0.5, title="Threshold")

fast_lr = linreg(src, len1, lag1)
slow_lr = linreg(src, len2, lag2)
lr = fast_lr - slow_lr
plot_fast = plot(lr, color = lr > 0 ? color.green : color.red)
plot(threshold, color=color.purple)

long_condition = crossover(lr, threshold) and close > ema(close, 200) and _testPeriod()
strategy.entry('BUY', strategy.long, when=long_condition)

short_condition = crossunder(lr, threshold)
strategy.close('BUY', when=short_condition)
Published by ChaoZhang on the FMZ strategy square · last modified 2023-11-17. Collected in the Quant Trading Vault. Unvalidated research: re-test with your own data and costs before trusting it.
Build this with AgenKit
A spec is not a trading system. Paste this into your coding agent and AgenKit runs a specialist team — architecture, test-first build, risk gates, review — with paper trading on by default.
/agenkit build a production-grade trading bot with a backtest engine, risk controls and paper trading by default from strategies/Bilinear-Regression-Trend-Following-Strategy.md- npx agenkit install engineering-kit in your project
- Paste the command into your agent and approve each phase
- Get tests, backtest, risk controls and a paper-trading switch
Understand it first
Before you run this, read the lesson behind the idea and how to backtest it honestly. Specs like this one are the survivors of an unknown number of trials; deflate their results accordingly.
Related specs
- ATR and Moving Average Crossover Hybrid StrategyPine Script · Trend following · 1h
- Bollinger Band Moving Average Crossover StrategyPine Script · Trend following · 1h
- Bollinger Bands and EMA Trend Following StrategyPine Script · Trend following · 1h
- Bollinger Bands and RSI Trend Following StrategyPine Script · Trend following · 1h
- Dual Moving Average Crossover Dynamic Position Optimization Strategy with EMA Cross Signal SystemPine Script · Trend following · 1h
- EMA Cross Trend Following Strategy with SMA Stop Loss and Re Entry MechanismPine Script · Trend following · 1h