Bollinger Band Momentum Breakout Trading Strategy
This strategy combines Bollinger Band indicator and volume indicators to identify strong momentum breakout opportunities above Bollinger upper band when trading volume is high, and enters long positions. It also uses…
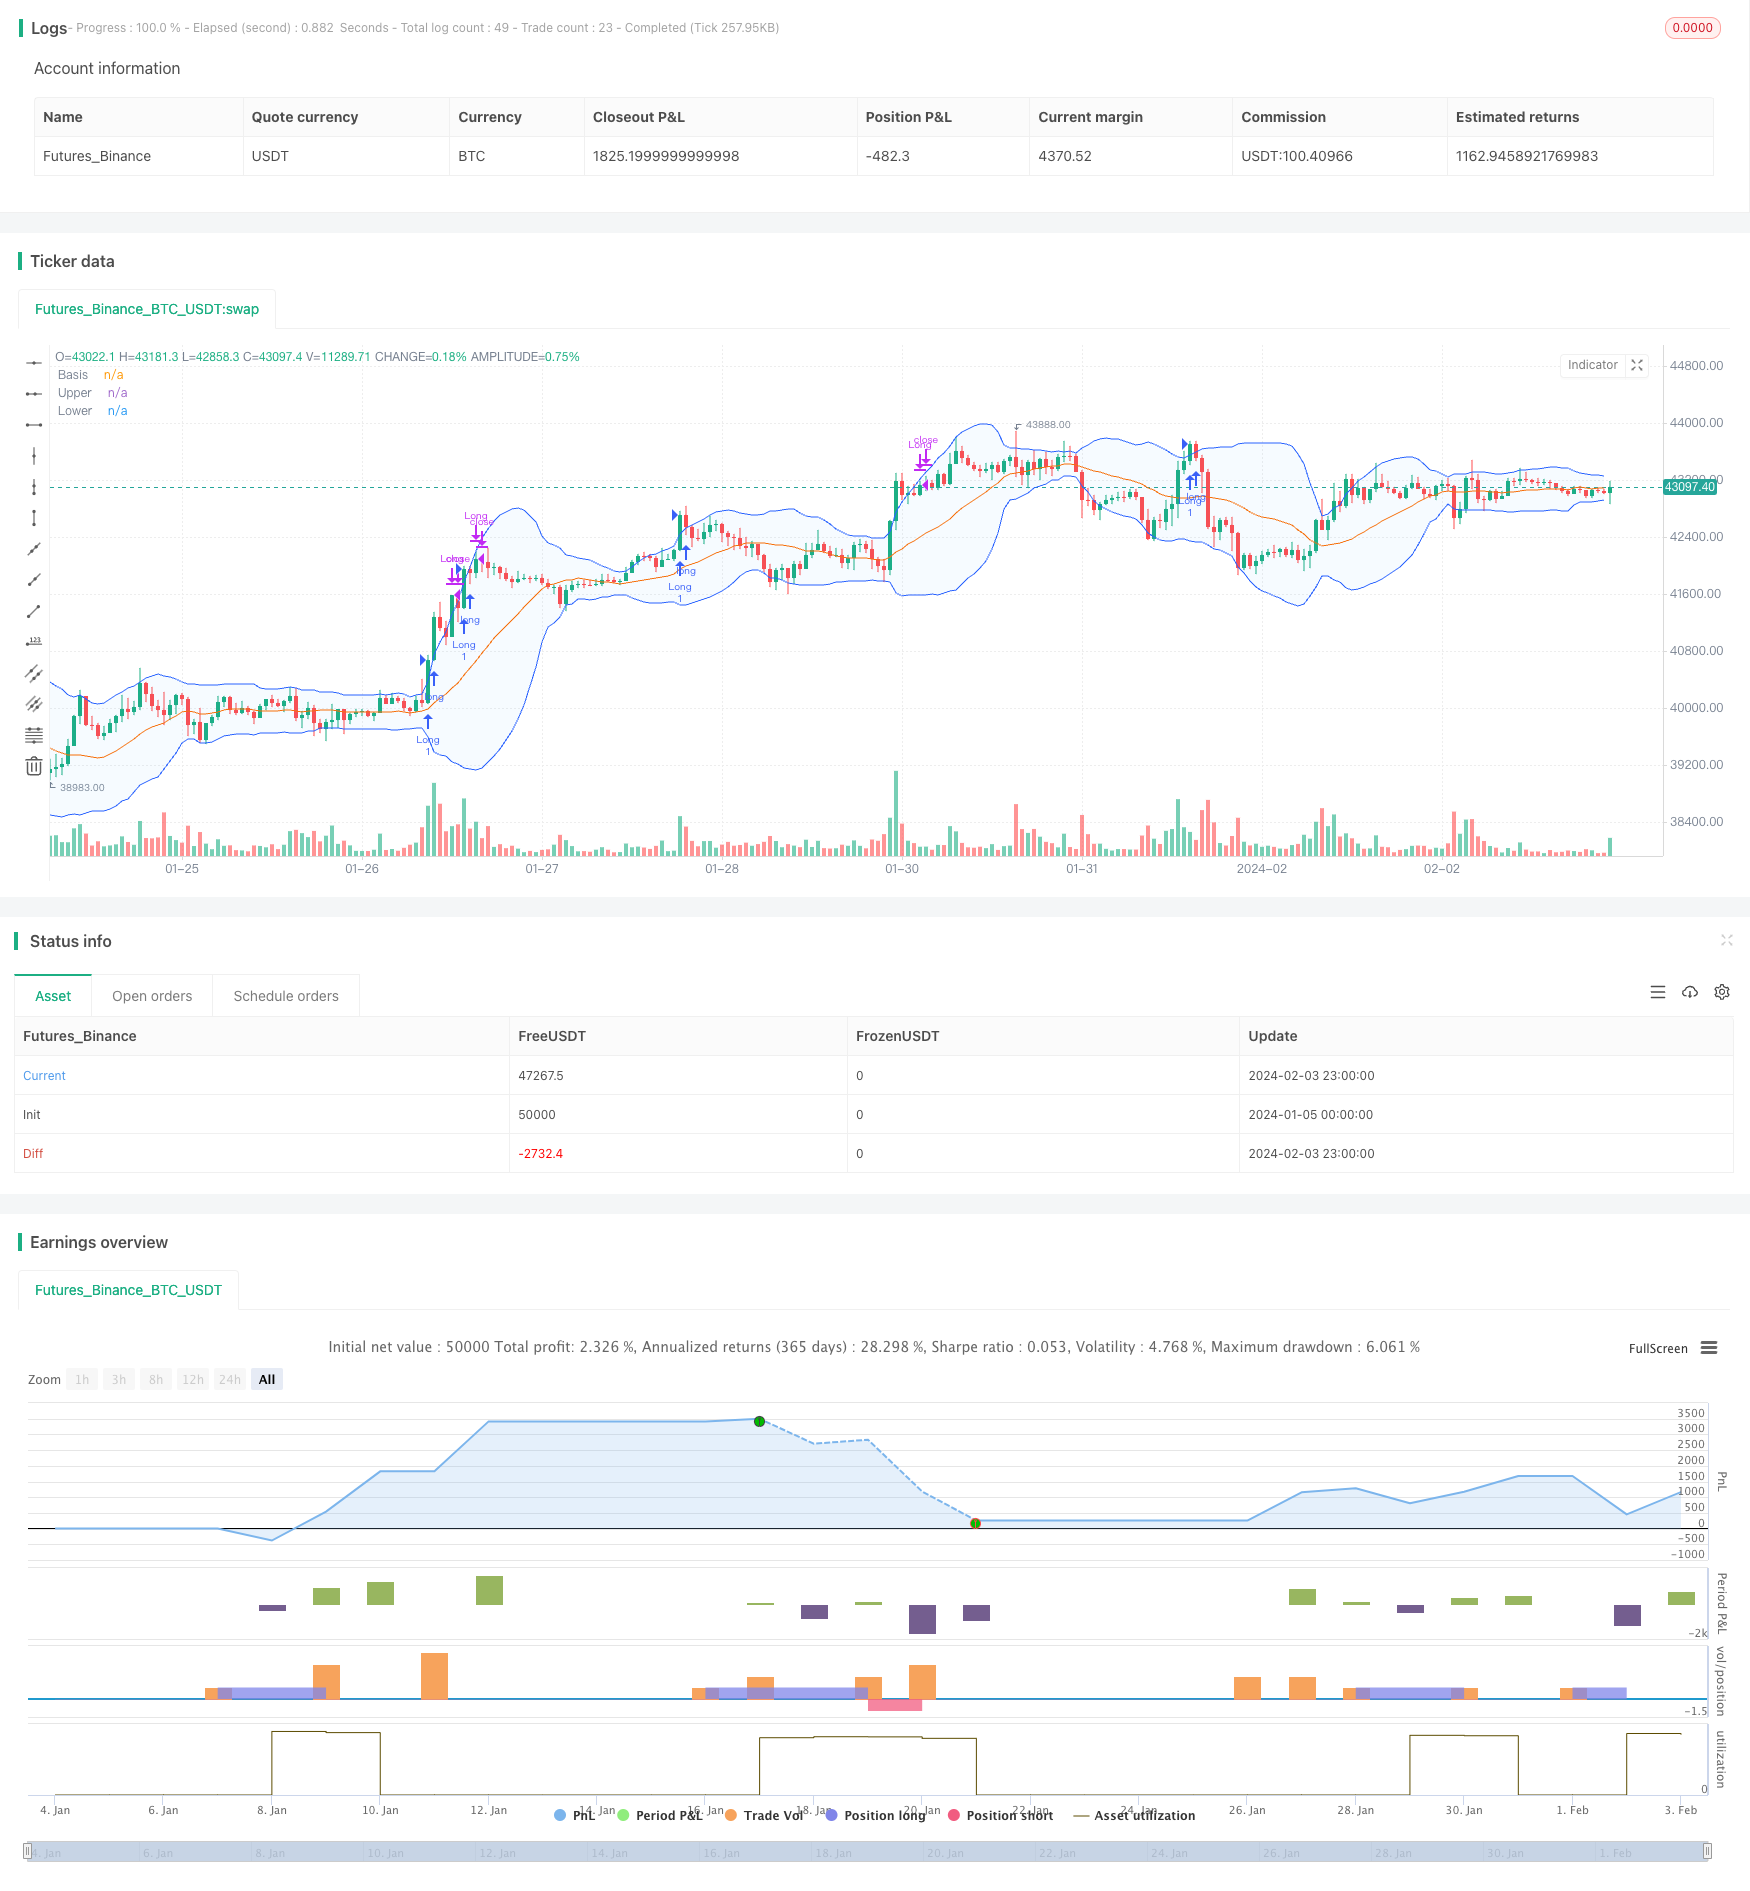
Overview
This strategy combines Bollinger Band indicator and volume indicators to identify strong momentum breakout opportunities above Bollinger upper band when trading volume is high, and enters long positions. It also uses moving average indicators to determine trend direction and reduce the risk of holding dead positions.
Strategy Logic
- Use Bollinger Band indicator to determine if price breaks out above the upper band.
- Use trading volume indicators to determine if current volume is significantly higher than past period average.
- Enter long position when trading volume is high and price breaks out above Bollinger upper band.
- Use moving average indicators to determine short term and medium term trend to cut loss in time.
This strategy mainly considers three factors: price level, momentum and trend. When price breaks out the Bollinger upper band into the buy zone, surge in trading volume indicates strong momentum and capital inflow. This is the right timing to enter long position. Then it uses moving averages to determine market trend to avoid holding dead positions. By combining price action, momentum and risk control, it aims to capture profits from strong trends.
Advantages
Accurate signals, avoids false breakout. Combining volume filter, it only buys on real strong momentum, reducing risk.
Able to cut loss in time via moving average trend determination, reducing holding loss.
Implemented quantitative strategy combining multiple indicators for decision making. Flexible parameters tuning for different products and timeframes.
Clear code structures, easy to read and maintain. Modular design of indicators calculation, signal generation and position management.
Risks
Bollinger Bands could fail during extreme price swings, missing signals or generating false signals.
No profits when overall trading volume is low. Buy signals may not be profitable without enough trading volume.
Moving averages trend determination could also fail, unable to fully ensure effective stop loss.
Improper parameter tuning also affects strategy profitability. For example, trading time window set too short may miss trend reversal.
Optimization Directions
Add more technical indicators for better trend and support/resistance analysis, improving stop loss, e.g. candlestick patterns, channels, key support levels.
Add machine learning models to judge real breakout possibilities, reducing false signals. e.g. LSTM deep learning models.
Optimize capital management strategies like dynamic position sizing, trailing stop loss to reduce single trade loss impact.
Test more products and timeframes, adjust parameters like Bollinger Bands, volume window to improve strategy robustness.
Conclusion
This strategy integrates Bollinger Band and trading volume indicators to identify strong momentum buying opportunities, with moving averages ensuring effective stop loss. Compared to single indicator strategies, it has higher accuracy and risk control capabilities. With modular design, trend filters and stop loss mechanisms, it forms an easy-to-optimize momentum breakout trading strategy.
Parameters
| Name | Default | What it controls |
|---|---|---|
| v_input_1 | true | length1 |
| v_input_2 | 3 | length3 |
| v_input_3 | 7 | length7 |
| v_input_4 | 9 | length9 |
| v_input_5 | 14 | length14 |
| v_input_6 | 20 | length20 |
| v_input_7 | 60 | length60 |
| v_input_8 | 120 | length120 |
| v_input_9 | 50 | Daily MA length |
| v_input_10 | 10 | Weekly MA length |
| v_input_11 | 20 | length |
| v_input_12_close | 0 | Source: close | high | low | open | hl2 | hlc3 | hlcc4 | ohlc4 |
| v_input_13 | 2 | StdDev |
| v_input_14 | 1.5 | exp |
| v_input_15 | true | exp1 |
| v_input_16 | 2.5 | exp2 |
| v_input_17 | false | Offset |
Source Pine Script
/*backtest
start: 2024-01-05 00:00:00
end: 2024-02-04 00:00:00
period: 1h
basePeriod: 15m
exchanges: [{"eid":"Futures_Binance","currency":"BTC_USDT"}]
*/

// This source code is subject to the terms of the Mozilla Public License 2.0 at https://mozilla.org/MPL/2.0/
// © KAIST291

//@version=4
initial_capital=1000
strategy("prototype", overlay=true)
length1=input(1)
length3=input(3)
length7=input(7)
length9=input(9)
length14=input(14)
length20=input(20)
length60=input(60)
length120=input(120)
ma1= sma(close,length1)
ma3= sma(close,length3)
ma7= sma(close,length7)
ma9= sma(close,length9)
ma14=sma(close,length14)
ma20=sma(close,length20)
ma60=sma(close,length60)
ma120=sma(close,length120)
rsi=rsi(close,14)
// BUYING VOLUME AND SELLING VOLUME //
BV = iff( (high==low), 0, volume*(close-low)/(high-low))
SV = iff( (high==low), 0, volume*(high-close)/(high-low))
vol = iff(volume > 0, volume, 1)
dailyLength = input(title = "Daily MA length", type = input.integer, defval = 50, minval = 1, maxval = 100)
weeklyLength = input(title = "Weekly MA length", type = input.integer, defval = 10, minval = 1, maxval = 100)
//-----------------------------------------------------------
Davgvol = sma(volume, dailyLength)
Wavgvol = sma(volume, weeklyLength)
//-----------------------------------------------------------
length = input(20, minval=1)
src = input(close, title="Source")
mult = input(2.0, minval=0.001, maxval=50, title="StdDev")
mult2= input(1.5, minval=0.001, maxval=50, title="exp")
mult3= input(1.0, minval=0.001, maxval=50, title="exp1")
mult4= input(2.5, minval=0.001, maxval=50, title="exp2")
basis = sma(src, length)
dev = mult * stdev(src, length)
upper = basis + dev
lower = basis - dev
dev2= mult2 * stdev(src, length)
Supper= basis + dev2
Slower= basis - dev2
dev3= mult3 * stdev(src, length)
upper1= basis + dev3
lower1= basis - dev3
dev4= mult4 * stdev(src, length)
upper2=basis + dev4
lower2=basis - dev4
offset = input(0, "Offset", type = input.integer, minval = -500, maxval = 500)
plot(basis, "Basis", color=#FF6D00, offset = offset)
p1 = plot(upper, "Upper", color=#2962FF, offset = offset)
p2 = plot(lower, "Lower", color=#2962FF, offset = offset)
fill(p1, p2, title = "Background", color=color.rgb(33, 150, 243, 95))
//----------------------------------------------------
exit=(close-strategy.position_avg_price / strategy.position_avg_price*100)
bull=( BV>SV and BV>Davgvol)
bull2=(BV>SV and BV>Davgvol)
bux =(close>Supper and close>Slower and volume<Davgvol)
bear=(SV>BV and SV>Davgvol)
con=(BV>Wavgvol and rsi>80)
imInATrade = strategy.position_size != 0
highestPriceAfterEntry = valuewhen(imInATrade, high, 0)
// STRATEGY LONG //
if (bull and close>upper1 and close>Supper and high>upper and rsi<80)
    strategy.entry("Long",strategy.long)

if (strategy.position_avg_price*1.02<close)
    strategy.close("Long")
else if (low<ma9 and strategy.position_avg_price<close)
    strategy.close("Long")
else if (ma20>close and strategy.position_avg_price<close )
    strategy.close("Long")
else if (rsi>80 and strategy.position_avg_price<close)
    strategy.close("Long")
else if (strategy.openprofit < strategy.position_avg_price*0.9-close)
    strategy.close("Long")
else if (high<upper and strategy.position_avg_price<close)
    strategy.close("Long")
//////////////////////////////////////////////////////////////////////////////////

//////////////////////////////////////////////////////////////////////////////////
strategy.entry("Short",strategy.short,when=low<ma20 and low<lower1 and close<Slower and crossunder(ma60,ma120))

if (close<strategy.position_avg_price*0.98)
    strategy.close("Short")

else if (rsi<20)
    strategy.close("Short")
Published by ChaoZhang on the FMZ strategy square · last modified 2024-02-05. Collected in the Quant Trading Vault. Unvalidated research: re-test with your own data and costs before trusting it.
Build this with AgenKit
A spec is not a trading system. Paste this into your coding agent and AgenKit runs a specialist team — architecture, test-first build, risk gates, review — with paper trading on by default.
/agenkit build a production-grade trading bot with a backtest engine, risk controls and paper trading by default from strategies/Bollinger-Band-Momentum-Breakout-Trading-Strategy.md- npx agenkit install engineering-kit in your project
- Paste the command into your agent and approve each phase
- Get tests, backtest, risk controls and a paper-trading switch
Understand it first
Before you run this, read the lesson behind the idea and how to backtest it honestly. Specs like this one are the survivors of an unknown number of trials; deflate their results accordingly.
Related specs
- Multi factor Intelligent Trading StrategyPine Script · Breakout · 1d
- Dynamic Range Breakout Trading Strategy Based on Bollinger Bands and RSIPine Script · Breakout · 1d
- Bollinger Bands Dynamic Breakout StrategyPine Script · Breakout · 1h
- Momentum Breakout Moving Average StrategyPine Script · Breakout · 1d
- Moving Average Crossover and Upper Rail Breakthrough Impulse StrategyPine Script · Breakout · 1m
- Multi Indicator Momentum Breakout with Smoothed Candlestick Trading StrategyPine Script · Breakout · 6h