Bollinger Breakout Strategy
This is a breakout strategy based on the Bollinger Bands indicator. It utilizes the upper and lower bands of Bollinger Bands to generate breakout signals for entry and exit. This strategy also incorporates trailing…
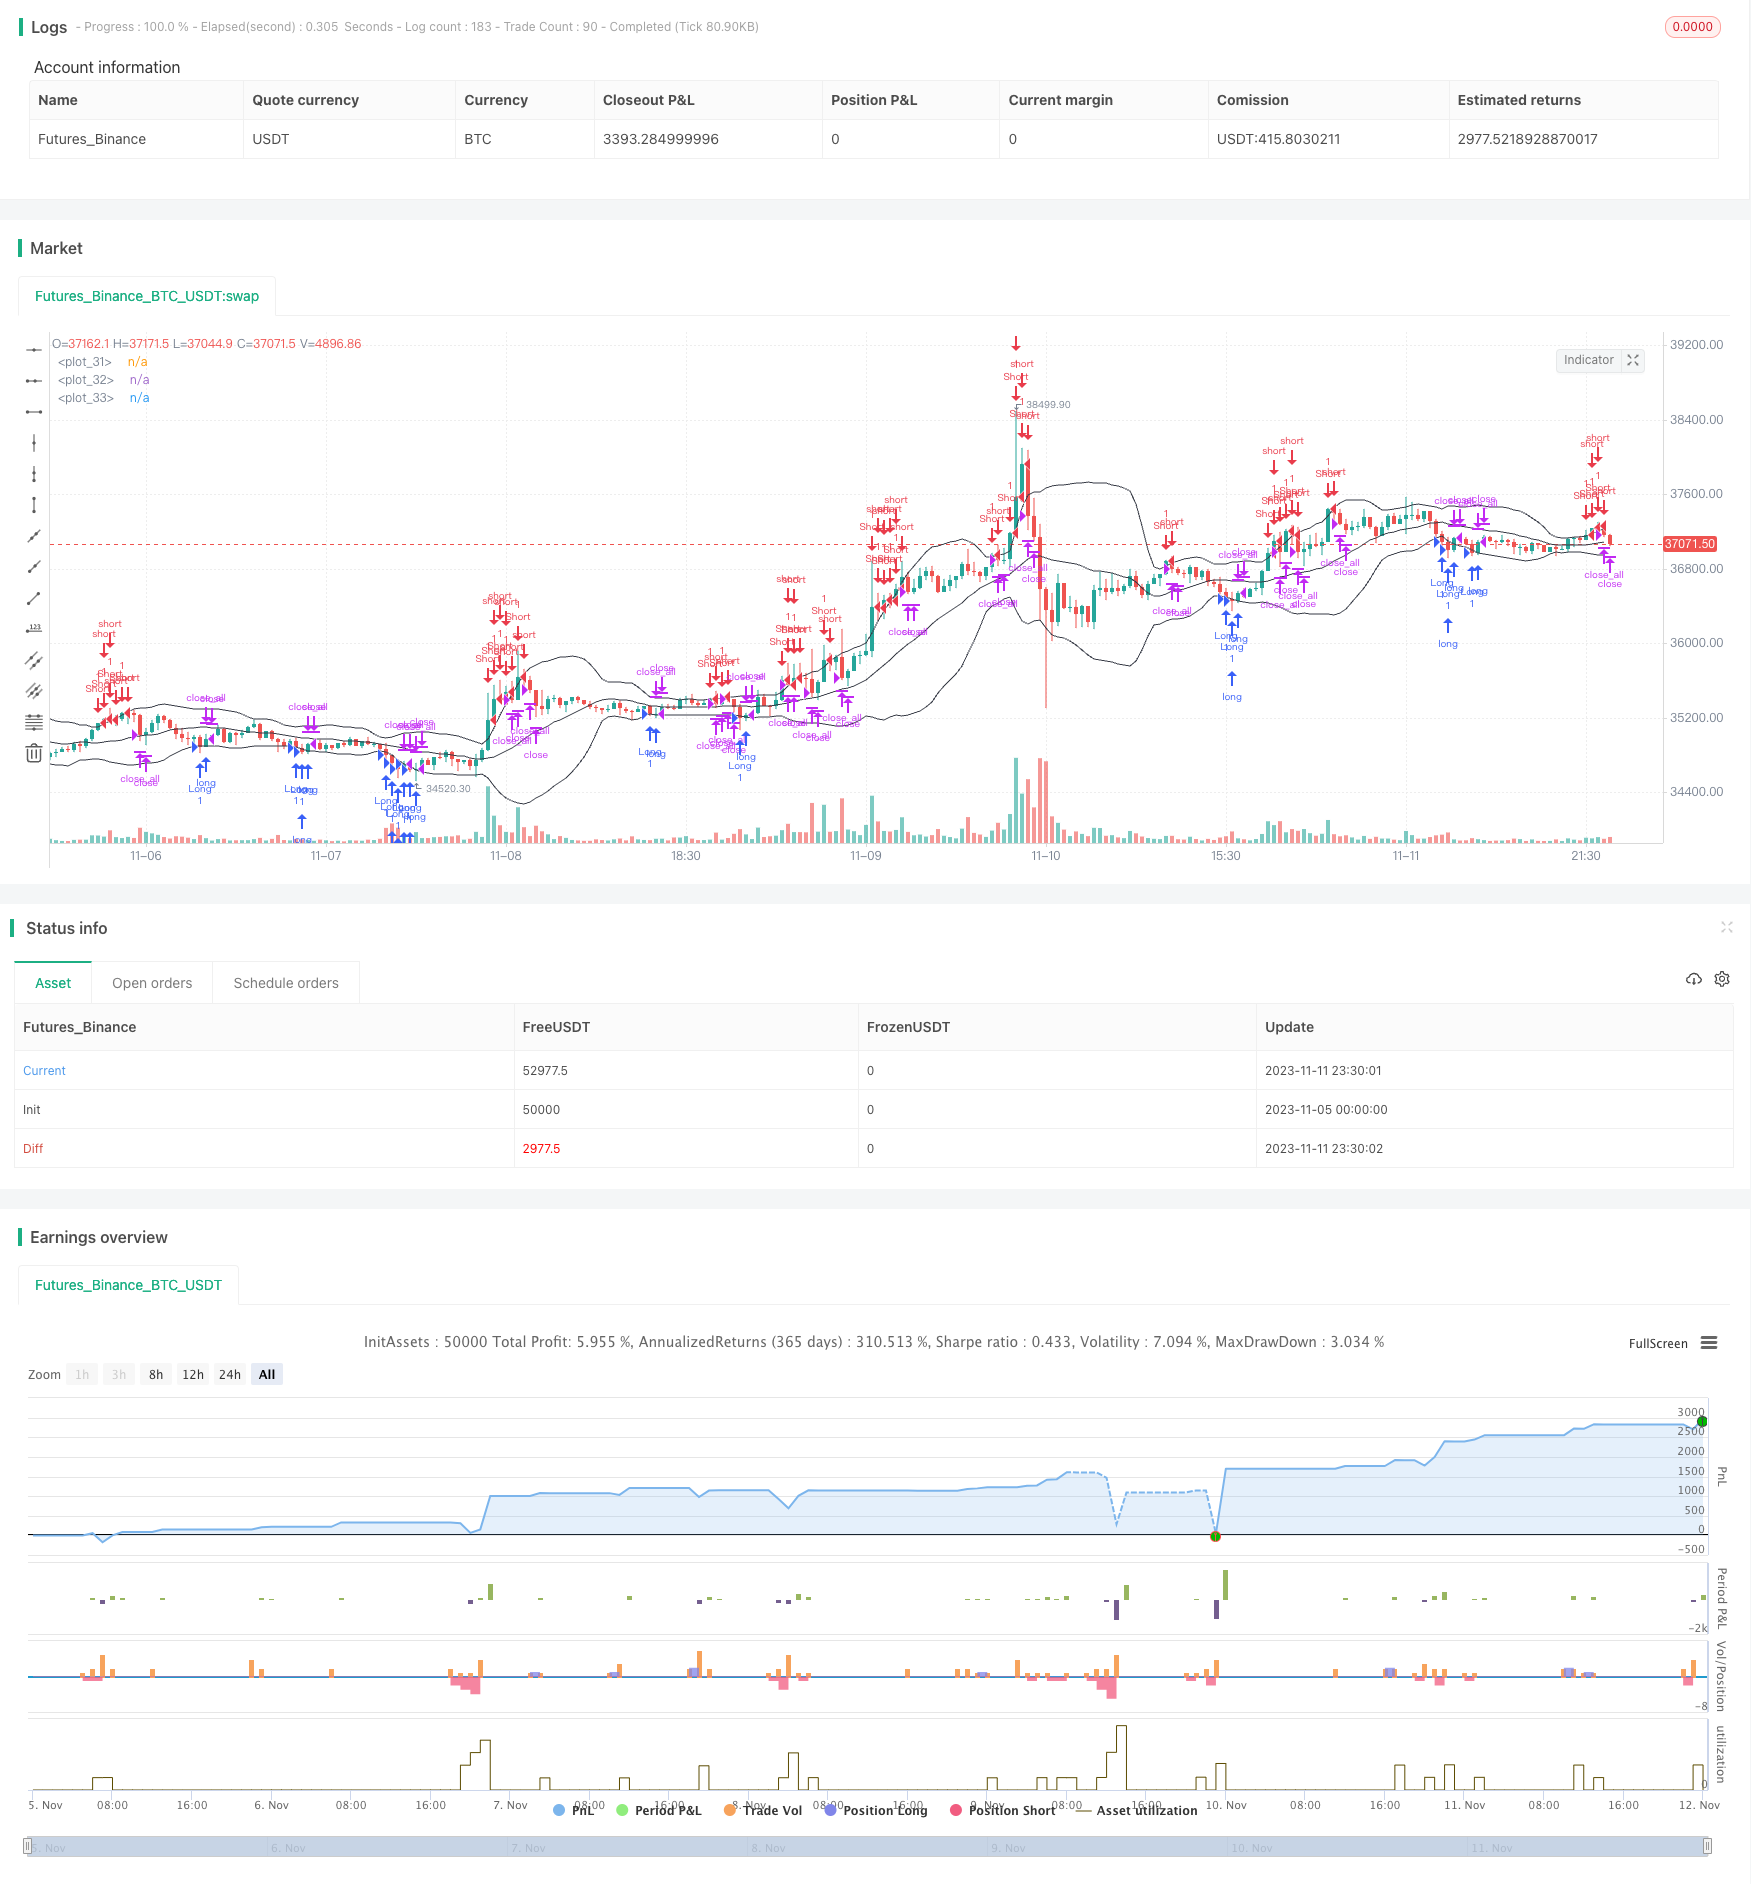
Overview
This is a breakout strategy based on the Bollinger Bands indicator. It utilizes the upper and lower bands of Bollinger Bands to generate breakout signals for entry and exit. This strategy also incorporates trailing stop loss and pyramiding mechanism to achieve higher return in trending markets.
Strategy Logic
The strategy first calculates the middle band, upper band and lower band of Bollinger Bands. The middle band is the moving average of price, while the upper and lower bands are middle band +/- one standard deviation.
When price breaks above the lower band, a long signal is generated. When price breaks below the upper band, a short signal is generated. This indicates the price is breaking out of the Bollinger Bands range and may enter a trending move.
In addition, the strategy checks for body breakout. If the close is higher than open and the body penetrates the middle band by certain percentage, it will flatten position. If close is lower than open and the body penetrates the middle band by certain percentage, it will also flatten position. This avoids losses from false breakouts.
After entering positions, the strategy can trail stop loss and pyramid. If price continues to move in favorable direction, position size can be increased to improve profit potential. If price reverses, stop loss is used to control risk.
Advantage Analysis
The advantages of this strategy are:
Utilize Bollinger Bands to determine trend direction and catch breakouts. This indicator is simple and effective.
Check body and middle band to determine breakout validity, avoiding losses from false breakouts.
Use trailing stop loss to lock in profits and control risk.
Use pyramiding to achieve higher returns in trending moves.
Clear logic and easy to understand. Simple parameters make this strategy easy to implement.
Risk Analysis
The risks of this strategy include:
Bollinger Bands breakouts cannot completely avoid false breakouts, some losses may occur.
Improper stop loss placement may cause premature stop out or fail to limit losses.
Excessive pyramiding times and size may lead to amplified losses.
Failure to timely stop out when trend reverses may lead to large drawdowns.
Insufficient parameter optimization may lead to underperformance.
Overfitting risk. Requires validation across different markets.
Optimization Directions
The strategy can be improved from the following aspects:
Test and optimize Bollinger Bands parameters to find better combinations.
Test different stop loss strategies and optimize stop loss placement.
Test and find optimal pyramiding times and size.
Add trend filter to avoid pyramiding against the trend.
Optimize body breakout logic to reduce false breakouts.
Add conditional orders to utilize different parameter sets based on market conditions.
Conduct more backtests across different products and timeframes to improve robustness.
Utilize machine learning to automatically optimize parameters.
Conclusion
In summary, this strategy utilizes Bollinger Bands to determine trend direction and catch breakouts, with additional stop loss, pyramiding and other functions to achieve good results. But risks exist, requiring parameter optimization, adding conditions etc to improve robustness. It suits investors familiar with technical analysis and can produce good returns in trending markets.
Parameters
| Name | Default | What it controls |
|---|---|---|
| v_input_1 | true | Long |
| v_input_2 | true | Short |
| v_input_3 | 20 | Bollinger Length |
| v_input_4 | 2 | Bollinger Mult |
| v_input_5_ohlc4 | 0 | Bollinger Source: ohlc4 | high | low | open | hl2 | hlc3 | hlcc4 | close |
| v_input_6 | true | Show Bollinger Bands |
| v_input_7 | 2018 | From Year |
| v_input_8 | 2100 | To Year |
| v_input_9 | true | From Month |
| v_input_10 | 12 | To Month |
| v_input_11 | true | From day |
| v_input_12 | 31 | To day |
Source Pine Script
/*backtest
start: 2023-11-05 00:00:00
end: 2023-11-12 00:00:00
period: 30m
basePeriod: 15m
exchanges: [{"eid":"Futures_Binance","currency":"BTC_USDT"}]
*/

//Noro
//2018

//@version=2
strategy("Noro's Bollinger Strategy v1.1", shorttitle = "Bollinger str 1.1", overlay = true, default_qty_type = strategy.percent_of_equity, default_qty_value = 100.0, pyramiding = 5)

//Settings
needlong = input(true, defval = true, title = "Long")
needshort = input(true, defval = true, title = "Short")

length = input(20, defval = 20, minval = 1, maxval = 1000, title = "Bollinger Length")
mult = input(2.0, minval = 0.001, maxval = 50, title = "Bollinger Mult")
source = input(ohlc4, defval = ohlc4, title = "Bollinger Source")

showbands = input(true, defval = true, title = "Show Bollinger Bands")
fromyear = input(2018, defval = 2018, minval = 1900, maxval = 2100, title = "From Year")
toyear = input(2100, defval = 2100, minval = 1900, maxval = 2100, title = "To Year")
frommonth = input(01, defval = 01, minval = 01, maxval = 12, title = "From Month")
tomonth = input(12, defval = 12, minval = 01, maxval = 12, title = "To Month")
fromday = input(01, defval = 01, minval = 01, maxval = 31, title = "From day")
today = input(31, defval = 31, minval = 01, maxval = 31, title = "To day")

//Bollinger Bands
basis = sma(source, length)
dev = mult * stdev(source, length)
upper = basis + dev
lower = basis - dev

//Lines
col = showbands ? black : na
plot(upper, linewidth = 1, color = col)
plot(basis, linewidth = 1, color = col)
plot(lower, linewidth = 1, color = col)

//Body
body = abs(close - open)
abody = ema(body, 30)

//Signals
up = close <= lower
dn = close >= upper
exit = (strategy.position_size > 0 and close > open) or (strategy.position_size < 0 and close < open) and body > abody / 2

//Trading
if up
    strategy.entry("Long", strategy.long, needlong == false ? 0 : na, when=(time > timestamp(fromyear, frommonth, fromday, 00, 00) and time < timestamp(toyear, tomonth, today, 00, 00)))

if dn
    strategy.entry("Short", strategy.short, needshort == false ? 0 : na, when=(time > timestamp(fromyear, frommonth, fromday, 00, 00) and time < timestamp(toyear, tomonth, today, 00, 00)))

if time > timestamp(toyear, tomonth, today, 00, 00) or exit
    strategy.close_all()
Published by ChaoZhang on the FMZ strategy square · last modified 2023-11-13. Collected in the Quant Trading Vault. Unvalidated research: re-test with your own data and costs before trusting it.
Build this with AgenKit
A spec is not a trading system. Paste this into your coding agent and AgenKit runs a specialist team — architecture, test-first build, risk gates, review — with paper trading on by default.
/agenkit build a production-grade trading bot with a backtest engine, risk controls and paper trading by default from strategies/Bollinger-Breakout-Strategy.md- npx agenkit install engineering-kit in your project
- Paste the command into your agent and approve each phase
- Get tests, backtest, risk controls and a paper-trading switch
Understand it first
Before you run this, read the lesson behind the idea and how to backtest it honestly. Specs like this one are the survivors of an unknown number of trials; deflate their results accordingly.
Related specs
- BB Breakout StrategyPine Script · Breakout · 1d
- Bollinger Band T3 Moving Average StrategyPine Script · Breakout · 10m
- Bollinger Bands Dual track Breakthrough StrategyPine Script · Breakout · 30m
- Dynamic Bollinger Bands Breakout Quantitative Trading StrategyPine Script · Breakout · 2d
- EMA and Bollinger Bands Breakout StrategyPine Script · Breakout · 1h
- Momentum Breakout Moving Average StrategyPine Script · Breakout · 1d