Bollinger Bands and Fibonacci Retracement Strategy
The Bollinger Bands and Fibonacci Retracement Strategy is a trading strategy that combines Bollinger Bands and Fibonacci retracement levels. The strategy utilizes Bollinger Bands to measure market volatility and…
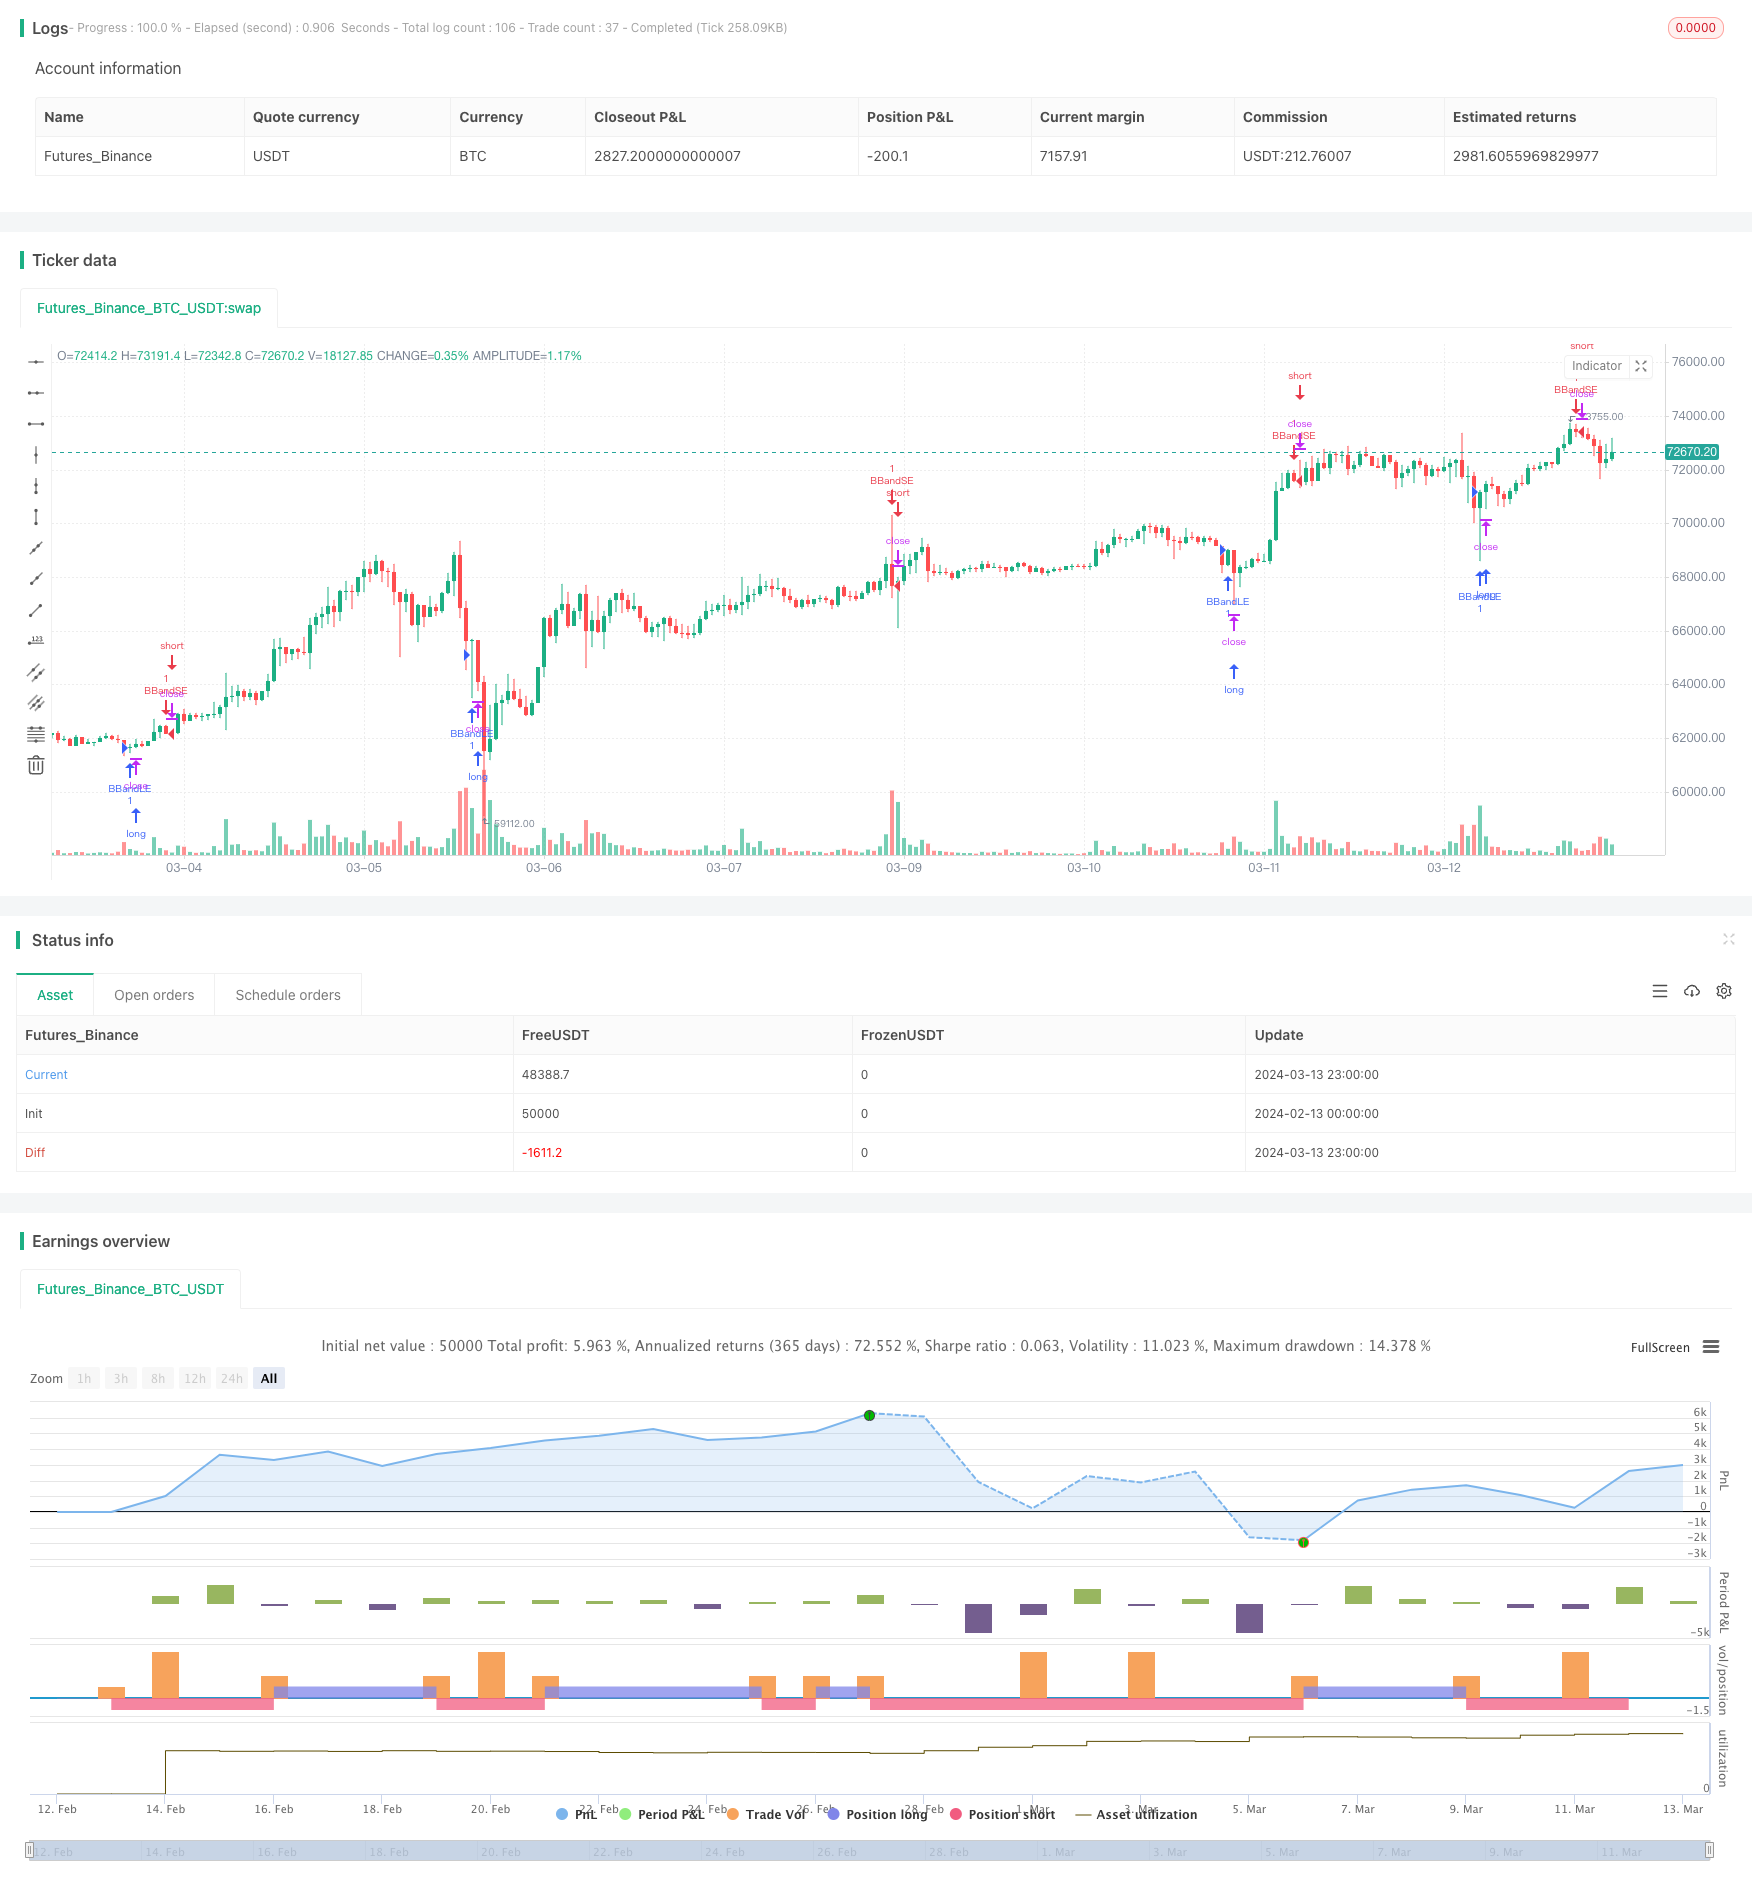
Strategy Overview
The Bollinger Bands and Fibonacci Retracement Strategy is a trading strategy that combines Bollinger Bands and Fibonacci retracement levels. The strategy utilizes Bollinger Bands to measure market volatility and generates trading signals based on price breakouts above or below the upper or lower bands. Simultaneously, the strategy employs Fibonacci retracement levels to identify potential support and resistance levels, determining entry and exit points for trades.
Strategy Principles
The core of this strategy lies in the combined application of Bollinger Bands and Fibonacci retracement levels.
Bollinger Bands consist of three lines: the middle band, upper band, and lower band. The middle band is a moving average of the price, while the upper and lower bands are positioned a certain number of standard deviations above and below the middle band. When the price breaks above the upper band, it indicates a potential overbought condition, generating a sell signal. Conversely, when the price breaks below the lower band, it suggests a potential oversold condition, generating a buy signal.
Fibonacci retracement levels are price levels derived from the Fibonacci sequence. These levels are commonly regarded as key support and resistance levels in the market. When the price retraces to these levels, the market may experience a reversal or a continuation of the prevailing trend.
The decision-making process of this strategy is as follows:
- When the price breaks below the lower Bollinger Band, a buy signal is generated, initiating a long position.
- When the price breaks above the upper Bollinger Band, a sell signal is generated, initiating a short position.
- Fibonacci retracement levels are used to determine entry points, exit points, stop-loss levels, and target levels for trades.
By combining Bollinger Bands and Fibonacci retracement levels, this strategy aims to capture trading opportunities during periods of increased market volatility while managing trade risks and targets using Fibonacci levels.
Strategy Advantages
- Integration of trend and volatility indicators: The combination of Bollinger Bands and Fibonacci retracement levels allows the strategy to consider both market trends and volatility, enhancing the reliability of trading signals.
- Clear entry and exit rules: The strategy provides well-defined trading signals and entry/exit rules, facilitating timely decision-making for traders.
- Risk management: Fibonacci retracement levels offer clear stop-loss and target levels for trades, aiding in risk control.
- Adaptability: The strategy can be applied to various markets and time frames, demonstrating strong adaptability.
Strategy Risks
- Market noise: Bollinger Bands are sensitive to price fluctuations and may generate false signals during periods of high market noise.
- Trend identification: The strategy primarily relies on volatility indicators and may have limited ability to identify market trends, potentially underperforming in strongly trending markets.
- Parameter optimization: The performance of the strategy is sensitive to the parameter settings of Bollinger Bands and Fibonacci retracement levels. Inappropriate parameters may lead to suboptimal strategy performance.
- Changing market conditions: The strategy may perform well in certain market conditions but may fail to adapt when market dynamics shift.
Optimization Directions
- Integration with other technical indicators: Consider combining Bollinger Bands and Fibonacci retracement levels with other technical indicators, such as trend indicators or momentum indicators, to enhance the reliability of trading signals.
- Parameter optimization: Optimize the parameters of Bollinger Bands, including the period and standard deviation multiplier, as well as the Fibonacci retracement levels to better suit different market environments.
- Incorporation of stop-loss and take-profit strategies: Introduce more advanced stop-loss and take-profit strategies, such as trailing stops or dynamic profit targets, to better manage risks and lock in profits.
- Consideration of market trends: Incorporate market trend analysis into the strategy, adopting trend-following approaches during strong trends and employing range-bound strategies during sideways markets to improve the strategy's adaptability.
Conclusion
The Bollinger Bands and Fibonacci Retracement Strategy combines Bollinger Bands and Fibonacci retracement levels to capture trading opportunities during periods of increased market volatility while managing risks using Fibonacci levels. The strategy offers clear trading rules and demonstrates good adaptability. However, it also faces risks such as market noise, trend identification challenges, parameter optimization, and changing market conditions. To further enhance the strategy's performance, considerations can be made to integrate other technical indicators, optimize parameters, introduce more advanced stop-loss and take-profit mechanisms, and incorporate market trend analysis. Overall, the Bollinger Bands and Fibonacci Retracement Strategy provides traders with a volatility-based and key support/resistance-based approach to trading, but requires careful adjustment and optimization based on specific market conditions.
Parameters
| Name | Default | What it controls |
|---|---|---|
| v_input_int_1 | 20 | length |
| v_input_float_1 | 2 | mult |
| v_input_bool_1 | true | Use Fibonacci Levels |
| v_input_float_2 | 0.236 | Fib Level 1 |
| v_input_float_3 | 0.382 | Fib Level 2 |
| v_input_float_4 | 0.618 | Fib Level 3 |
Source Pine Script
/*backtest
start: 2024-02-13 00:00:00
end: 2024-03-14 00:00:00
period: 1h
basePeriod: 15m
exchanges: [{"eid":"Futures_Binance","currency":"BTC_USDT"}]
*/

//@version=5
strategy("Bollinger Bands & Fibonacci Strategy", overlay=true)

// Bollinger Bands Parameters
source = close
length = input.int(20, minval=1)
mult = input.float(2.0, minval=0.001, maxval=50)

// Fibonacci Levels
fib_levels = input.bool(true, "Use Fibonacci Levels")
fib_level1 = input.float(0.236, title="Fib Level 1", minval=0.001, maxval=1)
fib_level2 = input.float(0.382, title="Fib Level 2", minval=0.001, maxval=1)
fib_level3 = input.float(0.618, title="Fib Level 3", minval=0.001, maxval=1)

// Strategy Entry
basis = ta.sma(source, length)
dev = mult * ta.stdev(source, length)
upper = basis + dev
lower = basis - dev

if (ta.crossover(source, lower))
    strategy.entry("BBandLE", strategy.long, comment="BBandLE")
else
    strategy.cancel(id="BBandLE")

if (ta.crossunder(source, upper))
    strategy.entry("BBandSE", strategy.short, comment="BBandSE")
else
    strategy.cancel(id="BBandSE")

// Calculate Fibonacci Levels
// fib_low = ta.lowest(low, length)
// fib_high = ta.highest(high, length)
// fib_range = fib_high - fib_low

// fib_level1_price = fib_high - fib_range * fib_level1
// fib_level2_price = fib_high - fib_range * fib_level2
// fib_level3_price = fib_high - fib_range * fib_level3

// // Plot Fibonacci Levels
// var line fib_level1_line = na
// var line fib_level2_line = na
// var line fib_level3_line = na

// if fib_levels
//     if bar_index > length
//         fib_level1_line := line.new(bar_index[length], fib_level1_price, bar_index, fib_level1_price, color=color.blue)
//         fib_level2_line := line.new(bar_index[length], fib_level2_price, bar_index, fib_level2_price, color=color.green)
//         fib_level3_line := line.new(bar_index[length], fib_level3_price, bar_index, fib_level3_price, color=color.orange)

//     if bar_index <= length
//         // line.delete(fib_level1_line)
//         // line.delete(fib_level2_line)
//         // line.delete(fib_level3_line)
Published by ChaoZhang on the FMZ strategy square · last modified 2024-03-15. Collected in the Quant Trading Vault. Unvalidated research: re-test with your own data and costs before trusting it.
Build this with AgenKit
A spec is not a trading system. Paste this into your coding agent and AgenKit runs a specialist team — architecture, test-first build, risk gates, review — with paper trading on by default.
/agenkit build a production-grade trading bot with a backtest engine, risk controls and paper trading by default from strategies/Bollinger-Bands-and-Fibonacci-Retracement-Strategy.md- npx agenkit install engineering-kit in your project
- Paste the command into your agent and approve each phase
- Get tests, backtest, risk controls and a paper-trading switch
Understand it first
Before you run this, read the lesson behind the idea and how to backtest it honestly. Specs like this one are the survivors of an unknown number of trials; deflate their results accordingly.
Related specs
- Moving Average Crossover and Upper Rail Breakthrough Impulse StrategyPine Script · Breakout · 1m
- Multi factor Intelligent Trading StrategyPine Script · Breakout · 1d
- Breakout and Intelligent Bollinger Bands Price Channel StrategyPine Script · Breakout · 1h
- Fibonacci Bollinger Bands with RSI Dynamic Take Profit StrategyPine Script · Breakout · 1h
- Bollinger Bands Breakout Trading StrategyPine Script · Breakout · 1h
- Bollinger Bands Dynamic Breakout StrategyPine Script · Breakout · 1h