Strategy vault / Trend following
Bollinger Bands and Moving Average Crossover Strategy
This strategy combines two technical indicators, Bollinger Bands and moving averages, to determine market trends based on the relative position of price to the Bollinger Bands and the crossover signals of fast and…
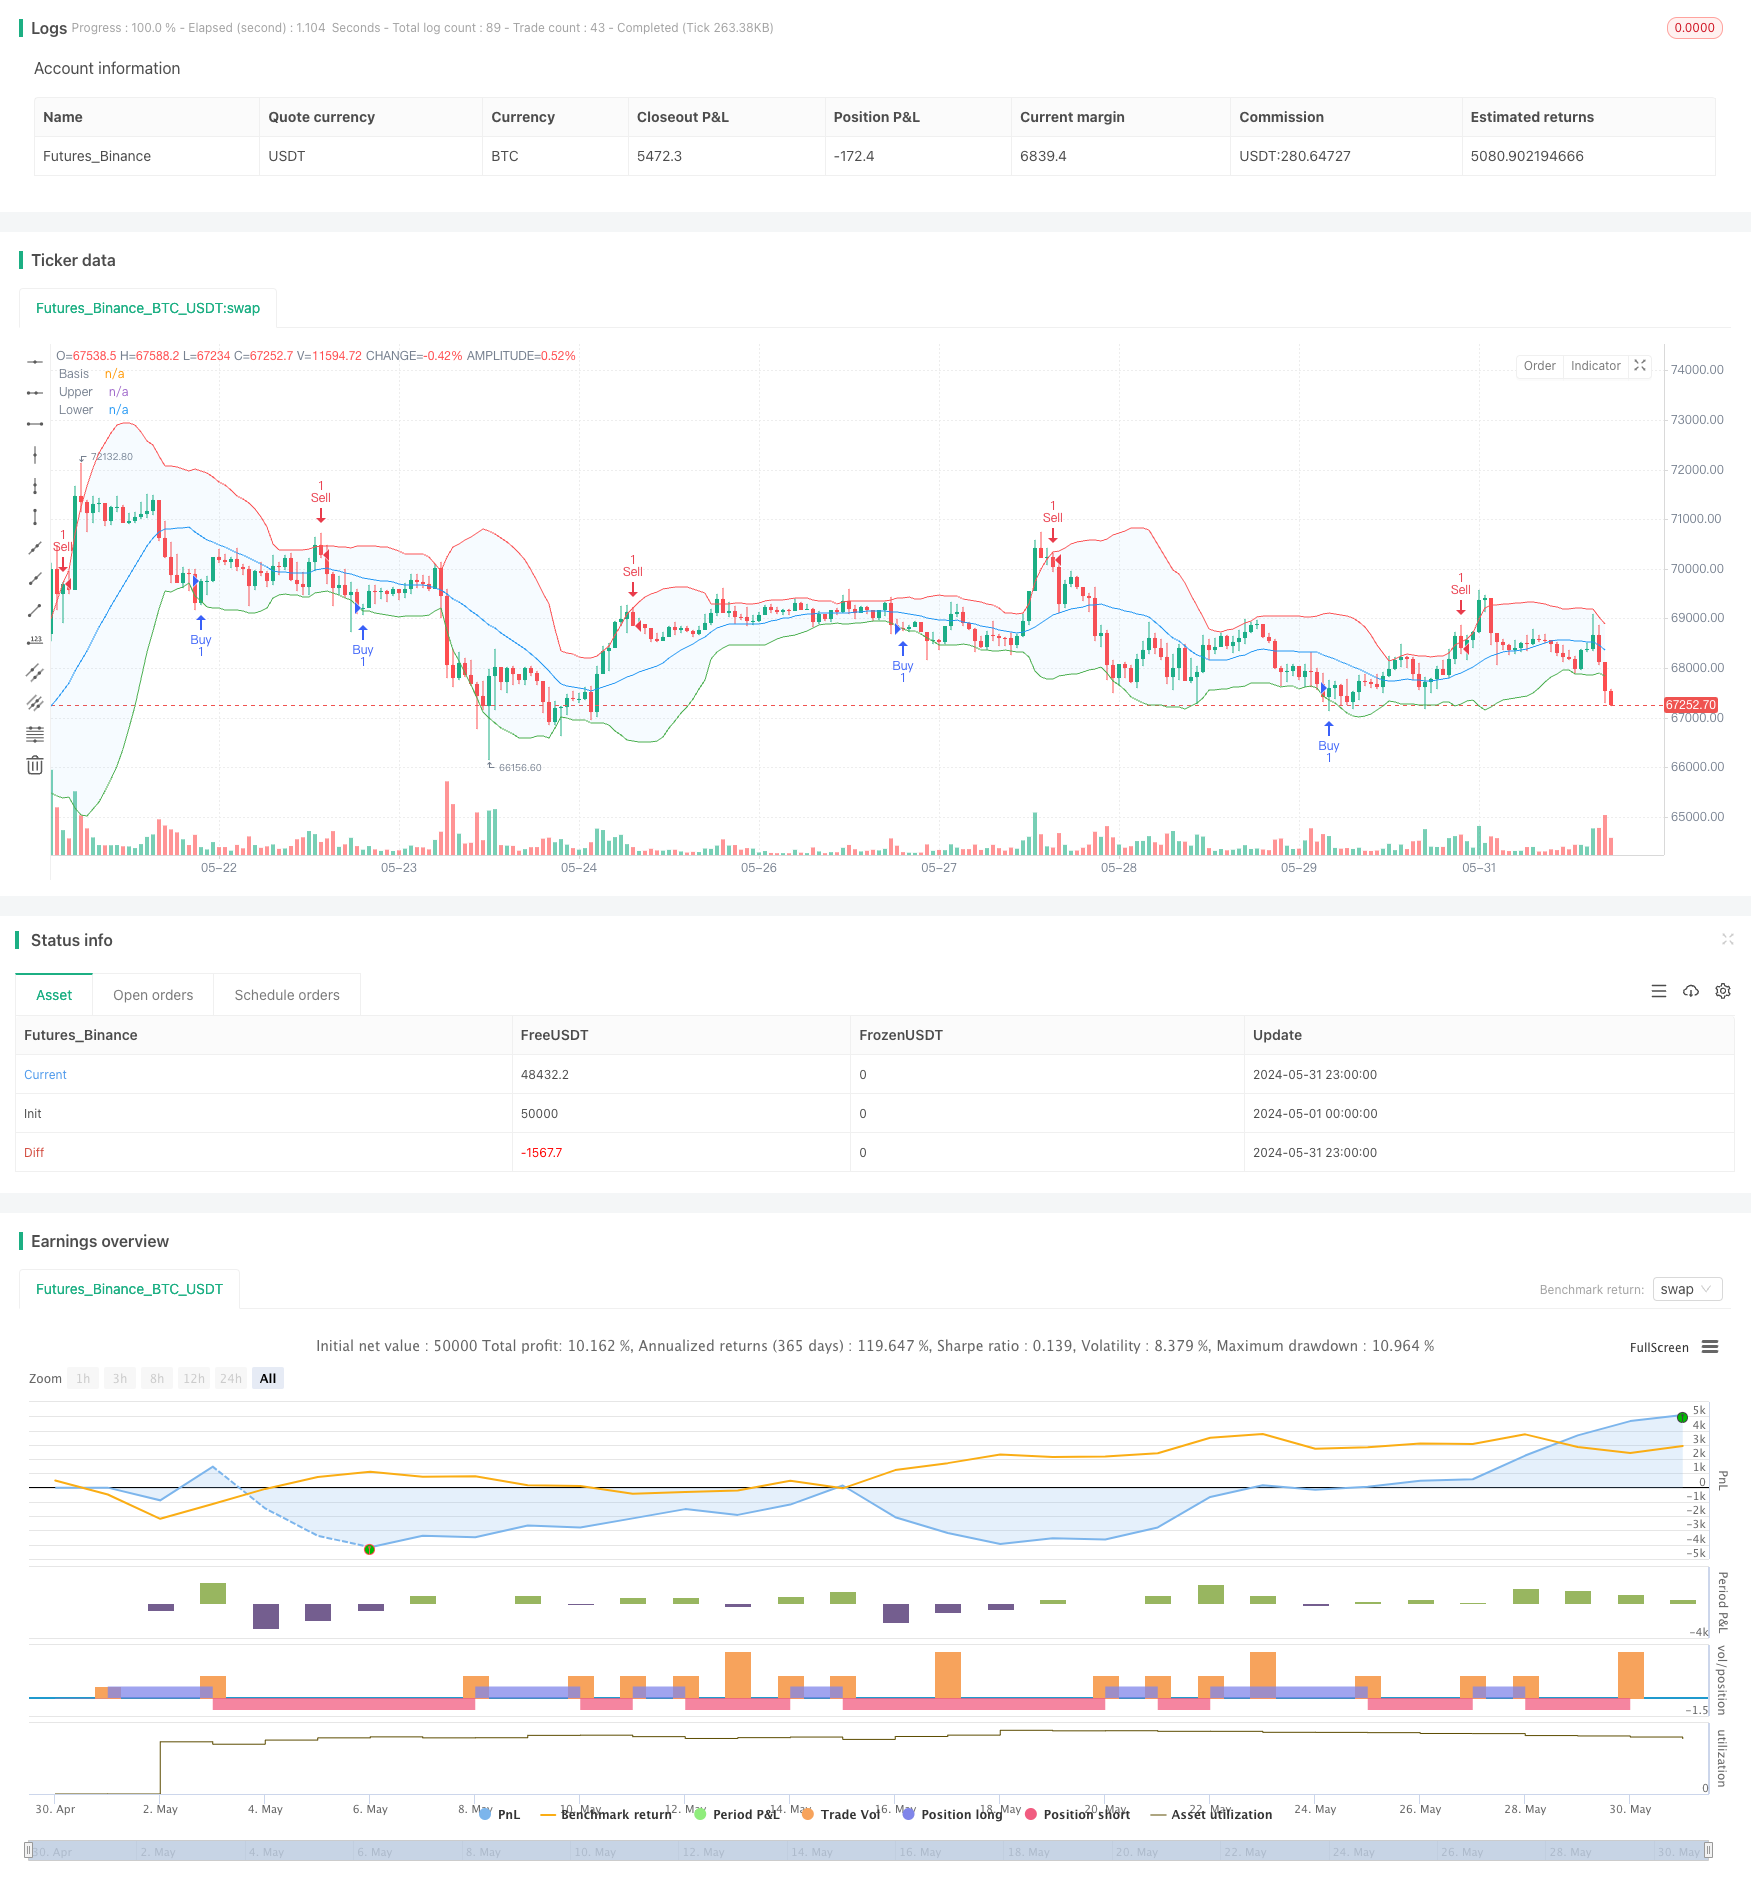
Overview
This strategy combines two technical indicators, Bollinger Bands and moving averages, to determine market trends based on the relative position of price to the Bollinger Bands and the crossover signals of fast and slow moving averages, thus realizing timely buying and selling. When the price breaks through the lower band of the Bollinger Bands, it opens a long position, and when it breaks through the upper band, it opens a short position. At the same time, when the fast moving average crosses above the slow moving average, it opens a long position, and when it crosses below, it closes the position. This strategy can help investors grasp market trends and achieve stable investment returns.
Strategy Principle
- Bollinger Bands consist of three lines: the middle band, the upper band, and the lower band. The middle band is the moving average, and the upper and lower bands are the middle band plus or minus a certain multiple of standard deviations. When the price breaks through the upper band, it indicates that the market is overbought and may experience a pullback; when it breaks through the lower band, it indicates that the market is oversold and may experience a rebound.
- The crossover of fast and slow moving averages is also a commonly used method for judging trends. When the fast moving average crosses above the slow moving average, it is called a "golden cross", indicating that the market may turn strong; when the fast moving average crosses below the slow moving average, it is called a "death cross", indicating that the market may turn weak.
- This strategy uses Bollinger Bands to judge overbought and oversold conditions, and uses the moving average crossover to judge trends. The combination of the two can form a relatively reliable trading signal. When the price breaks through the lower band of the Bollinger Bands and the fast moving average crosses above the slow moving average, it goes long until the price breaks through the upper band or the fast moving average crosses below the slow moving average, at which point it closes the position.
Advantage Analysis
- Bollinger Bands can adaptively adjust according to the size of price fluctuations and are more sensitive to changes in volatility.
- The moving average system can effectively track market trends and help investors grasp the main trend direction.
- Combining Bollinger Bands and moving averages to form a breakout + trend following trading system can effectively reduce trading frequency and costs, and improve system stability.
- The code sets multiple parameters, such as the moving average type and period, which can be flexibly adjusted to adapt to different market conditions.
Risk Analysis
- When market volatility suddenly increases, the Bollinger Band channel will expand sharply, and more stop-losses may occur.
- The moving average system's judgment of trends may lag, resulting in inaccurate entry and exit timing.
- Trend-following strategies perform generally in range-bound markets and need to be optimized in combination with other methods.
- Improper parameter settings may cause the strategy to fail, requiring continuous optimization and testing.
Optimization Direction
- On the basis of moving average crossovers, other trend indicators such as MACD can be added to further confirm trend signals.
- Bollinger Band breakouts can be combined with stop-loss indicators such as ATR to control drawdown risk.
- On the basis of trend judgment, methods such as market divergence and pattern recognition can be added to judge trend turning points earlier.
- For different underlying assets and time periods, parameters need to be optimized to find suitable parameter combinations.
Summary
The Bollinger Bands and Moving Average Crossover strategy is a classic trend-following strategy that uses Bollinger Bands to judge overbought and oversold conditions and moving average crossovers to judge trends, which can effectively grasp market trends and achieve stable returns. However, in practical application, it is necessary to pay attention to controlling drawdowns, optimizing parameters, and continuously improving in combination with other methods to adapt to the changing market environment.
Source Pine Script
/*backtest
start: 2024-05-01 00:00:00
end: 2024-05-31 23:59:59
period: 1h
basePeriod: 15m
exchanges: [{"eid":"Futures_Binance","currency":"BTC_USDT"}]
*/

//@version=5
strategy(shorttitle="BB Strategy", title="Bollinger Bands Strategy", overlay=true)

// Input parameters
length = input.int(20, minval=1)
maType = input.string("SMA", "Basis MA Type", options=["SMA", "EMA", "SMMA (RMA)", "WMA", "VWMA"])
src = input(close, title="Source")
mult = input.float(2.0, minval=0.001, maxval=50, title="StdDev")
offset = input.int(0, "Offset", minval=-500, maxval=500)

// Moving average function
ma(source, length, _type) =>
    switch _type
        "SMA" => ta.sma(source, length)
        "EMA" => ta.ema(source, length)
        "SMMA (RMA)" => ta.rma(source, length)
        "WMA" => ta.wma(source, length)
        "VWMA" => ta.vwma(source, length)

// Calculate Bollinger Bands
basis = ma(src, length, maType)
dev = mult * ta.stdev(src, length)
upper = basis + dev
lower = basis - dev

// Plot Bollinger Bands
plot(basis, "Basis", color=color.blue, offset=offset)
p1 = plot(upper, "Upper", color=color.red, offset=offset)
p2 = plot(lower, "Lower", color=color.green, offset=offset)
fill(p1, p2, title="Background", color=color.rgb(33, 150, 243, 95))

// Strategy entry and exit conditions
if (ta.crossover(close, lower))
    strategy.entry("Buy", strategy.long)

if (ta.crossunder(close, upper))
    strategy.entry("Sell", strategy.short)
Published by ChaoZhang on the FMZ strategy square · last modified 2024-06-07. Collected in the Quant Trading Vault. Unvalidated research: re-test with your own data and costs before trusting it.
Build this with AgenKit
A spec is not a trading system. Paste this into your coding agent and AgenKit runs a specialist team — architecture, test-first build, risk gates, review — with paper trading on by default.
/agenkit build a production-grade trading bot with a backtest engine, risk controls and paper trading by default from strategies/Bollinger-Bands-and-Moving-Average-Crossover-Strategy.md- npx agenkit install engineering-kit in your project
- Paste the command into your agent and approve each phase
- Get tests, backtest, risk controls and a paper-trading switch
Understand it first
Before you run this, read the lesson behind the idea and how to backtest it honestly. Specs like this one are the survivors of an unknown number of trials; deflate their results accordingly.
Related specs
- ATR and Moving Average Crossover Hybrid StrategyPine Script · Trend following · 1h
- Bollinger Band Moving Average Crossover StrategyPine Script · Trend following · 1h
- Bollinger Bands and EMA Trend Following StrategyPine Script · Trend following · 1h
- Bollinger Bands and RSI Trend Following StrategyPine Script · Trend following · 1h
- Dual Moving Average Crossover Dynamic Position Optimization Strategy with EMA Cross Signal SystemPine Script · Trend following · 1h
- EMA Cross Trend Following Strategy with SMA Stop Loss and Re Entry MechanismPine Script · Trend following · 1h