Bollinger Bands and StochRSI Momentum Strategy
The Bollinger Bands and StochRSI Momentum Strategy is designed to identify potential buy and sell opportunities in financial markets by combining two widely-used technical indicators: Bollinger Bands and Stochastic…
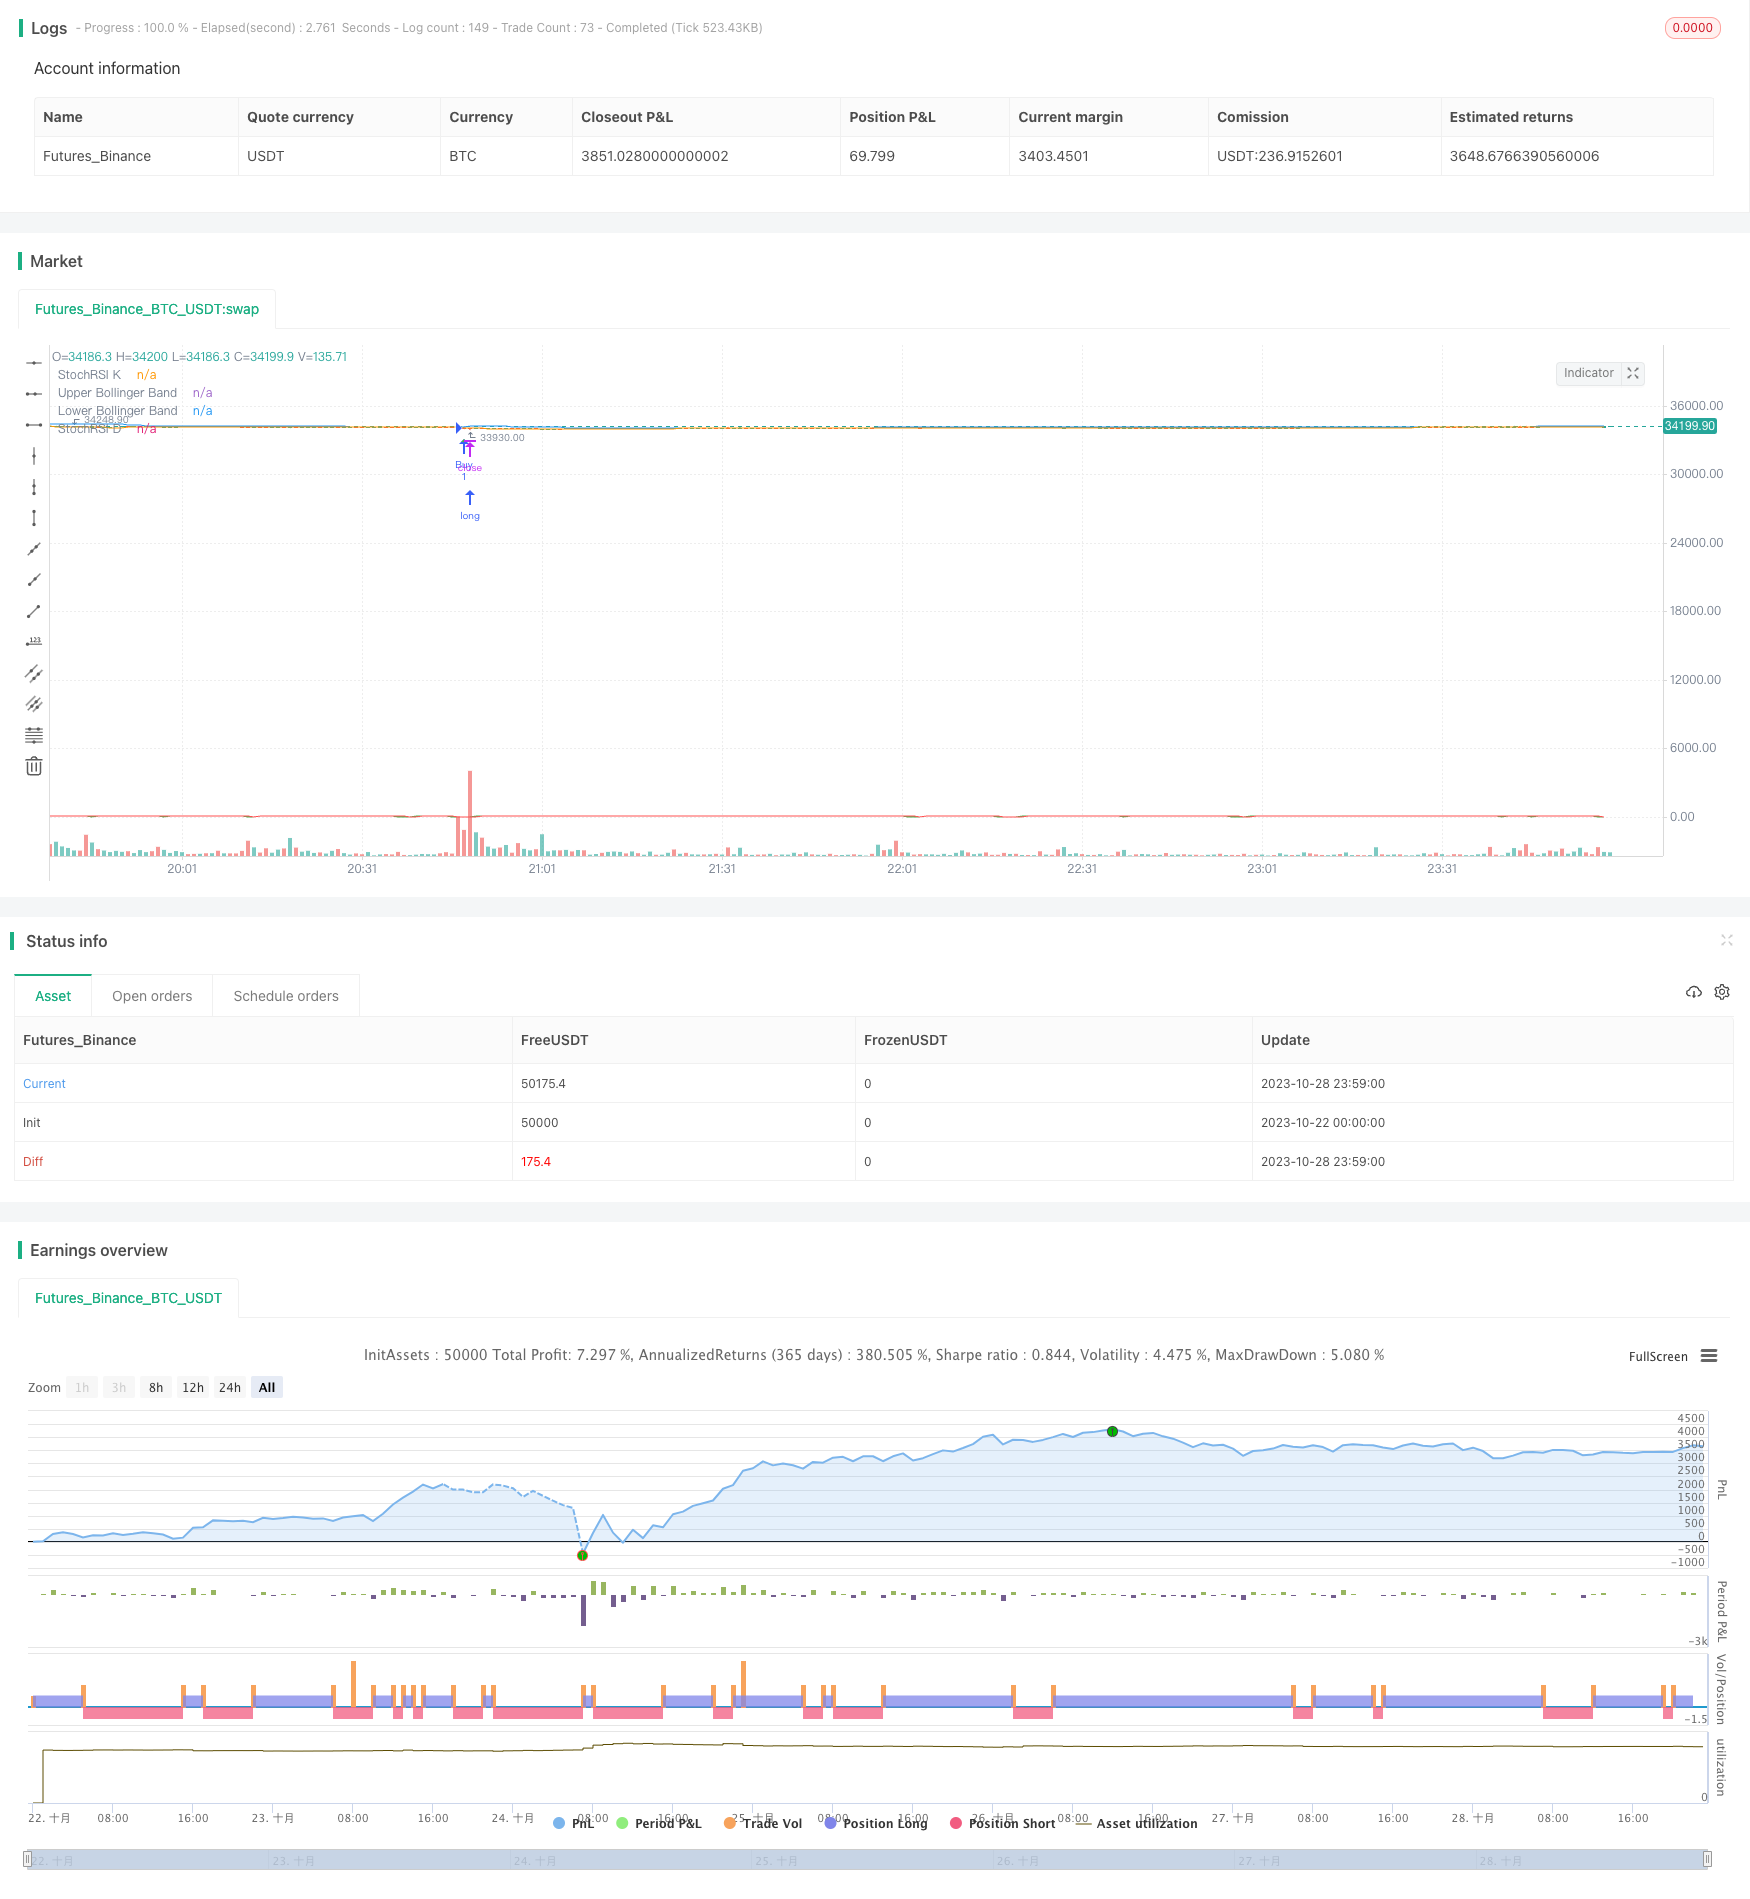
Overview
The Bollinger Bands and StochRSI Momentum Strategy is designed to identify potential buy and sell opportunities in financial markets by combining two widely-used technical indicators: Bollinger Bands and Stochastic RSI. This strategy aims to capture momentum shifts and take advantage of price movements.
Strategy Logic
The strategy utilizes the following two indicators:
Bollinger Bands: Bollinger Bands consist of three lines on a price chart – a simple moving average (SMA) as the middle band, and upper and lower bands that represent standard deviation away from the SMA. These bands help identify periods of high and low volatility.
Stochastic RSI (StochRSI): Stochastic RSI is a momentum oscillator derived from the Relative Strength Index (RSI). It measures the position of the RSI relative to its range and is useful in identifying overbought and oversold levels.
The parameters of the strategy include:
Bollinger Bands Length: The number of periods used to calculate the Bollinger Bands. Longer length captures long-term trends while shorter length responds faster to price changes.
Bollinger Bands Deviation: Adjusts the width of the bands by scaling the standard deviation. Higher values increase the width to account for higher volatility.
StochRSI Length: The number of periods used to calculate the StochRSI. Shorter length makes the indicator more responsive to recent price swings.
K and D Periods: Control the smoothing and signal line generation in StochRSI, affecting sensitivity.
Trading logic:
Bollinger Bands are calculated based on chosen length and deviation. The bands envelope the SMA and quantify volatility.
StochRSI is computed using the defined length, generating oscillating K and D lines between 0 and 100. This identifies momentum shifts.
The buy condition occurs when the StochRSI K line crosses above the D line and the close is below the lower Bollinger Band. This suggests a potential bullish reversal with low volatility, signaling an opportunity to buy.
The sell condition is triggered when the StochRSI K line crosses below the D line and the close is above the upper Bollinger Band. This indicates a potential bearish reversal with high volatility, signaling an opportunity to sell.
Entry orders are placed when the buy/sell conditions are met, going long or short based on the market expectation.
Optional buy/sell signals can be visualized on the chart using up/down triangles.
The strategy plots the Bollinger Bands, StochRSI K/D for visual analysis.
Advantages
Combines two widely-followed indicators, benefiting from both.
Bollinger Bands identify volatility trends, StochRSI catches reversals.
Customizable parameters suit different trading styles and market environments.
Clear entry signals are generated with visual plot shapes.
Can trade both long and short based on conditions.
Systematic logic allows backtesting to quantify performance.
Risks
Performance depends on robust optimization of parameters.
Trading costs and slippage affect profitability and must be considered.
Bollinger Band width is critical, too wide or narrow reduces accuracy.
Severe volatility increases likelihood of false signals.
Stop losses need to be implemented and monitored for risk control.
Enhancement Opportunities
Optimize parameters for the targeted instrument and time frame.
Incorporate trailing stops or position sizing to control risk per trade.
Add filters using other indicators like MACD, KDJ to improve signal reliability.
Incorporate machine learning to judge the probability of buy/sell signals.
Add volume indicators to avoid trading against the trend.
Conclusion
This strategy provides a systematic approach to trading momentum shifts using Bollinger Bands and StochRSI. With robust optimization, backtesting, and risk management, it has strong practical potential. Further enhancements can build it into a reliable automated trading system.
Parameters
| Name | Default | What it controls |
|---|---|---|
| v_input_int_1 | 20 | Bollinger Bands Length |
| v_input_float_1 | 2 | Bollinger Bands Deviation |
| v_input_int_2 | 14 | StochRSI Length |
| v_input_int_3 | 3 | K Period |
| v_input_int_4 | 3 | D Period |
Source Pine Script
/*backtest
start: 2023-10-22 00:00:00
end: 2023-10-29 00:00:00
period: 1m
basePeriod: 1m
exchanges: [{"eid":"Futures_Binance","currency":"BTC_USDT"}]
*/

//@version=5
strategy("My Strategy with Bollinger Bands and StochRSI", overlay=true)

// Define your Bollinger Bands parameters
bollinger_length = input.int(20, title="Bollinger Bands Length")
bollinger_dev = input.float(2, title="Bollinger Bands Deviation")

// Calculate Bollinger Bands
sma = ta.sma(close, bollinger_length)
dev = bollinger_dev * ta.stdev(close, bollinger_length)

upper_band = sma + dev
lower_band = sma - dev

// Define your StochRSI parameters
stoch_length = input.int(14, title="StochRSI Length")
k_period = input.int(3, title="K Period")
d_period = input.int(3, title="D Period")

// Calculate StochRSI
rsi = ta.rsi(close, stoch_length)
k = ta.sma(ta.stoch(rsi, rsi, rsi, k_period), k_period)
d = ta.sma(k, d_period)

// Define your buy and sell conditions
buy_condition = ta.crossover(k, d) and close < lower_band
sell_condition = ta.crossunder(k, d) and close > upper_band

// Place orders based on the conditions
if (buy_condition)
    strategy.entry("Buy", strategy.long)

if (sell_condition)
    strategy.entry("Sell", strategy.short)

// Optional: Plot buy and sell signals on the chart
plotshape(buy_condition, color=color.green, style=shape.triangleup, location=location.belowbar, size=size.small)
plotshape(sell_condition, color=color.red, style=shape.triangledown, location=location.abovebar, size=size.small)

// Plot Bollinger Bands and StochRSI on the chart
plot(upper_band, title="Upper Bollinger Band", color=color.blue)
plot(lower_band, title="Lower Bollinger Band", color=color.orange)
plot(k, title="StochRSI K", color=color.green)
plot(d, title="StochRSI D", color=color.red)
Published by ChaoZhang on the FMZ strategy square · last modified 2023-10-30. Collected in the Quant Trading Vault. Unvalidated research: re-test with your own data and costs before trusting it.
Build this with AgenKit
A spec is not a trading system. Paste this into your coding agent and AgenKit runs a specialist team — architecture, test-first build, risk gates, review — with paper trading on by default.
/agenkit build a production-grade trading bot with a backtest engine, risk controls and paper trading by default from strategies/Bollinger-Bands-and-StochRSI-Momentum-Strategy.md- npx agenkit install engineering-kit in your project
- Paste the command into your agent and approve each phase
- Get tests, backtest, risk controls and a paper-trading switch
Understand it first
Before you run this, read the lesson behind the idea and how to backtest it honestly. Specs like this one are the survivors of an unknown number of trials; deflate their results accordingly.
Related specs
- Momentum Trading Strategy Based on Multi factor ModelPine Script · Momentum · 1d
- Bollinger Bands RSI Stochastic RSI Strategy Based on Volatility and Momentum IndicatorsPine Script · Momentum · 1h
- Multi Indicator Comprehensive Analysis Quantitative Trading Strategy Trend Momentum and Volatility Collaborative Prediction ModelPine Script · Momentum · 3m
- Multi factor Fusion Strategy Multi factor Fusion StrategyPine Script · Momentum · 3h
- ADX Momentum Trend StrategyPine Script · Momentum · 10m
- Advanced Multi Indicator Trend Following and Momentum Quantitative Trading StrategyPine Script · Momentum · 1h