Bollinger Bands Standard Deviation Breakout Strategy 432809
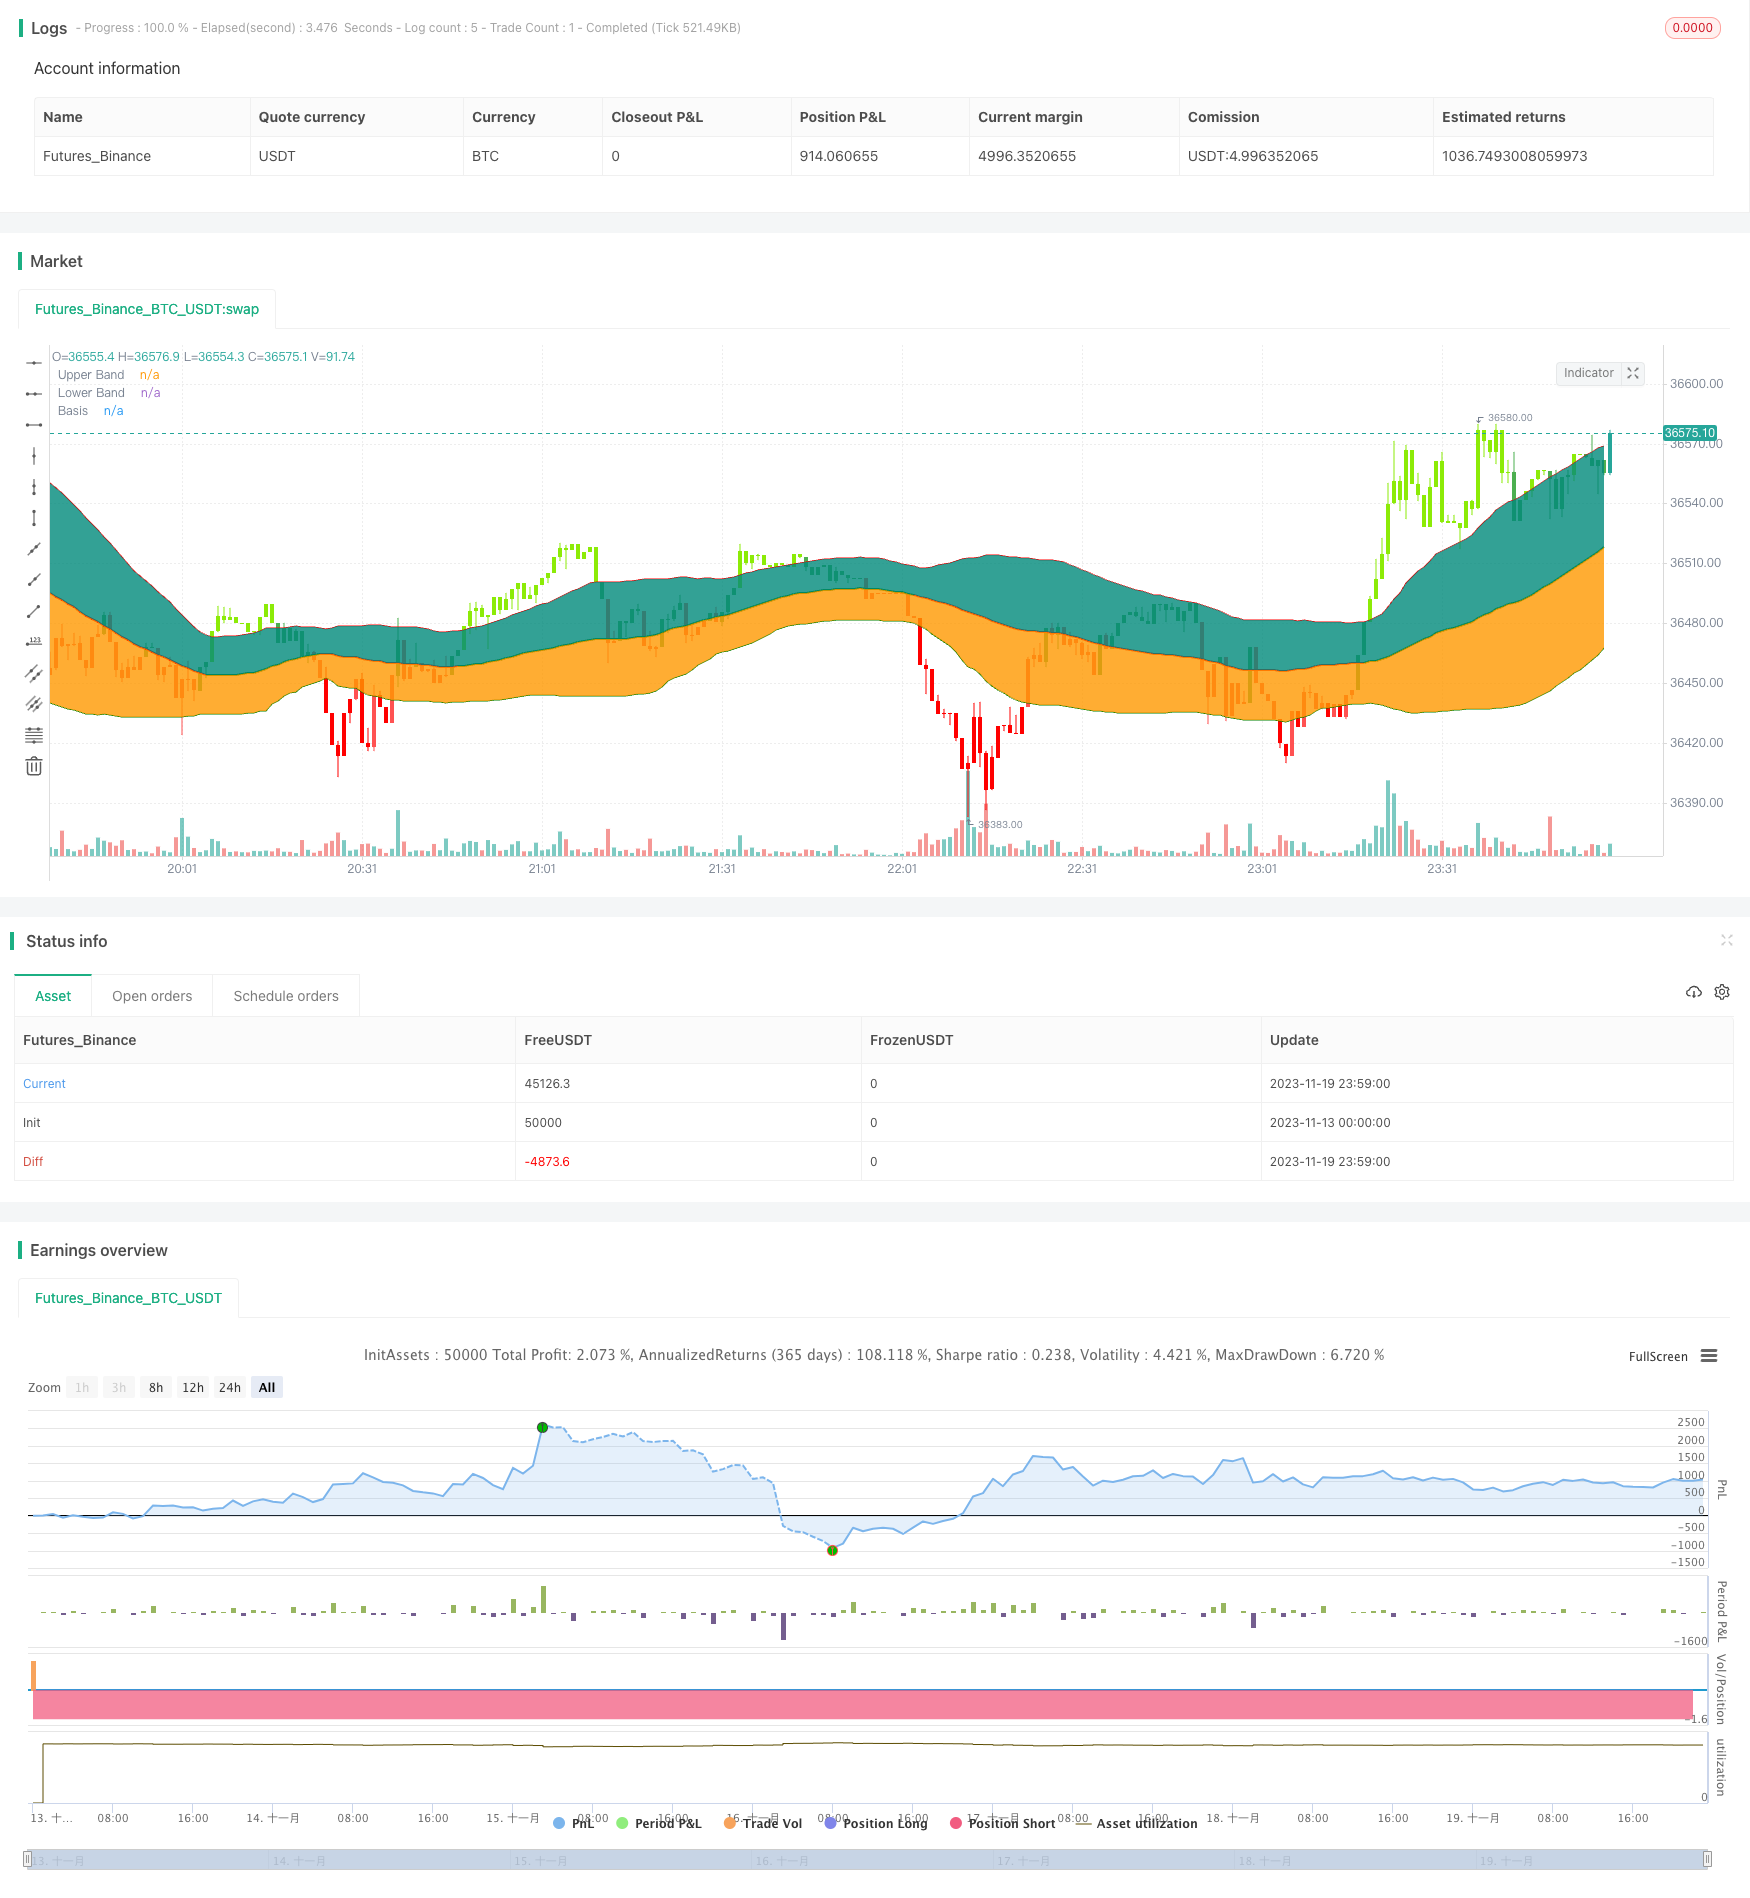
This strategy is based on the classic Bollinger Bands indicator. It goes long when the price closes above the upper band and goes short when the price closes below the lower band. It belongs to the trend following…
Overview
This strategy is based on the classic Bollinger Bands indicator. It goes long when the price closes above the upper band and goes short when the price closes below the lower band. It belongs to the trend following breakout strategy.
Strategy Logic
- The baseline is 55-day simple moving average.
- The upper and lower bands are one standard deviation above and below the baseline respectively.
- A long signal is generated when the price closes above the upper band.
- A short signal is generated when the price closes below the lower band.
- Using one standard deviation instead of the classic two standard deviations reduces the risk.
Advantage Analysis
- Using standard deviation instead of fixed value reduces risk.
- The 55-day moving average can better reflect the medium-term trend.
- Close breakout filters out false breakouts.
- Easy to determine trend direction through multi-timeframe analysis.
Risk Analysis
- Prone to churning small profits.
- Need to consider the impact of transaction fees.
- Breakout signals may be false breakouts.
- Slippage loss may occur.
Risks can be mitigated by setting stop loss, considering transaction fees, or adding indicator filters.
Optimization Directions
- Optimize baseline parameters to find the best moving average.
- Optimize the standard deviation size to find the optimal parameters.
- Add auxiliary volume indicators for judgement.
- Add stop loss mechanism.
Summary
The overall logic of this strategy is clear. It adjusts risk through the standard deviation band width and avoids false breakouts using close breakout. But it is still necessary to prevent oscillating losses by using stop loss, adding filters etc.
Parameters
| Name | Default | What it controls |
|---|---|---|
| v_input_1_close | 0 | Source: close | high | low | open | hl2 | hlc3 | hlcc4 | ohlc4 |
| v_input_2 | 55 | SMA length |
| v_input_3 | true | Standard Deviation |
| v_input_4 | true | Color Bars |
| v_input_5 | true | ╔═══ Time Range to BackTest ═══╗ |
| v_input_6 | true | From Month |
| v_input_7 | true | From Day |
| v_input_8 | 2018 | From Year |
| v_input_9 | true | To Month |
| v_input_10 | true | To Day |
| v_input_11 | 9999 | To Year |
Source Pine Script
/*backtest
start: 2023-11-13 00:00:00
end: 2023-11-20 00:00:00
period: 1m
basePeriod: 1m
exchanges: [{"eid":"Futures_Binance","currency":"BTC_USDT"}]
*/

//@version=4

//┌───── •••• ─────┐//
//   TradeChartist  //
//└───── •••• ─────┘//

//Bollinger Bands is a classic indicator that uses a simple moving average of 20 periods along with upper and lower bands that are 2 standard deviations away from the basis line.
//These bands help visualize price volatility and trend based on where the price is in relation to the bands.

//This Bollinger Bands filter plots a long signal when price closes above the upper band and plots a short signal when price closes below the lower band.
//It doesn't take into account any other parameters such as Volume/RSI/fundamentals etc, so user must use discretion based on confirmations from another indicator or based on fundamentals.

//This filter's default is 55 SMA and 1 standard deviation, but can be changed based on asset type

//It is definitely worth reading the 22 rules of Bollinger Bands written by John Bollinger.


strategy(shorttitle="BB Breakout Strategy", title="Bollinger Bands Filter", overlay=true,
             pyramiding=1, currency=currency.NONE ,
             initial_capital = 10000, default_qty_type = strategy.percent_of_equity,
             default_qty_value=100, calc_on_every_tick= true, process_orders_on_close=false)

src         = input(close, title = "Source")
length      = input(55, minval=1, title = "SMA length")// 20 for classis Bollinger Bands SMA line (basis)


mult        = input(1., minval=0.236, maxval=2, title="Standard Deviation")//2 for Classic Bollinger Bands //Maxval = 2 as higher the deviation, higher the risk
basis       = sma(src, length)
dev         = mult * stdev(src,length)

CC          = input(true, "Color Bars")


upper       = basis + dev
lower       = basis - dev

//Conditions for Long and Short - Extra filter condition can be used such as RSI or CCI etc.

short       = src<lower// and rsi(close,14)<40
long        = src>upper// and rsi(close,14)>60

L1          = barssince(long)
S1          = barssince(short)

longSignal  = L1<S1 and not (L1<S1)[1]
shortSignal = S1<L1 and not (S1<L1)[1]

//Plots and Fills


////Long/Short shapes with text
// plotshape(S1<L1 and not (S1<L1)[1]?close:na, text = "sᴇʟʟ", textcolor=#ff0100, color=#ff0100, style=shape.triangledown, size=size.small, location=location.abovebar, transp=0, title = "SELL", editable = true)
// plotshape(L1<S1 and not (L1<S1)[1]?close:na, text = "ʙᴜʏ", textcolor = #008000, color=#008000, style=shape.triangleup, size=size.small, location=location.belowbar, transp=0, title = "BUY", editable = true)


// plotshape(shortSignal?close:na, color=#ff0100, style=shape.triangledown, size=size.small, location=location.abovebar, transp=0, title = "Short Signal", editable = true)
// plotshape(longSignal?close:na, color=#008000, style=shape.triangleup, size=size.small, location=location.belowbar, transp=0, title = "Long Signal", editable = true)


p1          = plot(upper, color=#ff0000, display=display.all, transp=75, title = "Upper Band")
p2          = plot(lower, color=#008000, display=display.all, transp=75, title = "Lower Band")


p           = plot(basis, color=L1<S1?#008000:S1<L1?#ff0000:na, linewidth=2, editable=false, title="Basis")


fill(p,p1, color=color.teal, transp=85, title = "Top Fill") //fill for basis-upper
fill(p,p2, color=color.orange, transp=85, title = "Bottom Fill")//fill for basis-lower


//Barcolor

bcol        = src>upper?color.new(#8ceb07,0):
             src<lower?color.new(#ff0000,0):
             src>basis?color.green:
             src<basis?color.red:na


barcolor(CC?bcol:na, editable=false, title = "Color Bars")


// //Alerts ----  // Use 'Once per bar close'

// alertcondition(condition=longSignal, title="Long - BB Filter", message='BB Filter Long @ {{close}}') // Use 'Once per bar close'
// alertcondition(condition=shortSignal, title="Short - BB Filter", message='BB Filter Short @ {{close}}')  // Use 'Once per bar close'

Notestart1 = input(true, "╔═══ Time Range to BackTest ═══╗")


// === INPUT BACKTEST RANGE ===
FromMonth = input(defval=1, title="From Month", minval=1, maxval=12)
FromDay = input(defval=1, title="From Day", minval=1, maxval=31)
FromYear = input(defval=2018, title="From Year", minval=2015)
ToMonth = input(defval=1, title="To Month", minval=1, maxval=12)
ToDay = input(defval=1, title="To Day", minval=1, maxval=31)
ToYear = input(defval=9999, title="To Year", minval=2010)

// === FUNCTION EXAMPLE ===
start = timestamp(FromYear, FromMonth, FromDay, 00, 00)  // backtest start window
finish = timestamp(ToYear, ToMonth, ToDay, 23, 59)  // backtest finish window
window() =>  // create function "within window of time"
    time >= start and time <= finish ? true : false

if(window())
    strategy.entry("Long", long=true, when =  longSignal)
    // strategy.close("Long", when = (short and S3==0), comment = "Close Long")

if(window())
    strategy.entry("Short", long=false, when = shortSignal)
    // strategy.close("Short", when = (long and L3==0), comment = "Close Short")
Published by ChaoZhang on the FMZ strategy square · last modified 2023-11-21. Collected in the Quant Trading Vault. Unvalidated research: re-test with your own data and costs before trusting it.
Build this with AgenKit
A spec is not a trading system. Paste this into your coding agent and AgenKit runs a specialist team — architecture, test-first build, risk gates, review — with paper trading on by default.
/agenkit build a production-grade trading bot with a backtest engine, risk controls and paper trading by default from strategies/Bollinger-Bands-Standard-Deviation-Breakout-Strategy-432809.md- npx agenkit install engineering-kit in your project
- Paste the command into your agent and approve each phase
- Get tests, backtest, risk controls and a paper-trading switch
Understand it first
Before you run this, read the lesson behind the idea and how to backtest it honestly. Specs like this one are the survivors of an unknown number of trials; deflate their results accordingly.
Related specs
- MACD Bollinger Turtle Trading StrategyPine Script · Breakout · 1d
- Bollinger Wave StrategyPine Script · Breakout · 1d
- FiboBuLL Wave Strategy Based on Bollinger Bands BreakoutPine Script · Breakout · 1d
- Bollinger Band Channel Breakout Trading StrategyPine Script · Breakout · 1d
- Bollinger Bands Dynamic Breakout StrategyPine Script · Breakout · 1h
- Cross boundary Dynamic Range Quantitative Trading Strategy Based on Bollinger BandsPine Script · Breakout · 3h