Cross boundary Dynamic Range Quantitative Trading Strategy Based on Bollinger Bands
This strategy is a quantitative trading system based on the Bollinger Bands indicator, capturing market trends through dynamic range breakthrough signals. The strategy uses standard deviation channels as core…
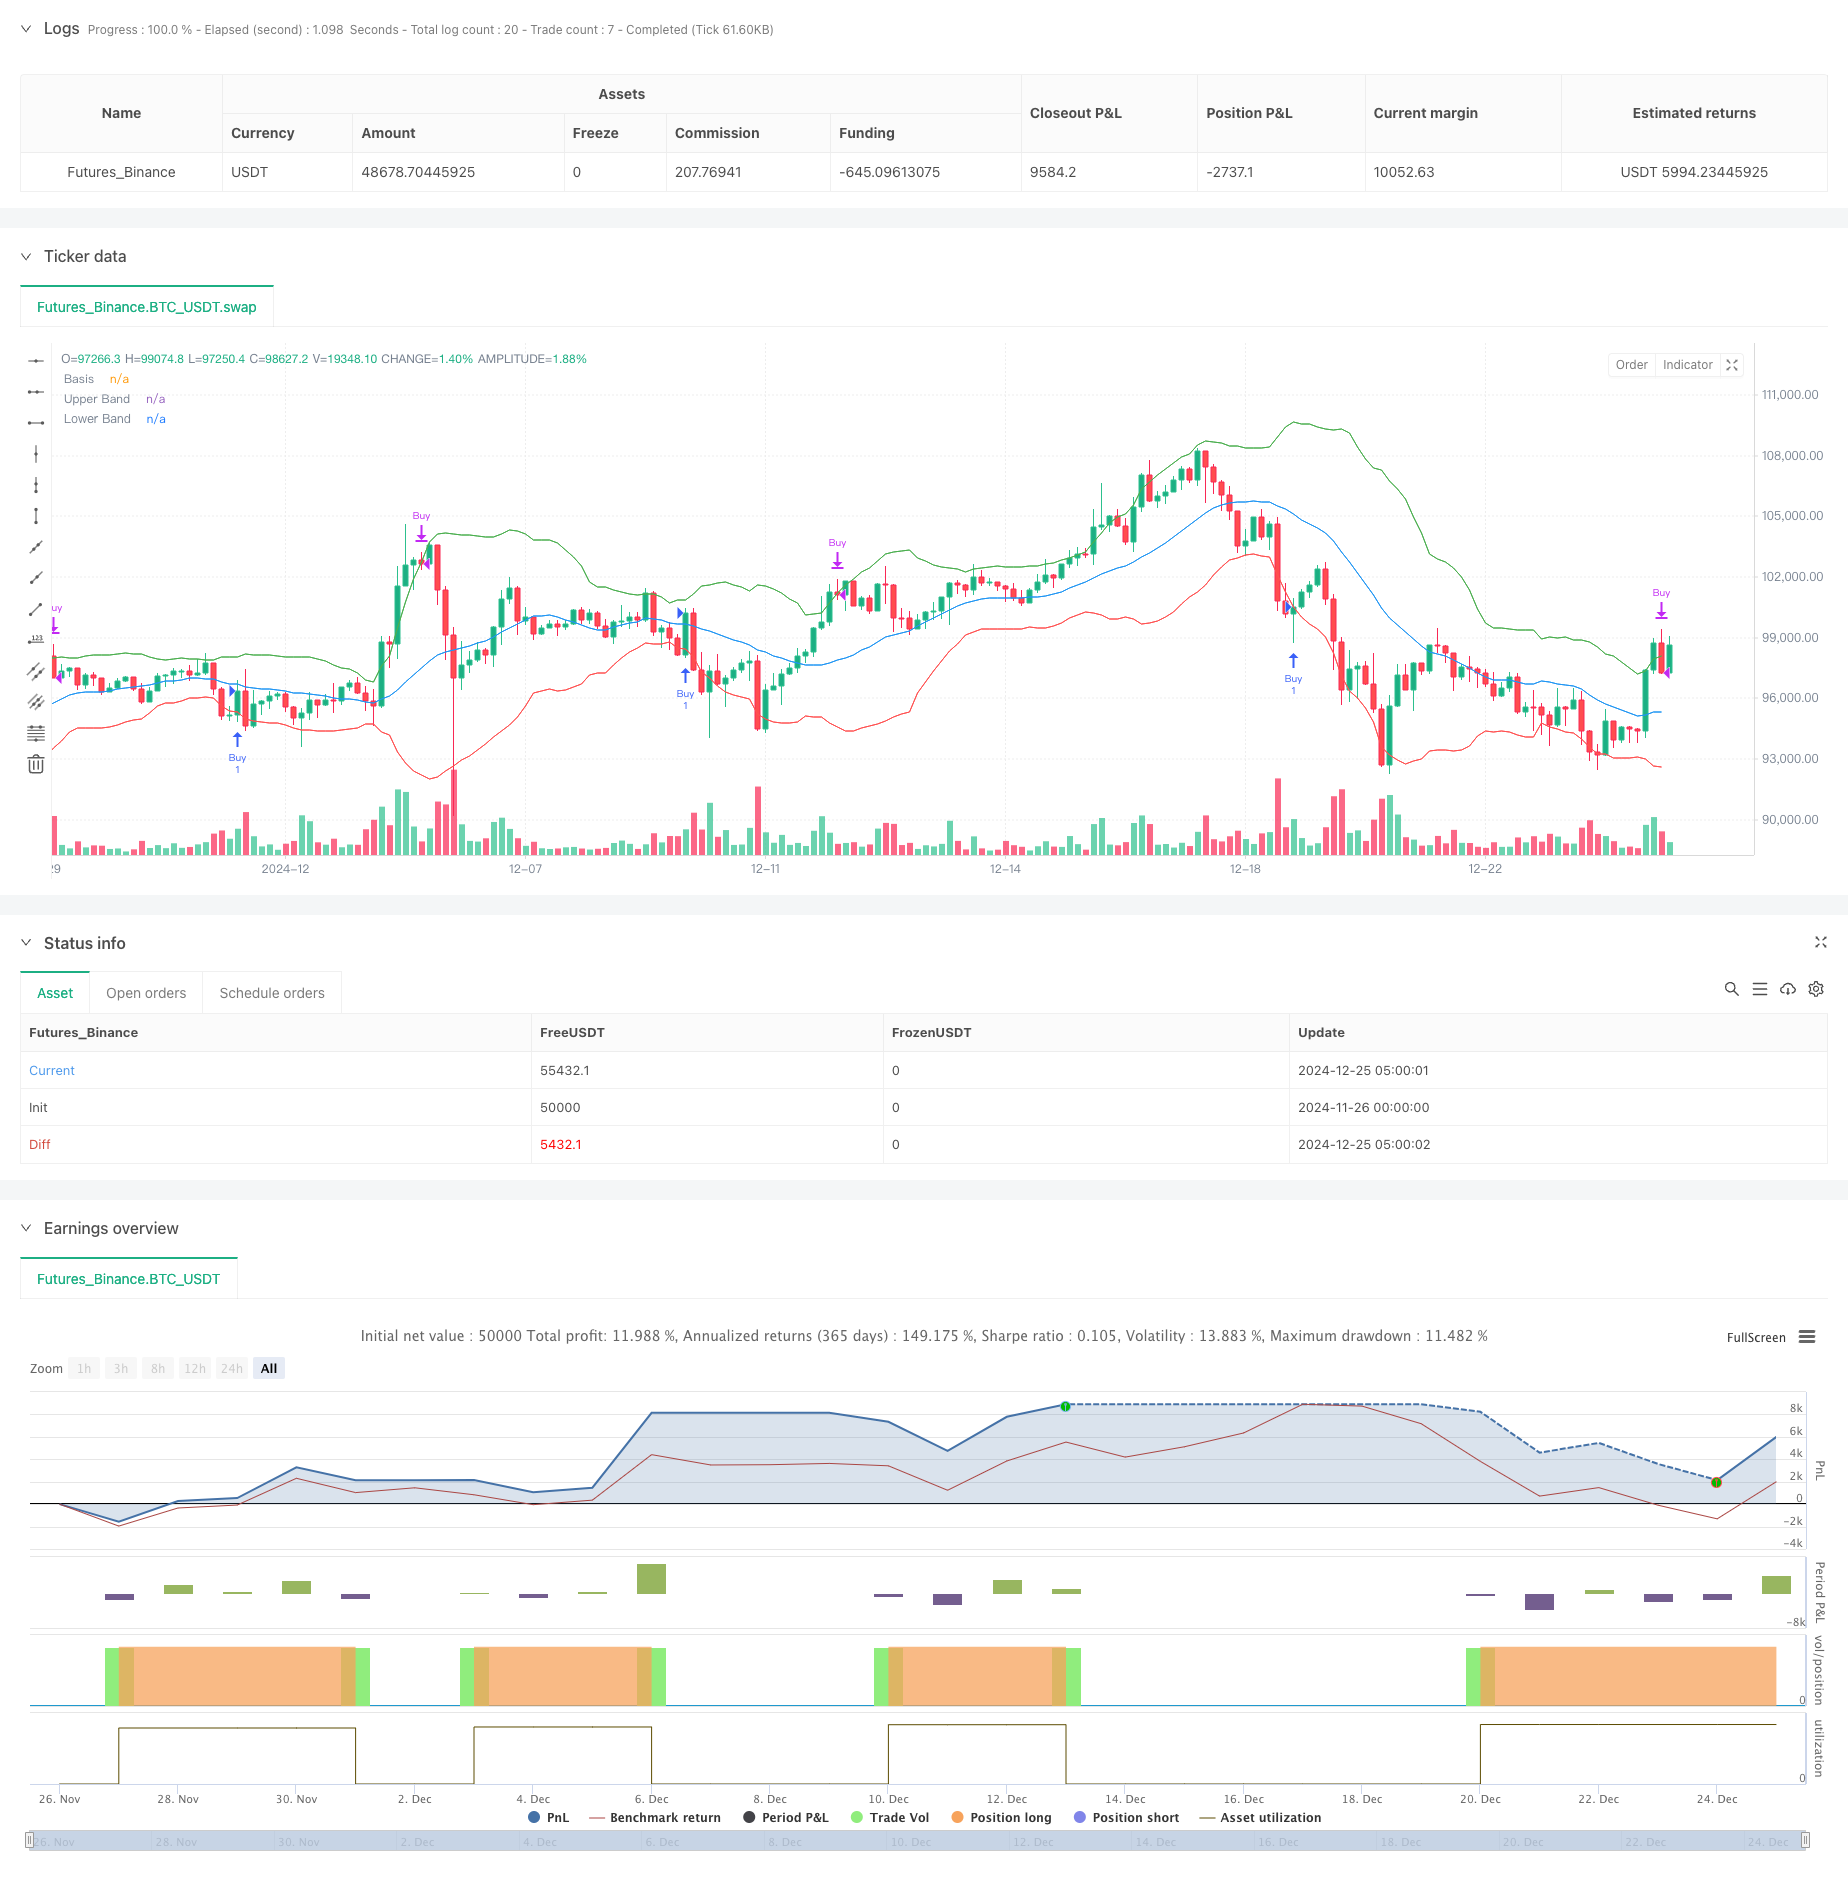
Overview
This strategy is a quantitative trading system based on the Bollinger Bands indicator, capturing market trends through dynamic range breakthrough signals. The strategy uses standard deviation channels as core indicators, combined with a fund management system to achieve full position dynamic adjustment. The overall design focuses on risk control and pursuit of stable returns.
Strategy Principles
The strategy uses a 20-period moving average as the central axis, taking 2 times the standard deviation up and down to form dynamic channels. When the price breaks through the lower rail, it is seen as an oversold signal, and the system buys with full position; when the price breaks through the upper rail, it is seen as an overbought signal, and the system sells with full position. Volatility is measured through standard deviation to ensure the dynamic adaptability of trading signals. Meanwhile, the strategy integrates a fund management system, automatically adjusting position size according to account equity. Additionally, the strategy includes an automated trading interface that can achieve automated execution through WebHook with exchanges.
Strategy Advantages
- Strong Dynamic Adaptability: Bollinger Bands, based on standard deviation calculations, can automatically adjust trading ranges according to market volatility, adapting to different market environments.
- Comprehensive Risk Management: Uses percentage position management, dynamically adjusting trading size according to account equity, effectively controlling risk.
- High Automation Level: Integrates exchange API interface, supports automatic signal execution, reducing human intervention.
- Clear Strategy Logic: Determines trading signals based on price and Bollinger Bands crossovers, with clear judgment criteria.
- Excellent Calculation Efficiency: Simple core indicator calculation, suitable for high-frequency trading environments.
Strategy Risks
- Unfavorable in Oscillating Markets: Prone to false signals in sideways oscillating markets, causing frequent trading.
- Trend Lag: Moving averages are inherently lagging indicators, possibly missing optimal entry timing during sharp fluctuations.
- Capital Efficiency: Full position trading method may lead to excessive capital utilization, increasing risk.
- Technical Dependence: Automated execution depends on network and API stability, posing technical risks.
Strategy Optimization Directions
- Signal Filtering: Recommend introducing trend confirmation indicators, such as MACD or RSI, to reduce false signals.
- Position Management: Can adopt progressive position building scheme to avoid single full position operation risk.
- Stop Loss Optimization: Add trailing stop loss mechanism to improve profit capability.
- Parameter Optimization: Recommend optimizing Bollinger Bands parameters through backtesting to improve strategy stability.
- Market Adaptation: Can add market state judgment module to use different parameters in different market environments.
Summary
This strategy constructs a complete quantitative trading system through the Bollinger Bands technical indicator, combining fund management and automated execution, possessing strong practicality. Although there are certain limitations, through the suggested optimization directions, the strategy's stability and profitability can be further enhanced. The strategy is suitable for markets with higher volatility and has reference value for investors pursuing stable returns.
Source Pine Script
/*backtest
start: 2024-11-26 00:00:00
end: 2024-12-25 08:00:00
period: 3h
basePeriod: 3h
exchanges: [{"eid":"Futures_Binance","currency":"BTC_USDT"}]
*/

//@version=5
strategy("Bollinger Bands Strategy", overlay=true, initial_capital=86, default_qty_type=strategy.percent_of_equity)

// Parameter für die Bollinger-Bänder
length = input.int(20, title="Bollinger Bands Length")
mult = input.float(2.0, title="Bollinger Bands Multiplier")

// Berechnung der Bollinger-Bänder
basis = ta.sma(close, length)
upper = basis + mult * ta.stdev(close, length)
lower = basis - mult * ta.stdev(close, length)

// Startkapital
usdt_balance = 86.0 // Anfangsbetrag in USDT
zerebro_balance = 52.0 // Anfangsbetrag in ZEREBRO

// Bedingungen für Kauf- und Verkaufssignale
longCondition = ta.crossover(close, lower)
shortCondition = ta.crossunder(close, upper)

// Kauf- und Verkaufslogik
if (longCondition and usdt_balance > 0)
    strategy.entry("Buy", strategy.long, qty=usdt_balance / close)
    usdt_balance := 0 // Alle USDT werden verwendet
    zerebro_balance += strategy.position_size // Gekaufte ZEREBRO hinzufügen

if (shortCondition and zerebro_balance > 0)
    strategy.close("Buy")
    usdt_balance += strategy.position_size * close // Verkaufserlös in USDT
    zerebro_balance := 0 // Alle ZEREBRO verkauft

// Plot der Bollinger-Bänder
plot(basis, color=color.blue, title="Basis")
plot(upper, color=color.green, title="Upper Band")
plot(lower, color=color.red, title="Lower Band")

// Alerts für Bybit-Verbindung
alertcondition(longCondition, title="Buy Alert", message='{"action": "buy", "symbol": "ZEREBRO/USDT"}')
alertcondition(shortCondition, title="Sell Alert", message='{"action": "sell", "symbol": "ZEREBRO/USDT"}')

// Automatische Verknüpfung mit Bybit
// Stellen Sie sicher, dass Sie den Webhook-URL in TradingView einstellen und korrekt mit Bybit verbinden.
Published by ChaoZhang on the FMZ strategy square · last modified 2024-12-27. Collected in the Quant Trading Vault. Unvalidated research: re-test with your own data and costs before trusting it.
Build this with AgenKit
A spec is not a trading system. Paste this into your coding agent and AgenKit runs a specialist team — architecture, test-first build, risk gates, review — with paper trading on by default.
/agenkit build a production-grade trading bot with a backtest engine, risk controls and paper trading by default from strategies/Cross-boundary-Dynamic-Range-Quantitative-Trading-Strategy-Based-on-Bollinger-Bands.md- npx agenkit install engineering-kit in your project
- Paste the command into your agent and approve each phase
- Get tests, backtest, risk controls and a paper-trading switch
Understand it first
Before you run this, read the lesson behind the idea and how to backtest it honestly. Specs like this one are the survivors of an unknown number of trials; deflate their results accordingly.
Related specs
- Bollinger Bands Dynamic Breakout StrategyPine Script · Breakout · 1h
- Momentum Breakout Moving Average StrategyPine Script · Breakout · 1d
- Momentum Breakout Trading Strategy 440964Pine Script · Breakout · 5m
- Moving Average Crossover and Upper Rail Breakthrough Impulse StrategyPine Script · Breakout · 1m
- Multi Indicator Bollinger Bands Trading StrategyPine Script · Breakout · 2h
- Quadruple Crossing StrategyPine Script · Breakout · 1h