Strategy vault / Trend following
Bollinger Bands Strategy Precision Trading for Maximum Gains
This strategy is based on the Bollinger Bands indicator and identifies optimal buy and sell opportunities by analyzing price movements relative to the upper, lower, and middle Bollinger Bands. The strategy…
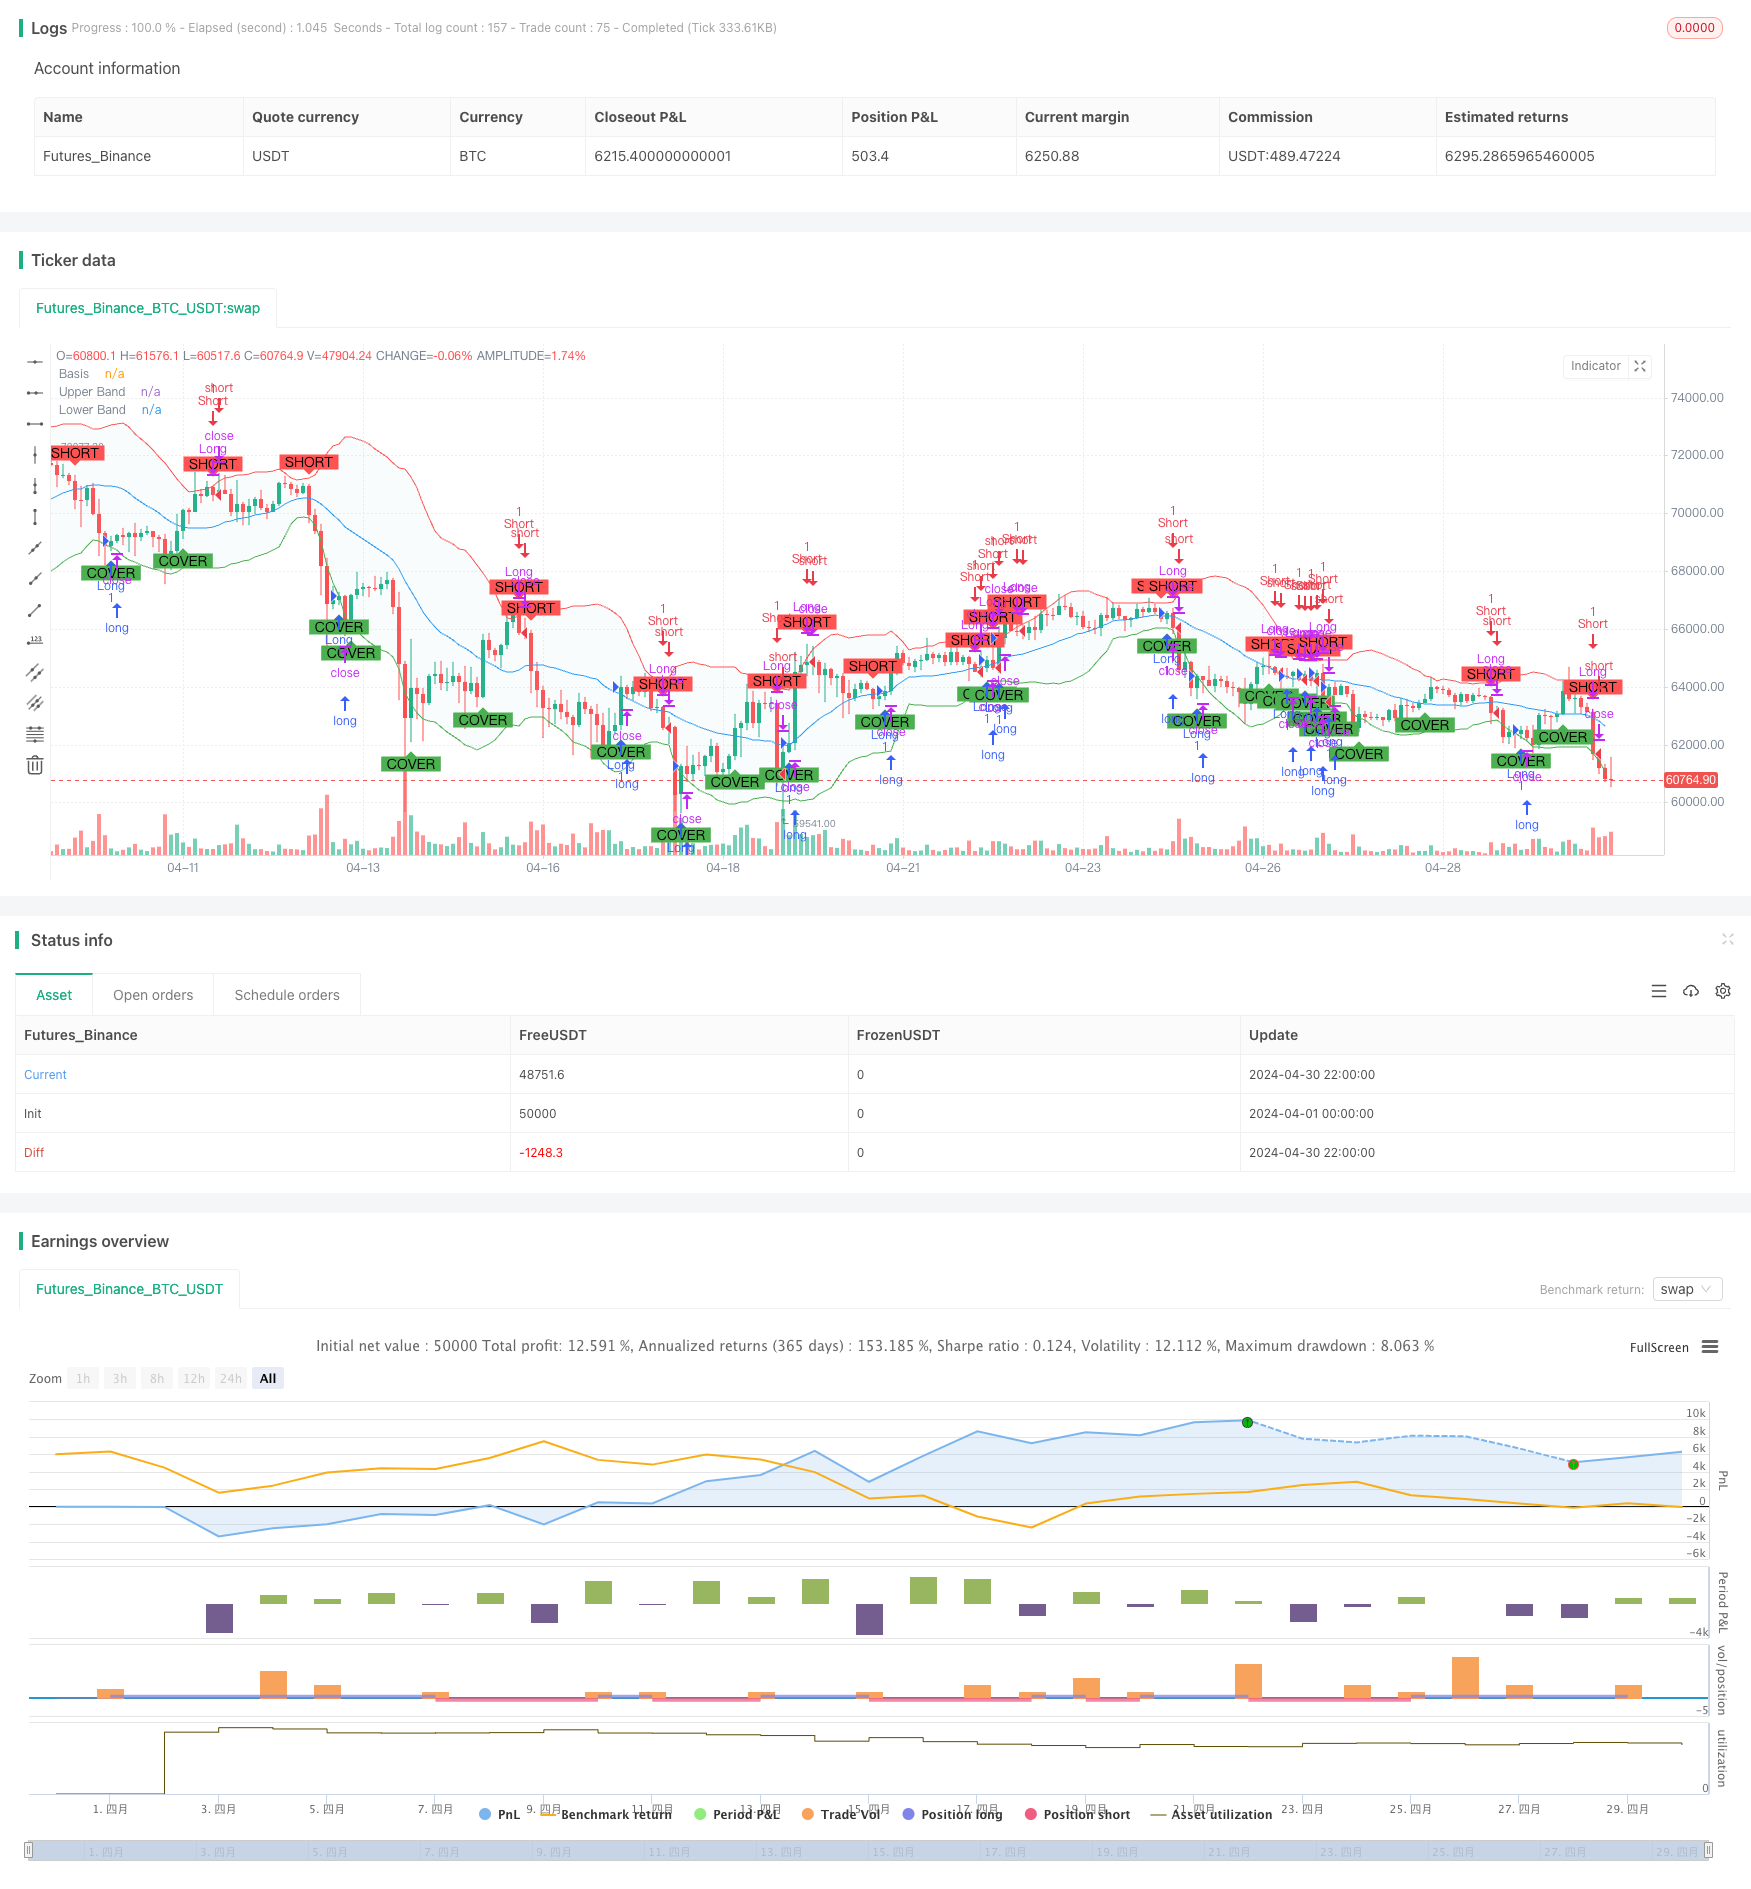
Overview
This strategy is based on the Bollinger Bands indicator and identifies optimal buy and sell opportunities by analyzing price movements relative to the upper, lower, and middle Bollinger Bands. The strategy intelligently manages both long and short positions, allowing for profiting from all market directions. Strategy parameters are customizable to accommodate different risk tolerances and market approaches. The strategy provides clear visual indicators on charts and real-time alerts for buy and sell signals.
Strategy Principles
- Buy signals are generated when the price crosses above the lower Bollinger Band or the middle band, indicating a potential upward trend.
- Sell signals are triggered when the price crosses below the upper Bollinger Band or the middle band, signaling a possible downward trend.
- Short signals are initiated when the price crosses below the upper Bollinger Band or the middle band, allowing for capitalizing on declining markets.
- Cover signals are activated when the price crosses above the lower Bollinger Band or the middle band, prompting the closing of short positions to secure profits or minimize losses.
Strategy Advantages
- Built on solid technical analysis principles, rigorously tested to ensure reliability and effectiveness.
- Easy to implement and customize on TradingView, suitable for traders of all experience levels.
- Ongoing support and updates provided to adapt to evolving market conditions and maintain optimal strategy performance.
- Dynamic entry and exit points ensure entering and exiting trades at the most advantageous moments by analyzing price movements relative to the Bollinger Bands.
- Integrated long and short position management allows for profiting from all market directions.
Strategy Risks
- In choppy market conditions, frequent trading signals may lead to overtrading and potential losses.
- The strategy relies on historical data and statistical analysis, potentially missing irrational market behavior and black swan events.
- Improper parameter selection may result in suboptimal strategy performance. Careful optimization and backtesting of parameters are necessary to suit specific markets and trading styles.
- No single strategy excels in all market conditions. The Bollinger Bands strategy may underperform in certain scenarios, so combining it with other indicators and risk management techniques is recommended.
Strategy Optimization Directions
- Incorporate additional indicators for combination logic to identify more reliable trading signals, such as RSI, MACD, etc. This helps filter out noise and reduce false positives.
- Consider introducing adaptive volatility calculation to dynamically adjust the width of the Bollinger Bands based on market conditions. This can better capture opportunities in different volatility environments.
- Implement ATR-based or percentage-based stop-loss and take-profit mechanisms to better manage risk and protect profits. This helps limit potential losses and lock in realized gains.
- Explore dynamic position sizing based on market cycles or volatility states. Allocating capital according to different market scenarios can optimize risk-adjusted returns.
Summary
The Bollinger Bands strategy provides a robust framework for generating precise trading signals based on price movements relative to the Bollinger Bands. By integrating long and short position management, customizable parameters, and intuitive visual and alert features, the strategy empowers traders to confidently seize opportunities across various market conditions. While the strategy performs well, there is room for optimization, such as incorporating additional indicators, dynamic volatility calculations, robust risk management techniques, and adaptive position sizing based on market states. With continuous refinement and adjustment, the Bollinger Bands strategy can be a valuable addition to any trader's toolbox, helping them navigate dynamic markets and maximize returns.
Source Pine Script
/*backtest
start: 2024-04-01 00:00:00
end: 2024-04-30 23:59:59
period: 2h
basePeriod: 15m
exchanges: [{"eid":"Futures_Binance","currency":"BTC_USDT"}]
*/

//@version=5
strategy("Bollinger Bands Strategy with Long and Short", overlay=true)

// Bollinger Bands settings
length = input.int(20, title="BB Length")
src = input(close, title="Source")
mult = input.float(2.0, title="BB Multiplier")

// Calculate Bollinger Bands
basis = ta.sma(src, length)
dev = mult * ta.stdev(src, length)
upper = basis + dev
lower = basis - dev

// Plot Bollinger Bands
plot(basis, color=color.blue, linewidth=1, title="Basis")
p1 = plot(upper, color=color.red, linewidth=1, title="Upper Band")
p2 = plot(lower, color=color.green, linewidth=1, title="Lower Band")
fill(p1, p2, color=color.rgb(173, 216, 230, 90))

// Long Buy and Sell conditions
buyConditionLower = ta.crossover(src, lower)
sellConditionUpper = ta.crossunder(src, upper)
buyConditionBasis = ta.crossover(src, basis)
sellConditionBasis = ta.crossunder(src, basis)

// Combine long conditions
buyCondition = buyConditionLower or buyConditionBasis
sellCondition = sellConditionUpper or sellConditionBasis

// Short Sell and Buy conditions
shortConditionUpper = ta.crossunder(src, upper)
coverConditionLower = ta.crossover(src, lower)
shortConditionBasis = ta.crossunder(src, basis)
coverConditionBasis = ta.crossover(src, basis)

// Combine short conditions
shortCondition = shortConditionUpper or shortConditionBasis
coverCondition = coverConditionLower or coverConditionBasis

// Execute strategy orders for long
if (buyCondition)
    strategy.entry("Long", strategy.long)
if (sellCondition)
    strategy.close("Long")

// Execute strategy orders for short
if (shortCondition)
    strategy.entry("Short", strategy.short)
if (coverCondition)
    strategy.close("Short")

// Plot Buy and Sell signals for long
plotshape(series=buyCondition, location=location.belowbar, color=color.green, style=shape.labelup, text="BUY", title="Buy Signal")
plotshape(series=sellCondition, location=location.abovebar, color=color.red, style=shape.labeldown, text="SELL", title="Sell Signal")

// Plot Sell and Cover signals for short
plotshape(series=shortCondition, location=location.abovebar, color=color.red, style=shape.labeldown, text="SHORT", title="Short Signal")
plotshape(series=coverCondition, location=location.belowbar, color=color.green, style=shape.labelup, text="COVER", title="Cover Signal")

// Alert conditions for long
alertcondition(buyCondition, title="Buy Alert", message="Price crossed above the lower Bollinger Band or Basis")
alertcondition(sellCondition, title="Sell Alert", message="Price crossed below the upper Bollinger Band or Basis")

// Alert conditions for short
alertcondition(shortCondition, title="Short Alert", message="Price crossed below the upper Bollinger Band or Basis")
alertcondition(coverCondition, title="Cover Alert", message="Price crossed above the lower Bollinger Band or Basis")
Published by ChaoZhang on the FMZ strategy square · last modified 2024-05-17. Collected in the Quant Trading Vault. Unvalidated research: re-test with your own data and costs before trusting it.
Build this with AgenKit
A spec is not a trading system. Paste this into your coding agent and AgenKit runs a specialist team — architecture, test-first build, risk gates, review — with paper trading on by default.
/agenkit build a production-grade trading bot with a backtest engine, risk controls and paper trading by default from strategies/Bollinger-Bands-Strategy-Precision-Trading-for-Maximum-Gains.md- npx agenkit install engineering-kit in your project
- Paste the command into your agent and approve each phase
- Get tests, backtest, risk controls and a paper-trading switch
Understand it first
Before you run this, read the lesson behind the idea and how to backtest it honestly. Specs like this one are the survivors of an unknown number of trials; deflate their results accordingly.
Related specs
- Bollinger Bands and RSI Trend Following StrategyPine Script · Trend following · 1h
- EMA and RSI Trend Trading StrategyPine Script · Trend following · 1d
- Multi Indicator Trend Following Strategy with Dynamic Risk ManagementPine Script · Trend following · 2h
- Dynamic Moving Average Trend Crossover StrategyPine Script · Trend following · 1d
- Going with the Trend Moving Average Crossover StrategyPine Script · Trend following · 1d
- Multi Technical Indicator Moving Average Crossover Trend Following Quantitative Trading StrategyPine Script · Trend following · 1h