Strategy vault / Mean reversion
Bollinger Bands Trend Reversal Strategy
This strategy utilizes Bollinger Bands and Moving Average to go LONG or SHORT when price approaches the upper or lower bands. It goes short when price breaks above the upper band and goes long when price breaks below…
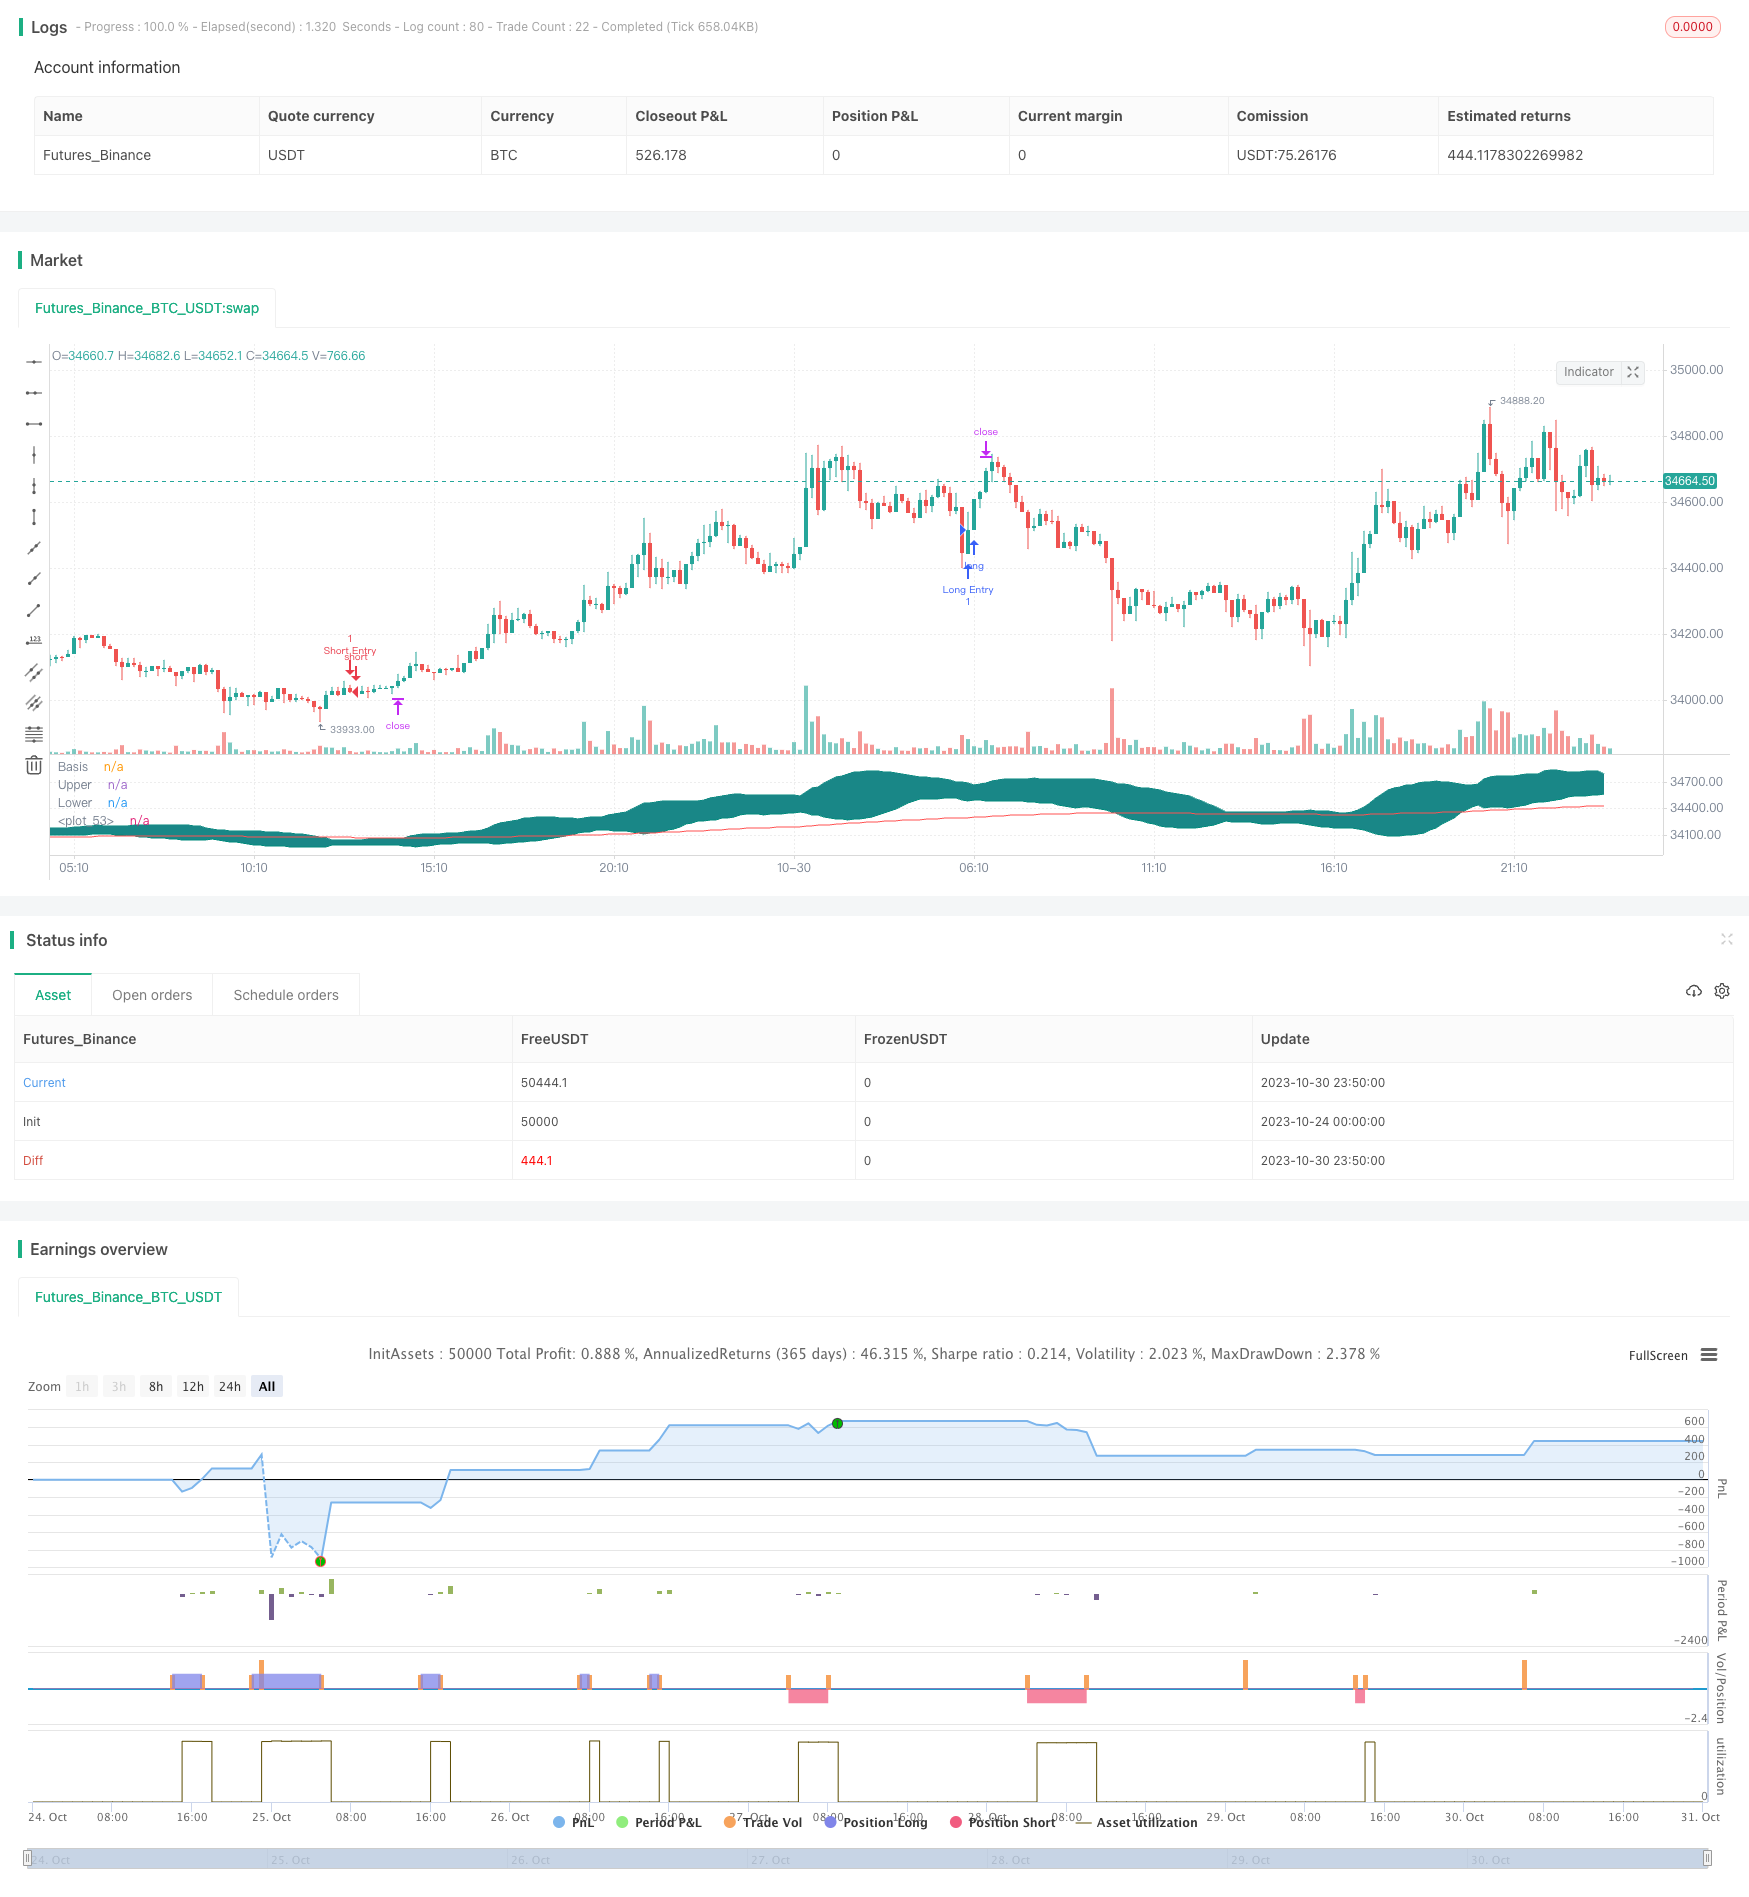
Overview
This strategy utilizes Bollinger Bands and Moving Average to go LONG or SHORT when price approaches the upper or lower bands. It goes short when price breaks above the upper band and goes long when price breaks below the lower band. The strategy combines the advantages of both trend following and mean reversion strategies, and performs well during range-bound markets.
Logic
The strategy identifies two entry signals:
Long signal: when close price hits the lower band while above EMA line, previous candle was bearish and current candle is bullish.
Short signal: when close price hits the upper band while below EMA line, previous candle was bullish and current candle is bearish.
The stop loss uses fixed stop loss. The stop loss level is set at the entry price plus/minus risk/reward ratio times the distance between entry price and take profit level.
The take profit uses dynamic take profit. Long take profit is set at the lower band. Short take profit is set at the upper band.
Advantages
Combines the strengths of both trend following and mean reversion strategies, performs well during range-bound markets.
Utilizes Bollinger Bands to identify overbought and oversold levels, improving accuracy of reversal signals.
Fixed stop loss facilitates risk management.
Dynamic take profit allows maximization of profits.
Risks
Breakout strategies are susceptible to stop runs. Need to beware of false breakouts.
Frequent stop loss triggers when market is too choppy.
Fixed stop loss is not adaptive to market volatility. Can be too wide or too tight.
Poor parameter tuning of Bollinger Bands can lead to mediocre results.
Enhancement
Incorporate RSI indicator to filter entry signals. For example, only go long if RSI is above 50, and only go short if RSI is below 50. This avoids bad signals.
Implement adaptive stop loss that adjusts stop distance based on volatility. E.g. use ATR to set dynamic stop loss.
Optimize Bollinger Bands parameters to find best parameter combinations.
Test different EMA periods to enhance the EMA's support/resistance effect.
Summary
The strategy combines trend and reversal, entering overbought/oversold levels identified by Bollinger Bands. It maximizes profits through dynamic take profit. Performs well during range-bound markets. Be wary of stop runs. Fine tune parameters to optimize performance. Overall a practical and effective strategy.
Parameters
| Name | Default | What it controls |
|---|---|---|
| v_input_1 | 20 | length |
| v_input_2_close | 0 | Source: close | high | low | open | hl2 | hlc3 | hlcc4 | ohlc4 |
| v_input_3 | 2 | StdDev |
| v_input_4 | 200 | EMA Input |
| v_input_5 | 1.5 | Risk/Reward Ratio |
| v_input_6 | false | Offset |
Source Pine Script
/*backtest
start: 2023-10-24 00:00:00
end: 2023-10-31 00:00:00
period: 10m
basePeriod: 1m
exchanges: [{"eid":"Futures_Binance","currency":"BTC_USDT"}]
*/

//@version=4

// Welcome to yet another script. This script was a lot easier since I was stuck for so long on the Donchian Channels one and learned so much from that one that I could use in this one
// This code should be a lot cleaner compared to the Donchian Channels, but we'll leave that up to the pro's
// This strategy has two entry signals, long = when price hits lower band, while above EMA, previous candle was bearish and current candle is bullish
// Short = when price hits upper band, while below EMA, previous candle was bullish and current candle is bearish
// Take profits are the opposite side's band(lower band for long signals, upper band for short signals). This means our take profit price will change per bar
// Our stop loss doesn't change, it's the difference between entry price and the take profit target divided by the input risk reward
// At the time of writing this, I could probably calculate that much easier by simply multiplying the opposite band by the input risk reward ratio
// Since I want to get this script out and working on the next one, I won't clean that up, I'm sorry
// strategy(shorttitle="BB Trending Reverse Strategy", title="Bollinger Bands Trending Reverse Strategy", overlay=true, default_qty_type = strategy.cash, default_qty_value = 150, initial_capital = 1000, currency = currency.USD, commission_type = "percent", commission_value = 0.036)

// The built-in Bollinger Band indicator inputs and variables, added some inputs of my own and organised the code
length              = input(20, minval=1)
src                 = input(close, title="Source")
mult                = input(2.0, minval=0.001, maxval=50, title="StdDev")
emaInput            = input(title = "EMA Input", type = input.integer, defval = 200, minval = 10, maxval = 400, step = 1)
riskreward          = input(title = "Risk/Reward Ratio", type = input.float, defval = 1.50, minval = 0.01, maxval = 100, step = 0.01)
offset              = input(0, "Offset", type = input.integer, minval = -500, maxval = 500)
basis               = sma(src, length)
dev                 = mult * stdev(src, length)
upper               = basis + dev
lower               = basis - dev
ema                 = ema(close, emaInput)

// These are our conditions as explained above
entryLong           = low[1] <= lower[1] and low <= lower and low > ema
entryShort          = high[1] >= upper[1] and high >= upper and high < ema
reversecandleLong   = close > open and close[1] < open[1]
reversecandleShort  = close < open and close[1] > open[1]
var stopLong        = 0.0
var stopShort       = 0.0

// These are our entry signals, notice how the stop condition is within the if statement while the strategy.exit is outside of the if statement, this way the take profit targets trails up or down depending on what the price does
if reversecandleLong and entryLong and strategy.position_size == 0
    stopLong := (((close / upper - 1) * riskreward + 1) * close)
    strategy.entry("Long Entry", strategy.long, comment = "Long Entry")

strategy.exit("Exit Long", "Long Entry", limit = upper, stop = stopLong, comment = "Exit Long")

if reversecandleShort and entryShort and strategy.position_size == 0
    stopShort := (((close / lower - 1) / riskreward + 1) * close)
    strategy.entry("Short Entry", strategy.short, comment = "Short Entry")

strategy.exit("Exit Short", "Short Entry", limit = lower, stop = stopShort, comment = "Exit Short")


// The built-in Bollinger Band plots
plot(basis, "Basis", color=#872323, offset = offset)
p1 = plot(upper, "Upper", color=color.teal, offset = offset)
p2 = plot(lower, "Lower", color=color.teal, offset = offset)
fill(p1, p2, title = "Background", color=#198787, transp=95)
plot(ema, color=color.red)

// These plots are to check the stoplosses, they can  make a mess of your chart so only use these if you want to make sure these work
// plot(stopLong)
// plot(stopShort)Published by ChaoZhang on the FMZ strategy square · last modified 2023-11-01. Collected in the Quant Trading Vault. Unvalidated research: re-test with your own data and costs before trusting it.
Build this with AgenKit
A spec is not a trading system. Paste this into your coding agent and AgenKit runs a specialist team — architecture, test-first build, risk gates, review — with paper trading on by default.
/agenkit build a production-grade trading bot with a backtest engine, risk controls and paper trading by default from strategies/Bollinger-Bands-Trend-Reversal-Strategy.md- npx agenkit install engineering-kit in your project
- Paste the command into your agent and approve each phase
- Get tests, backtest, risk controls and a paper-trading switch
Understand it first
Before you run this, read the lesson behind the idea and how to backtest it honestly. Specs like this one are the survivors of an unknown number of trials; deflate their results accordingly.
Related specs
- MACD RSI and EMA StrategyPine Script · Mean reversion · 1d
- Advanced Momentum EMA Trend Following with RSI Overbought Oversold Trading StrategyPine Script · Mean reversion · 1d
- Advanced Quantitative Trading Strategy Combining RSI Divergence and Moving AveragesPine Script · Mean reversion · 1h
- Oma and Apollo Dual Rail Trading StrategyPine Script · Mean reversion · 5m
- Reversal Trading Strategy with Bollinger Bands RSI ADX and ATRPine Script · Mean reversion · 1h
- CCTBBO Reversal Tracking StrategyPine Script · Mean reversion · 45m