Breakout and Intelligent Bollinger Bands Price Channel Strategy
This strategy is a breakout strategy that combines multiple timeframes (1 min, 5 min, 15 min, 1 hour and 4 hours) to detect support and resistance areas on the chart.
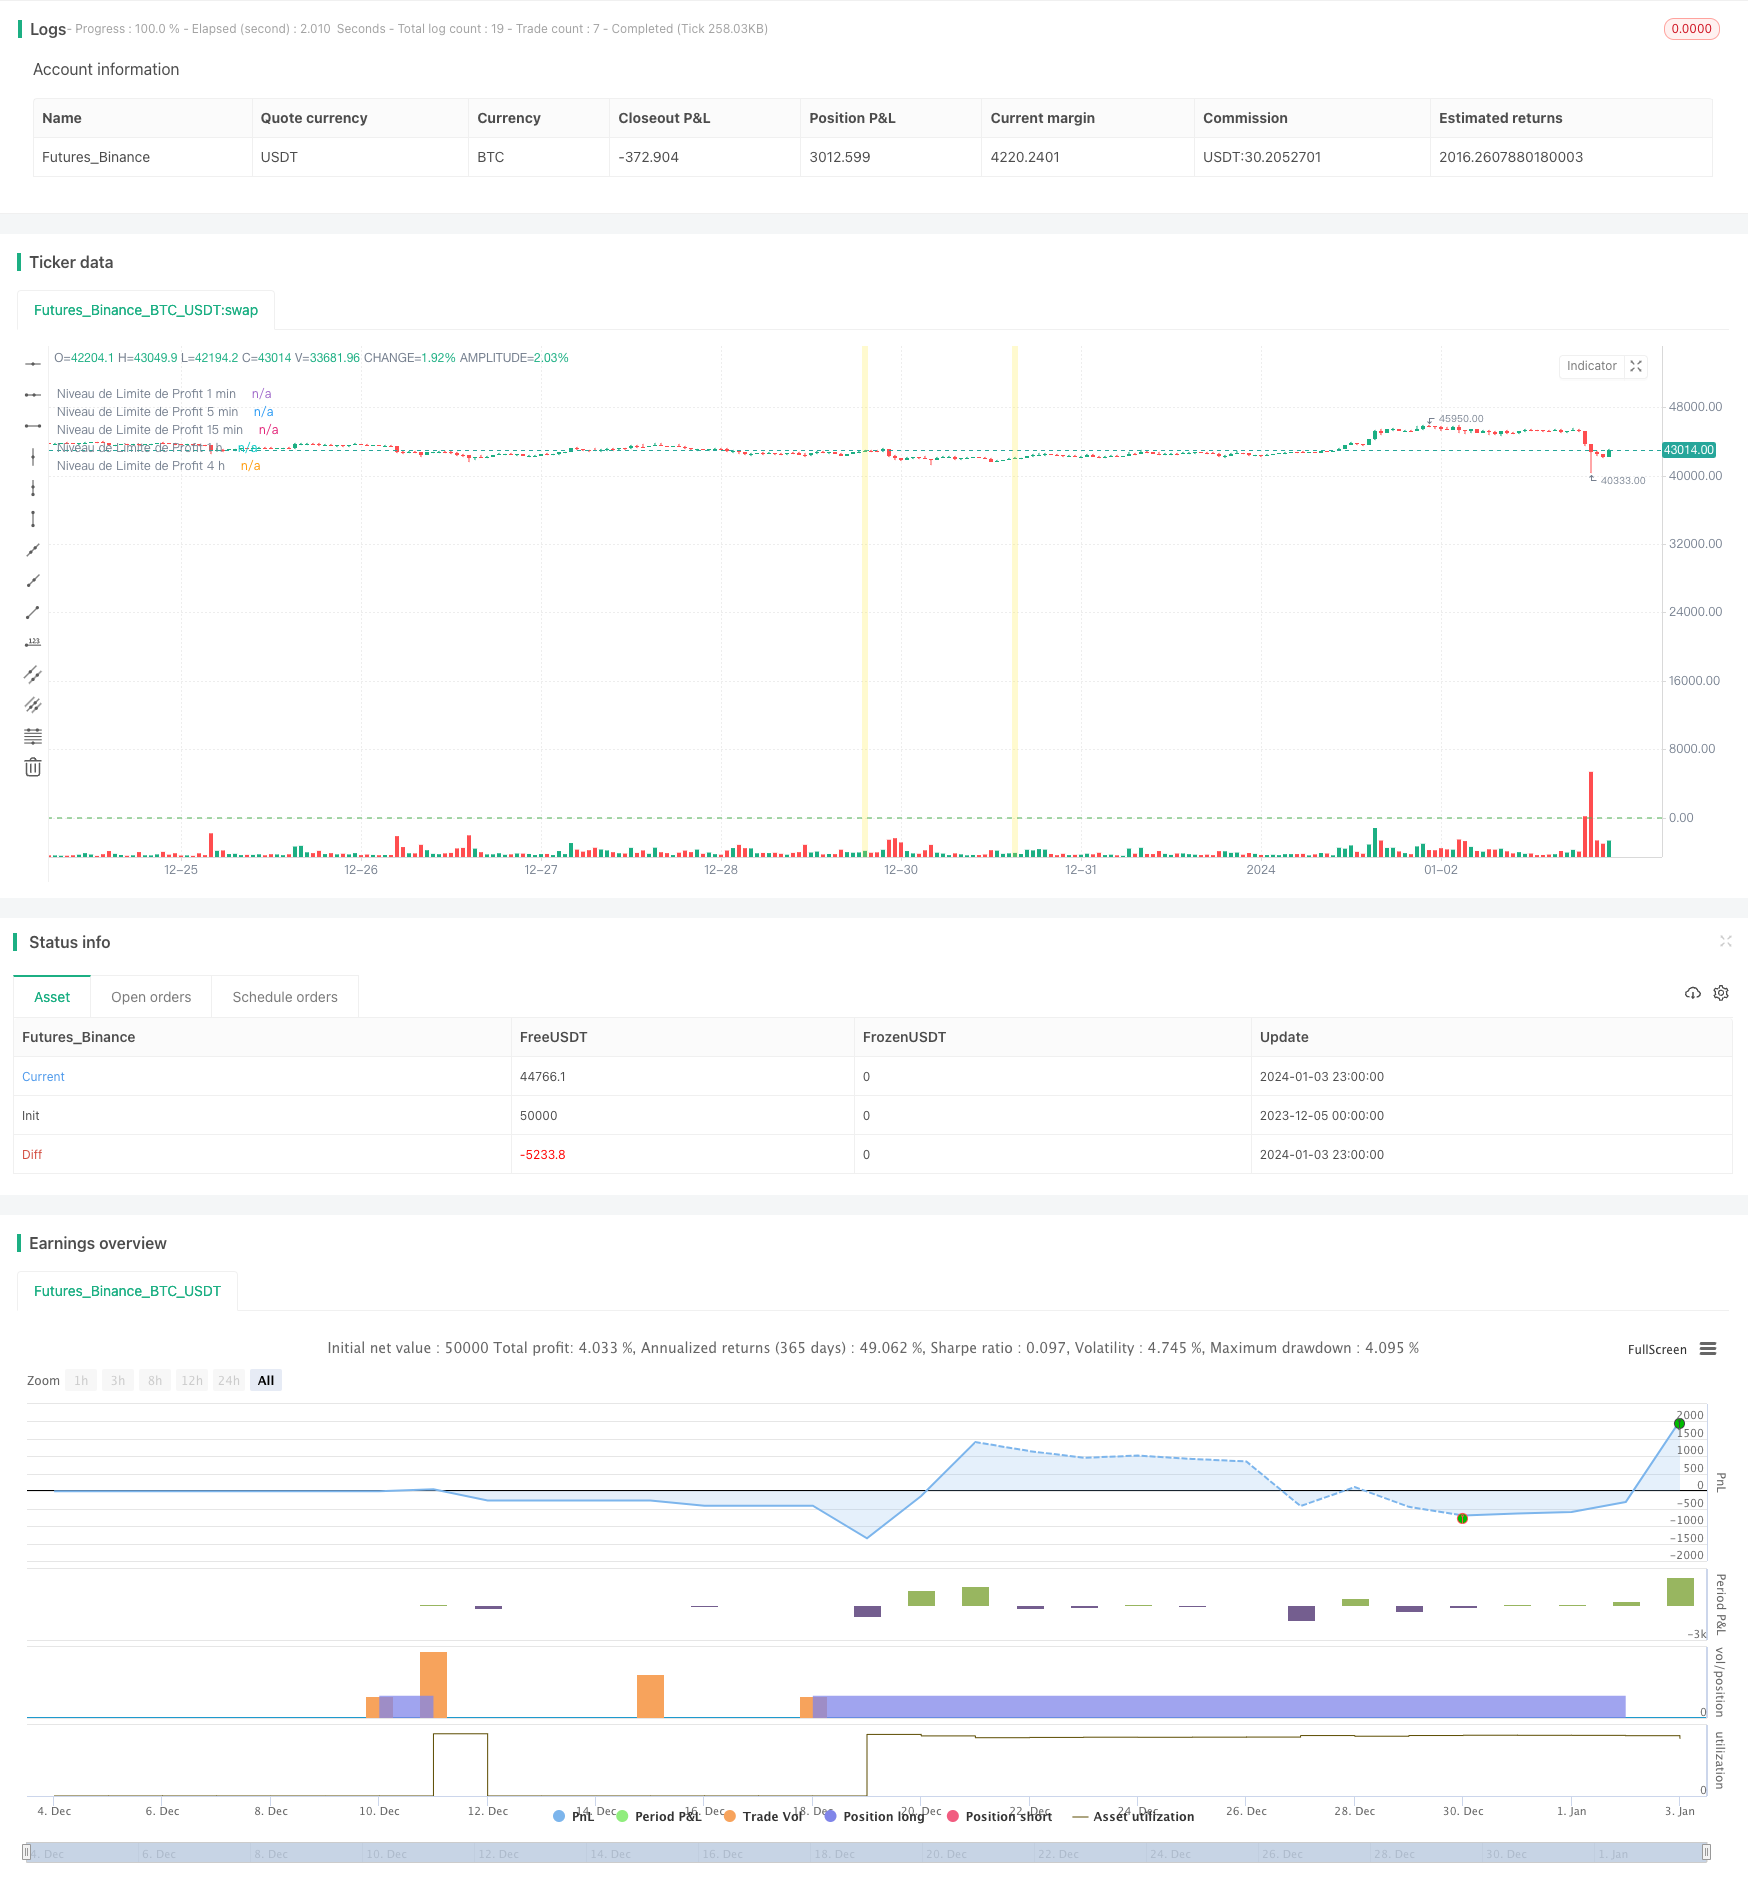
Overview
This strategy is a breakout strategy that combines multiple timeframes (1 min, 5 min, 15 min, 1 hour and 4 hours) to detect support and resistance areas on the chart.
Strategy Logic
The strategy uses Bollinger Bands and price channels to determine support and resistance zones. First, it calculates the Simple Moving Average (SMA) and Standard Deviation (STDEV) of closing prices for each timeframe to determine the upper and lower bands. It then detects "Breaker Blocks" which are determined based on price breakouts from support or resistance levels along with trading volume. A Breaker Block forms when price breaks out of a support or resistance level with high volume.
Once a Breaker Block is detected, a buy signal is generated if price breaks above the lower band, and a sell signal is generated if it breaks below the upper band. The strategy also plots price channels for each timeframe, representing support and resistance levels.
In addition, the strategy sets profit limit levels for each timeframe. This means price levels assigned to positions should be closed out at a profit. Stop-loss levels are also set to limit losses.
Advantage Analysis
- Utilizes multi timeframe analysis for more comprehensive market trend judgment
- Combining Breaker Blocks, Bollinger Bands channels and volume makes signals more reliable
- Setting profit and stop loss targets helps with risk control
Risk Analysis
- Poor Bollinger Bands parameter setting may cause false signals
- Breakouts could be short term market noise, leading to whipsaws
- Multi timeframe judgment increases strategy complexity
Risks can be further mitigated by optimizing Bollinger parameters, increasing holding period or setting stops.
Optimization Directions
This strategy can be optimized in several aspects:
Optimize Bollinger parameters for better reflection of true support and resistance
Add machine learning algorithms to judge breakout direction and momentum
Incorporate volatility indices to determine optimal entry and exit timing
Combine more indicators like MACD, KD to determine trends and energy
Summary
This strategy integrates multi-timeframe technical analysis, manages risks through breakout trading and profit stop loss management. It is a flexible and reliable breakout system. But parameter tuning and risk control according to actual markets need continual testing and optimization.
Parameters
| Name | Default | What it controls |
|---|---|---|
| v_input_int_1 | 14 | Longueur 1 min |
| v_input_float_1 | 2 | Déviations 1 min |
| v_input_float_2 | true | Multiplicateur 1 min |
| v_input_float_3 | 0.618 | Niveau de Fibonacci 1 min |
| v_input_int_2 | 3 | Décalage de Displacement 1 min |
| v_input_float_4 | true | Seuil de Volume 1 min |
| v_input_float_5 | false | Niveau de Limite de Profit 1 min |
| v_input_int_3 | 14 | Longueur 5 min |
| v_input_float_6 | 2 | Déviations 5 min |
| v_input_float_7 | true | Multiplicateur 5 min |
| v_input_float_8 | 0.618 | Niveau de Fibonacci 5 min |
| v_input_int_4 | 3 | Décalage de Displacement 5 min |
| v_input_float_9 | true | Seuil de Volume 5 min |
| v_input_float_10 | false | Niveau de Limite de Profit 5 min |
| v_input_int_5 | 14 | Longueur 15 min |
| v_input_float_11 | 2 | Déviations 15 min |
| v_input_float_12 | true | Multiplicateur 15 min |
| v_input_float_13 | 0.618 | Niveau de Fibonacci 15 min |
| v_input_int_6 | 3 | Décalage de Displacement 15 min |
| v_input_float_14 | true | Seuil de Volume 15 min |
| v_input_float_15 | false | Niveau de Limite de Profit 15 min |
| v_input_int_7 | 14 | Longueur 1 h |
| v_input_float_16 | 2 | Déviations 1 h |
| v_input_float_17 | true | Multiplicateur 1 h |
| v_input_float_18 | 0.618 | Niveau de Fibonacci 1 h |
| v_input_int_8 | 3 | Décalage de Displacement 1 h |
| v_input_float_19 | true | Seuil de Volume 1 h |
| v_input_float_20 | false | Niveau de Limite de Profit 1 h |
| v_input_int_9 | 14 | Longueur 4 h |
| v_input_float_21 | 2 | Déviations 4 h |
| v_input_float_22 | true | Multiplicateur 4 h |
| v_input_float_23 | 0.618 | Niveau de Fibonacci 4 h |
| v_input_int_10 | 3 | Décalage de Displacement 4 h |
| v_input_float_24 | true | Seuil de Volume 4 h |
| v_input_float_25 | false | Niveau de Limite de Profit 4 h |
Source Pine Script
/*backtest
start: 2023-12-05 00:00:00
end: 2024-01-04 00:00:00
period: 1h
basePeriod: 15m
exchanges: [{"eid":"Futures_Binance","currency":"BTC_USDT"}]
*/

//@version=5
strategy("DZ Strategy ICT", overlay=true)

// Paramètres de l'indicateur
length1 = input.int(14, minval=1, title='Longueur 1 min')
deviations1 = input.float(2.0, title='Déviations 1 min')
multiplier1 = input.float(1.0, minval=0.1, maxval=10, title='Multiplicateur 1 min')
fibonacciLevel1 = input.float(0.618, title='Niveau de Fibonacci 1 min')
displacement1 = input.int(3, minval=1, title='Décalage de Displacement 1 min')
volumeThreshold1 = input.float(1.0, minval=0, title='Seuil de Volume 1 min')
fibLevelInput1 = input.float(0.0, "Niveau de Limite de Profit 1 min", minval=0.0)

length5 = input.int(14, minval=1, title='Longueur 5 min')
deviations5 = input.float(2.0, title='Déviations 5 min')
multiplier5 = input.float(1.0, minval=0.1, maxval=10, title='Multiplicateur 5 min')
fibonacciLevel5 = input.float(0.618, title='Niveau de Fibonacci 5 min')
displacement5 = input.int(3, minval=1, title='Décalage de Displacement 5 min')
volumeThreshold5 = input.float(1.0, minval=0, title='Seuil de Volume 5 min')
fibLevelInput5 = input.float(0.0, "Niveau de Limite de Profit 5 min", minval=0.0)

length15 = input.int(14, minval=1, title='Longueur 15 min')
deviations15 = input.float(2.0, title='Déviations 15 min')
multiplier15 = input.float(1.0, minval=0.1, maxval=10, title='Multiplicateur 15 min')
fibonacciLevel15 = input.float(0.618, title='Niveau de Fibonacci 15 min')
displacement15 = input.int(3, minval=1, title='Décalage de Displacement 15 min')
volumeThreshold15 = input.float(1.0, minval=0, title='Seuil de Volume 15 min')
fibLevelInput15 = input.float(0.0, "Niveau de Limite de Profit 15 min", minval=0.0)

length60 = input.int(14, minval=1, title='Longueur 1 h')
deviations60 = input.float(2.0, title='Déviations 1 h')
multiplier60 = input.float(1.0, minval=0.1, maxval=10, title='Multiplicateur 1 h')
fibonacciLevel60 = input.float(0.618, title='Niveau de Fibonacci 1 h')
displacement60 = input.int(3, minval=1, title='Décalage de Displacement 1 h')
volumeThreshold60 = input.float(1.0, minval=0, title='Seuil de Volume 1 h')
fibLevelInput60 = input.float(0.0, "Niveau de Limite de Profit 1 h", minval=0.0)

length240 = input.int(14, minval=1, title='Longueur 4 h')
deviations240 = input.float(2.0, title='Déviations 4 h')
multiplier240 = input.float(1.0, minval=0.1, maxval=10, title='Multiplicateur 4 h')
fibonacciLevel240 = input.float(0.618, title='Niveau de Fibonacci 4 h')
displacement240 = input.int(3, minval=1, title='Décalage de Displacement 4 h')
volumeThreshold240 = input.float(1.0, minval=0, title='Seuil de Volume 4 h')
fibLevelInput240 = input.float(0.0, "Niveau de Limite de Profit 4 h", minval=0.0)

// Calcul des supports et résistances pour chaque plage de temps
basis1 = ta.sma(close, length1)
range_1 = multiplier1 * ta.stdev(close, length1)
upper1 = basis1 + deviations1 * range_1
lower1 = basis1 - deviations1 * range_1

basis5 = ta.sma(close, length5)
range_5 = multiplier5 * ta.stdev(close, length5)
upper5 = basis5 + deviations5 * range_5
lower5 = basis5 - deviations5 * range_5

basis15 = ta.sma(close, length15)
range_15 = multiplier15 * ta.stdev(close, length15)
upper15 = basis15 + deviations15 * range_15
lower15 = basis15 - deviations15 * range_15

basis60 = ta.sma(close, length60)
range_60 = multiplier60 * ta.stdev(close, length60)
upper60 = basis60 + deviations60 * range_60
lower60 = basis60 - deviations60 * range_60

basis240 = ta.sma(close, length240)
range_240 = multiplier240 * ta.stdev(close, length240)
upper240 = basis240 + deviations240 * range_240
lower240 = basis240 - deviations240 * range_240

// Calcul du volume moyen sur chaque période donnée
averageVolume1 = ta.sma(volume, length1)
averageVolume5 = ta.sma(volume, length5)
averageVolume15 = ta.sma(volume, length15)
averageVolume60 = ta.sma(volume, length60)
averageVolume240 = ta.sma(volume, length240)

// Détection du Breaker Block en fonction du déplacement et du volume pour chaque plage de temps
breakerBlock1 = ta.crossover(close[displacement1], lower1) and volume > volumeThreshold1 * averageVolume1
breakerBlock1 := breakerBlock1 or (ta.crossunder(close[displacement1], upper1) and volume > volumeThreshold1 * averageVolume1)

breakerBlock5 = ta.crossover(close[displacement5], lower5) and volume > volumeThreshold5 * averageVolume5
breakerBlock5 := breakerBlock5 or (ta.crossunder(close[displacement5], upper5) and volume > volumeThreshold5 * averageVolume5)

breakerBlock15 = ta.crossover(close[displacement15], lower15) and volume > volumeThreshold15 * averageVolume15
breakerBlock15 := breakerBlock15 or (ta.crossunder(close[displacement15], upper15) and volume > volumeThreshold15 * averageVolume15)

breakerBlock60 = ta.crossover(close[displacement60], lower60) and volume > volumeThreshold60 * averageVolume60
breakerBlock60 := breakerBlock60 or (ta.crossunder(close[displacement60], upper60) and volume > volumeThreshold60 * averageVolume60)

breakerBlock240 = ta.crossover(close[displacement240], lower240) and volume > volumeThreshold240 * averageVolume240
breakerBlock240 := breakerBlock240 or (ta.crossunder(close[displacement240], upper240) and volume > volumeThreshold240 * averageVolume240)

// Affichage du Breaker Block sur le graphique
bgcolor(breakerBlock1 ? color.new(color.yellow, 70) : na)
bgcolor(breakerBlock5 ? color.new(color.yellow, 70) : na)
bgcolor(breakerBlock15 ? color.new(color.yellow, 70) : na)
bgcolor(breakerBlock60 ? color.new(color.yellow, 70) : na)
bgcolor(breakerBlock240 ? color.new(color.yellow, 70) : na)

// Définition de la zone limite de l'ordre de profit pour chaque plage de temps
fibLevel1 = basis1 * fibonacciLevel1
fibLevel5 = basis5 * fibonacciLevel5
fibLevel15 = basis15 * fibonacciLevel15
fibLevel60 = basis60 * fibonacciLevel60
fibLevel240 = basis240 * fibonacciLevel240

// Signal d'achat modifié en fonction du Breaker Block et du déplacement pour chaque plage de temps
buySignal1 = ta.crossover(close[displacement1], lower1) and volume > volumeThreshold1 * averageVolume1
buySignal5 = ta.crossover(close[displacement5], lower5) and volume > volumeThreshold5 * averageVolume5
buySignal15 = ta.crossover(close[displacement15], lower15) and volume > volumeThreshold15 * averageVolume15
buySignal60 = ta.crossover(close[displacement60], lower60) and volume > volumeThreshold60 * averageVolume60
buySignal240 = ta.crossover(close[displacement240], lower240) and volume > volumeThreshold240 * averageVolume240

// Signal de vente modifié en fonction du Breaker Block et du déplacement pour chaque plage de temps
sellSignal1 = ta.crossunder(close[displacement1], upper1) and volume > volumeThreshold1 * averageVolume1
sellSignal5 = ta.crossunder(close[displacement5], upper5) and volume > volumeThreshold5 * averageVolume5
sellSignal15 = ta.crossunder(close[displacement15], upper15) and volume > volumeThreshold15 * averageVolume15
sellSignal60 = ta.crossunder(close[displacement60], upper60) and volume > volumeThreshold60 * averageVolume60
sellSignal240 = ta.crossunder(close[displacement240], upper240) and volume > volumeThreshold240 * averageVolume240


// Tracé des niveaux de limite de profit pour chaque plage de temps
hline(fibLevelInput1, color=color.green, linestyle=hline.style_dashed, title="Niveau de Limite de Profit 1 min")
hline(fibLevelInput5, color=color.green, linestyle=hline.style_dashed, title="Niveau de Limite de Profit 5 min")
hline(fibLevelInput15, color=color.green, linestyle=hline.style_dashed, title="Niveau de Limite de Profit 15 min")
hline(fibLevelInput60, color=color.green, linestyle=hline.style_dashed, title="Niveau de Limite de Profit 1 h")
hline(fibLevelInput240, color=color.green, linestyle=hline.style_dashed, title="Niveau de Limite de Profit 4 h")

// Définition des ordres de vente et d'achat pour chaque plage de temps
if buySignal1
    strategy.entry("Achat 1 min", strategy.long)

if sellSignal1
    strategy.entry("Vente 1 min", strategy.short)

if buySignal5
    strategy.entry("Achat 5 min", strategy.long)

if sellSignal5
    strategy.entry("Vente 5 min", strategy.short)

if buySignal15
    strategy.entry("Achat 15 min", strategy.long)

if sellSignal15
    strategy.entry("Vente 15 min", strategy.short)

if buySignal60
    strategy.entry("Achat 1 h", strategy.long)

if sellSignal60
    strategy.entry("Vente 1 h", strategy.short)

if buySignal240
    strategy.entry("Achat 4 h", strategy.long)

if sellSignal240
    strategy.entry("Vente 4 h", strategy.short)

// Configuration des ordres de sortie (Take Profit) pour chaque plage de temps
profitRatio = 2
stopLossRatio = 1

stopLossLevel1 = strategy.position_avg_price * (1 - stopLossRatio / (stopLossRatio + profitRatio))
stopLossLevel5 = strategy.position_avg_price * (1 - stopLossRatio / (stopLossRatio + profitRatio))
stopLossLevel15 = strategy.position_avg_price * (1 - stopLossRatio / (stopLossRatio + profitRatio))
stopLossLevel60 = strategy.position_avg_price * (1 - stopLossRatio / (stopLossRatio + profitRatio))
stopLossLevel240 = strategy.position_avg_price * (1 - stopLossRatio / (stopLossRatio + profitRatio))

strategy.exit("Stop Loss 1 min", "Achat 1 min", stop=stopLossLevel1)
strategy.exit("Stop Loss 1 min", "Vente 1 min", stop=stopLossLevel1)

strategy.exit("Stop Loss 5 min", "Achat 5 min", stop=stopLossLevel5)
strategy.exit("Stop Loss 5 min", "Vente 5 min", stop=stopLossLevel5)

strategy.exit("Stop Loss 15 min", "Achat 15 min", stop=stopLossLevel15)
strategy.exit("Stop Loss 15 min", "Vente 15 min", stop=stopLossLevel15)

strategy.exit("Stop Loss 1 h", "Achat 1 h", stop=stopLossLevel60)
strategy.exit("Stop Loss 1 h", "Vente 1 h", stop=stopLossLevel60)Published by ChaoZhang on the FMZ strategy square · last modified 2024-01-05. Collected in the Quant Trading Vault. Unvalidated research: re-test with your own data and costs before trusting it.
Build this with AgenKit
A spec is not a trading system. Paste this into your coding agent and AgenKit runs a specialist team — architecture, test-first build, risk gates, review — with paper trading on by default.
/agenkit build a production-grade trading bot with a backtest engine, risk controls and paper trading by default from strategies/Breakout-and-Intelligent-Bollinger-Bands-Price-Channel-Strategy.md- npx agenkit install engineering-kit in your project
- Paste the command into your agent and approve each phase
- Get tests, backtest, risk controls and a paper-trading switch
Understand it first
Before you run this, read the lesson behind the idea and how to backtest it honestly. Specs like this one are the survivors of an unknown number of trials; deflate their results accordingly.
Related specs
- Moving Average Crossover and Upper Rail Breakthrough Impulse StrategyPine Script · Breakout · 1m
- Bollinger Bands Dynamic Breakout StrategyPine Script · Breakout · 1h
- Momentum Breakout Moving Average StrategyPine Script · Breakout · 1d
- Moving Average Support and Resistance Breakout StrategyPine Script · Breakout · 1d
- Multi factor Intelligent Trading StrategyPine Script · Breakout · 1d
- Reversal Breakout StrategyPine Script · Breakout · 1d