Breakthrough of Daily High low Price Based on Fibonacci Levels
This strategy calculates the highest and lowest prices of each day, combined with Fibonacci retracement levels, to find breakthrough trading opportunities within the current trading day. When the price breaks through…
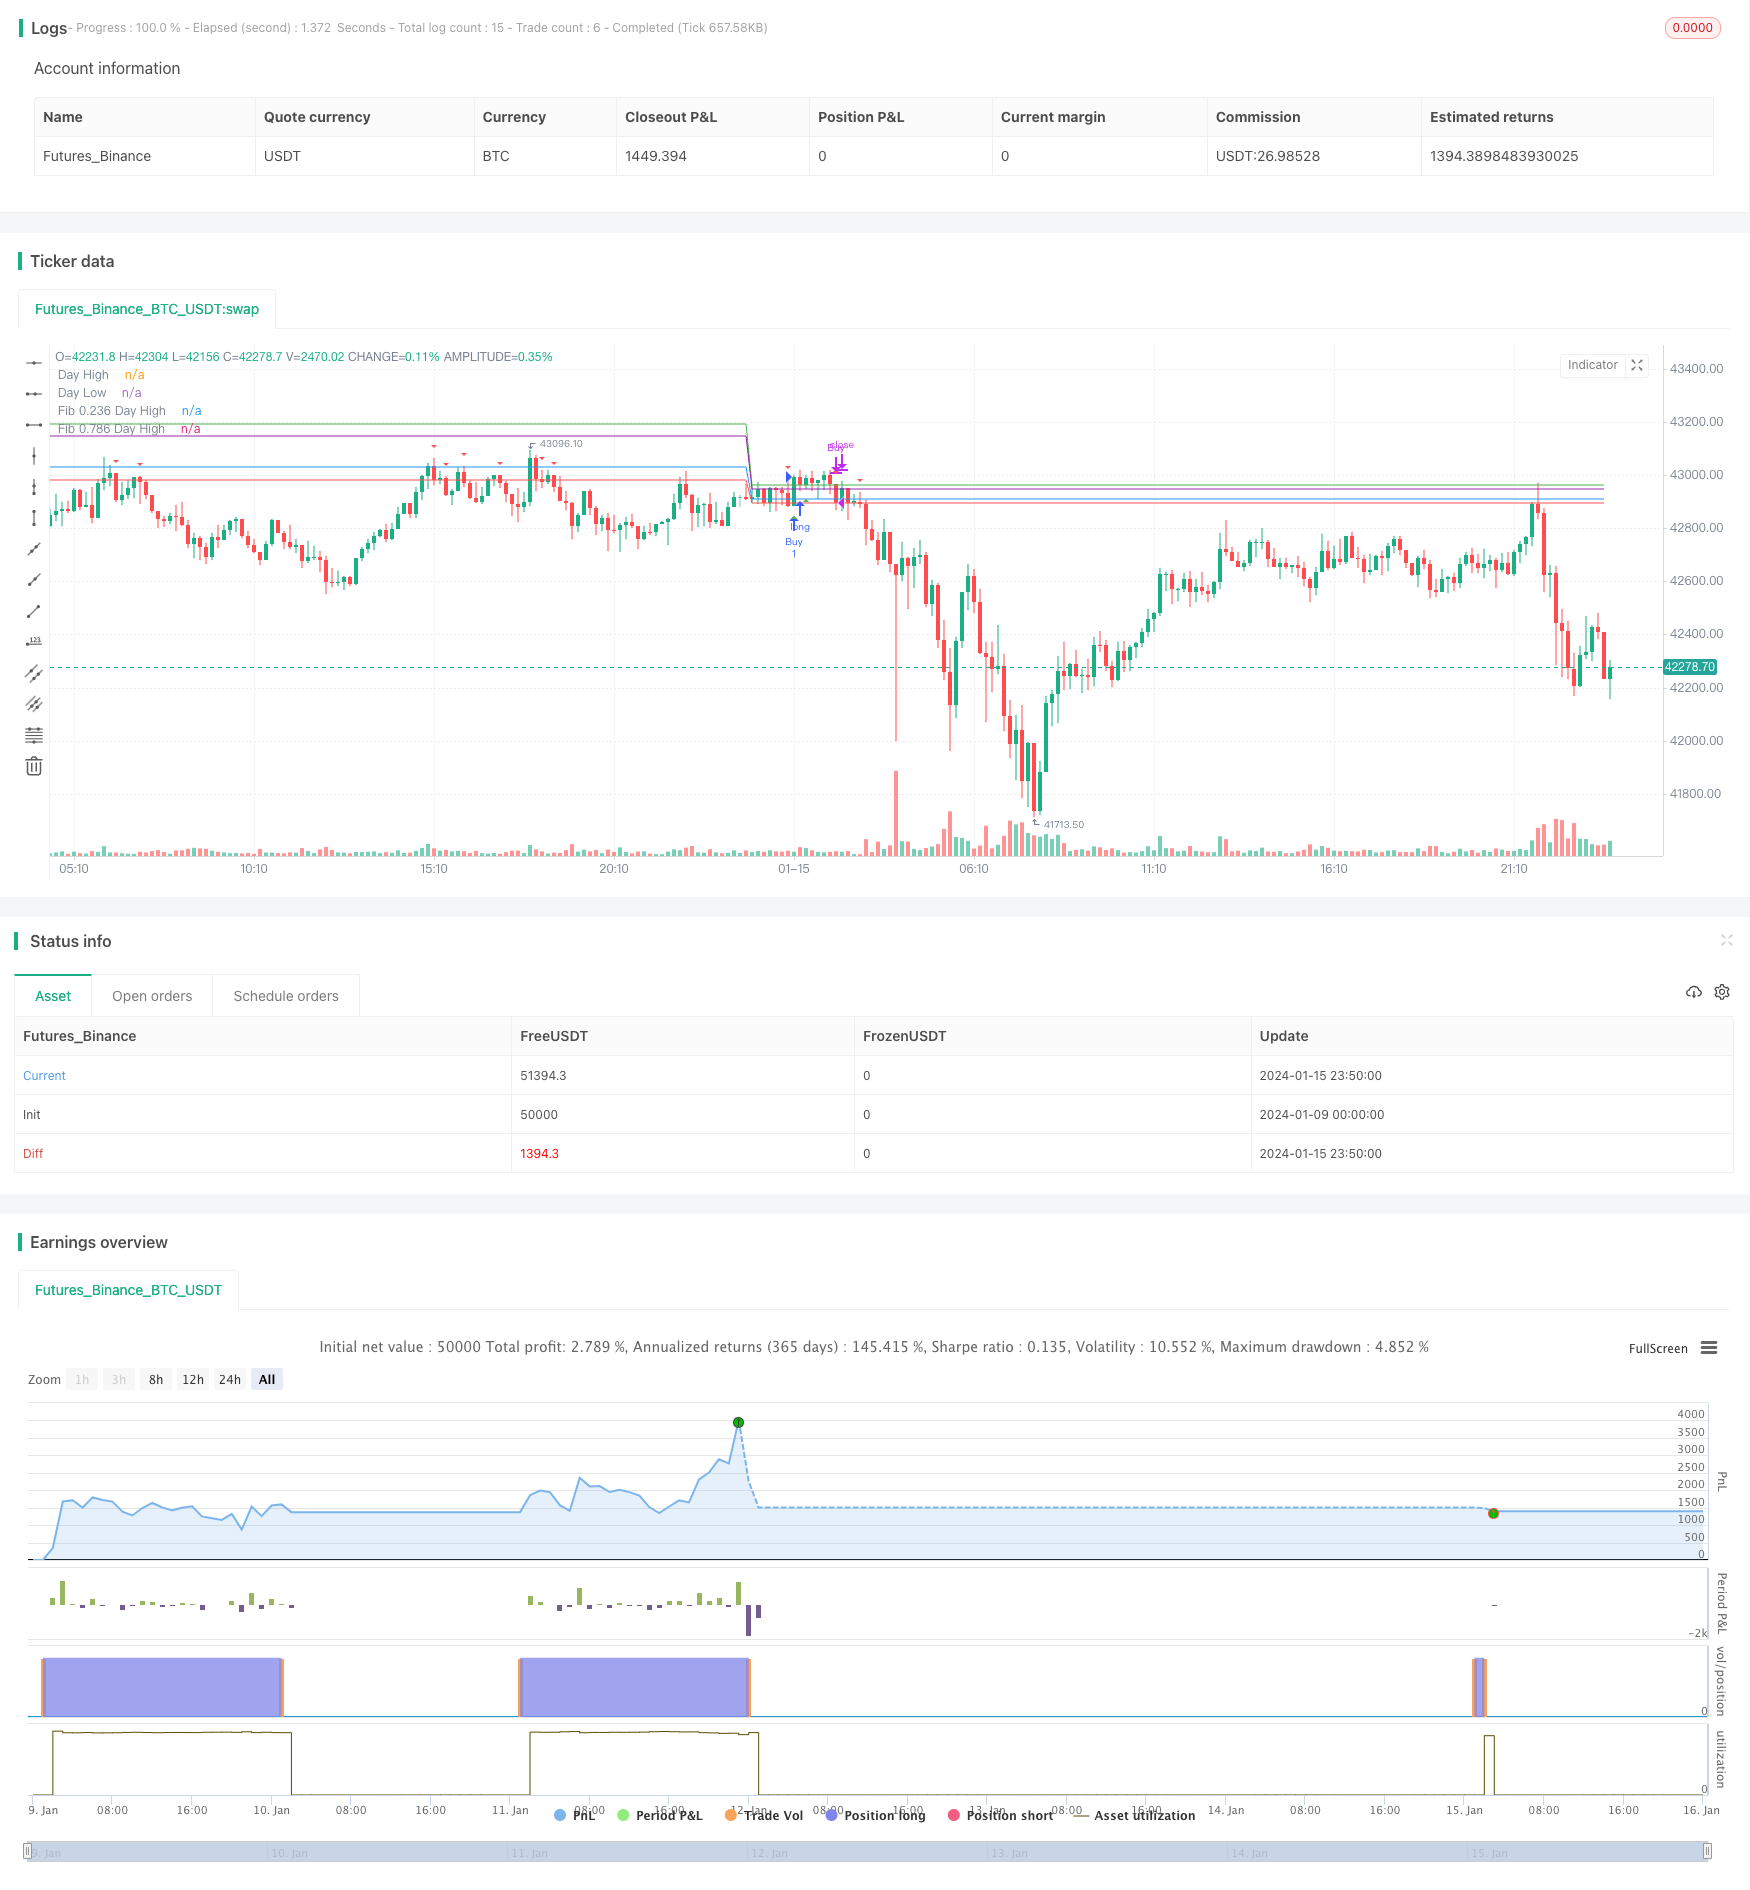
Overview
This strategy calculates the highest and lowest prices of each day, combined with Fibonacci retracement levels, to find breakthrough trading opportunities within the current trading day. When the price breaks through the highest price of the day, take a bullish strategy; when the price breaks through the lowest price of the day, take a bearish strategy.
Strategy Principle
The core logic of this strategy is as follows:
Record the highest price dayHigh and the lowest price dayLow of the day at market open each day.
Calculate two Fibonacci retracement levels of 0.236 and 0.786:
fib236High = dayLow + 0.236 * (dayHigh - dayLow)
fib786High = dayLow + 0.786 * (dayHigh - dayLow)If the closing price breaks through dayHigh upwards, a buy signal is generated; if the closing price breaks through dayLow downwards, a sell signal is generated.
Take corresponding bullish or bearish strategies according to buy and sell signals.
This strategy ingeniously combines the highest price, the lowest price and Fibonacci levels to find trading opportunities when breakthroughs occur during the day. It is a kind of trend tracking strategy that can capture trend reversals during the midday trading session.
Advantage Analysis
The main advantages of this strategy are:
High intraday trading frequency to capture price breakthroughs during midday trading sessions.
With certain technical indicator support of Fibonacci retracement, it is not simply chasing new highs or new lows.
Using the highest and lowest prices as reference levels has some supporting strength.
The trading logic is simple and clear, easy to understand and implement, suitable for quantitative trading.
Displaying the highest price, lowest price and Fibonacci levels is configurable for visual analysis.
Risk Analysis
There are also some risks to this strategy:
Frequent intraday operations may increase transaction costs and slippage risks.
Intraday breakthroughs may be false breakouts, with the risk of getting wrong bullish or bearish signals.
There is no stop loss logic, with the risk of expanding losses.
It is purely technically driven without combining fundamental analysis.
Countermeasures:
Adjust position size appropriately to reduce cost impact.
Combine more technical indicators to filter out false breakout signals.
Increase moving stop loss strategies to control single loss.
Combine fundamental data analysis to avoid impacts of market reversals.
Optimization Direction
The main optimization directions for this strategy:
Increase the combination of multiple technical indicators to improve signal reliability.
Add automatic stop loss strategies to control losses.
Optimize buy and sell strategy parameters, adjust position management.
Based on high frequency factors, combine volatility, volume ratio and other filtering signals.
Use machine learning methods to find better parameter combinations.
Establish a dynamic exit mechanism, rather than a simple crossover of highest or lowest prices.
Summary
This intraday high-low price squeeze Fibonacci strategy is relatively simple, profiting by capturing short-term breakthroughs of price levels. There is large room for strategy optimization in areas like indicator optimization, stop loss management, parameter adjustment to make it a stable profitable high frequency intraday strategy.
Parameters
| Name | Default | What it controls |
|---|---|---|
| v_input_1 | true | Show Day High/Low Lines |
| v_input_2 | true | Show Fibonacci Levels |
Source Pine Script
/*backtest
start: 2024-01-09 00:00:00
end: 2024-01-16 00:00:00
period: 10m
basePeriod: 1m
exchanges: [{"eid":"Futures_Binance","currency":"BTC_USDT"}]
*/

//@version=4
strategy("Day High/Low Fibonacci Levels Strategy", shorttitle="DHL Fibonacci", overlay=true)

// Calculate the day's high and low
var float dayHigh = na
var float dayLow = na
if change(time("D"))
    dayHigh := high
    dayLow := low

// Define input for plotting lines
showLines = input(true, title="Show Day High/Low Lines")
showFibLevels = input(true, title="Show Fibonacci Levels")

// Plot the day's high and low as lines
plot(showLines ? dayHigh : na, color=color.green, style=plot.style_line, linewidth=1, title="Day High")
plot(showLines ? dayLow : na, color=color.red, style=plot.style_line, linewidth=1, title="Day Low")

// Calculate buy and sell conditions
buyCondition = crossover(close, dayHigh)
sellCondition = crossunder(close, dayLow)

// Plot buy and sell signals
plotshape(buyCondition, style=shape.triangleup, location=location.belowbar, color=color.green, size=size.small, title="Buy Signal")
plotshape(sellCondition, style=shape.triangledown, location=location.abovebar, color=color.red, size=size.small, title="Sell Signal")

// Calculate Fibonacci levels for the day's high and low
fib236High = dayLow + (0.236 * (dayHigh - dayLow))
fib786High = dayLow + (0.786 * (dayHigh - dayLow))

// Plot Fibonacci levels
plot(showFibLevels ? fib236High : na, color=color.blue, style=plot.style_line, linewidth=1, title="Fib 0.236 Day High")
plot(showFibLevels ? fib786High : na, color=color.purple, style=plot.style_line, linewidth=1, title="Fib 0.786 Day High")

// Strategy
strategy.entry("Buy", strategy.long, when=buyCondition)
strategy.close("Buy", when=sellCondition)
Published by ChaoZhang on the FMZ strategy square · last modified 2024-01-17. Collected in the Quant Trading Vault. Unvalidated research: re-test with your own data and costs before trusting it.
Build this with AgenKit
A spec is not a trading system. Paste this into your coding agent and AgenKit runs a specialist team — architecture, test-first build, risk gates, review — with paper trading on by default.
/agenkit build a production-grade trading bot with a backtest engine, risk controls and paper trading by default from strategies/Breakthrough-of-Daily-High-low-Price-Based-on-Fibonacci-Levels.md- npx agenkit install engineering-kit in your project
- Paste the command into your agent and approve each phase
- Get tests, backtest, risk controls and a paper-trading switch
Understand it first
Before you run this, read the lesson behind the idea and how to backtest it honestly. Specs like this one are the survivors of an unknown number of trials; deflate their results accordingly.
Related specs
- Moving Average Crossover and Upper Rail Breakthrough Impulse StrategyPine Script · Breakout · 1m
- Multi factor Intelligent Trading StrategyPine Script · Breakout · 1d
- Quantitative Trading Strategy Based on Fibonacci 07 Level Trend BreakthroughPine Script · Breakout · 1h
- Y Profit Maximizer StrategyPine Script · Breakout · 1d
- 24 Hour Volume Price Fibonacci Retracement MA Cross Trading StrategyPine Script · Breakout · 1d
- Adaptive Multi Level Trading Strategy Based on Fibonacci RetracementPine Script · Breakout · 4h