Strategy vault / Trend following
BTC Hash Ribbons Strategy
The BTC Hash Ribbons strategy utilizes the hash rate indicator of the Bitcoin network to go long when miner capitulation ends and recovery begins, and go short when miners start capitulating, in order to profit from…
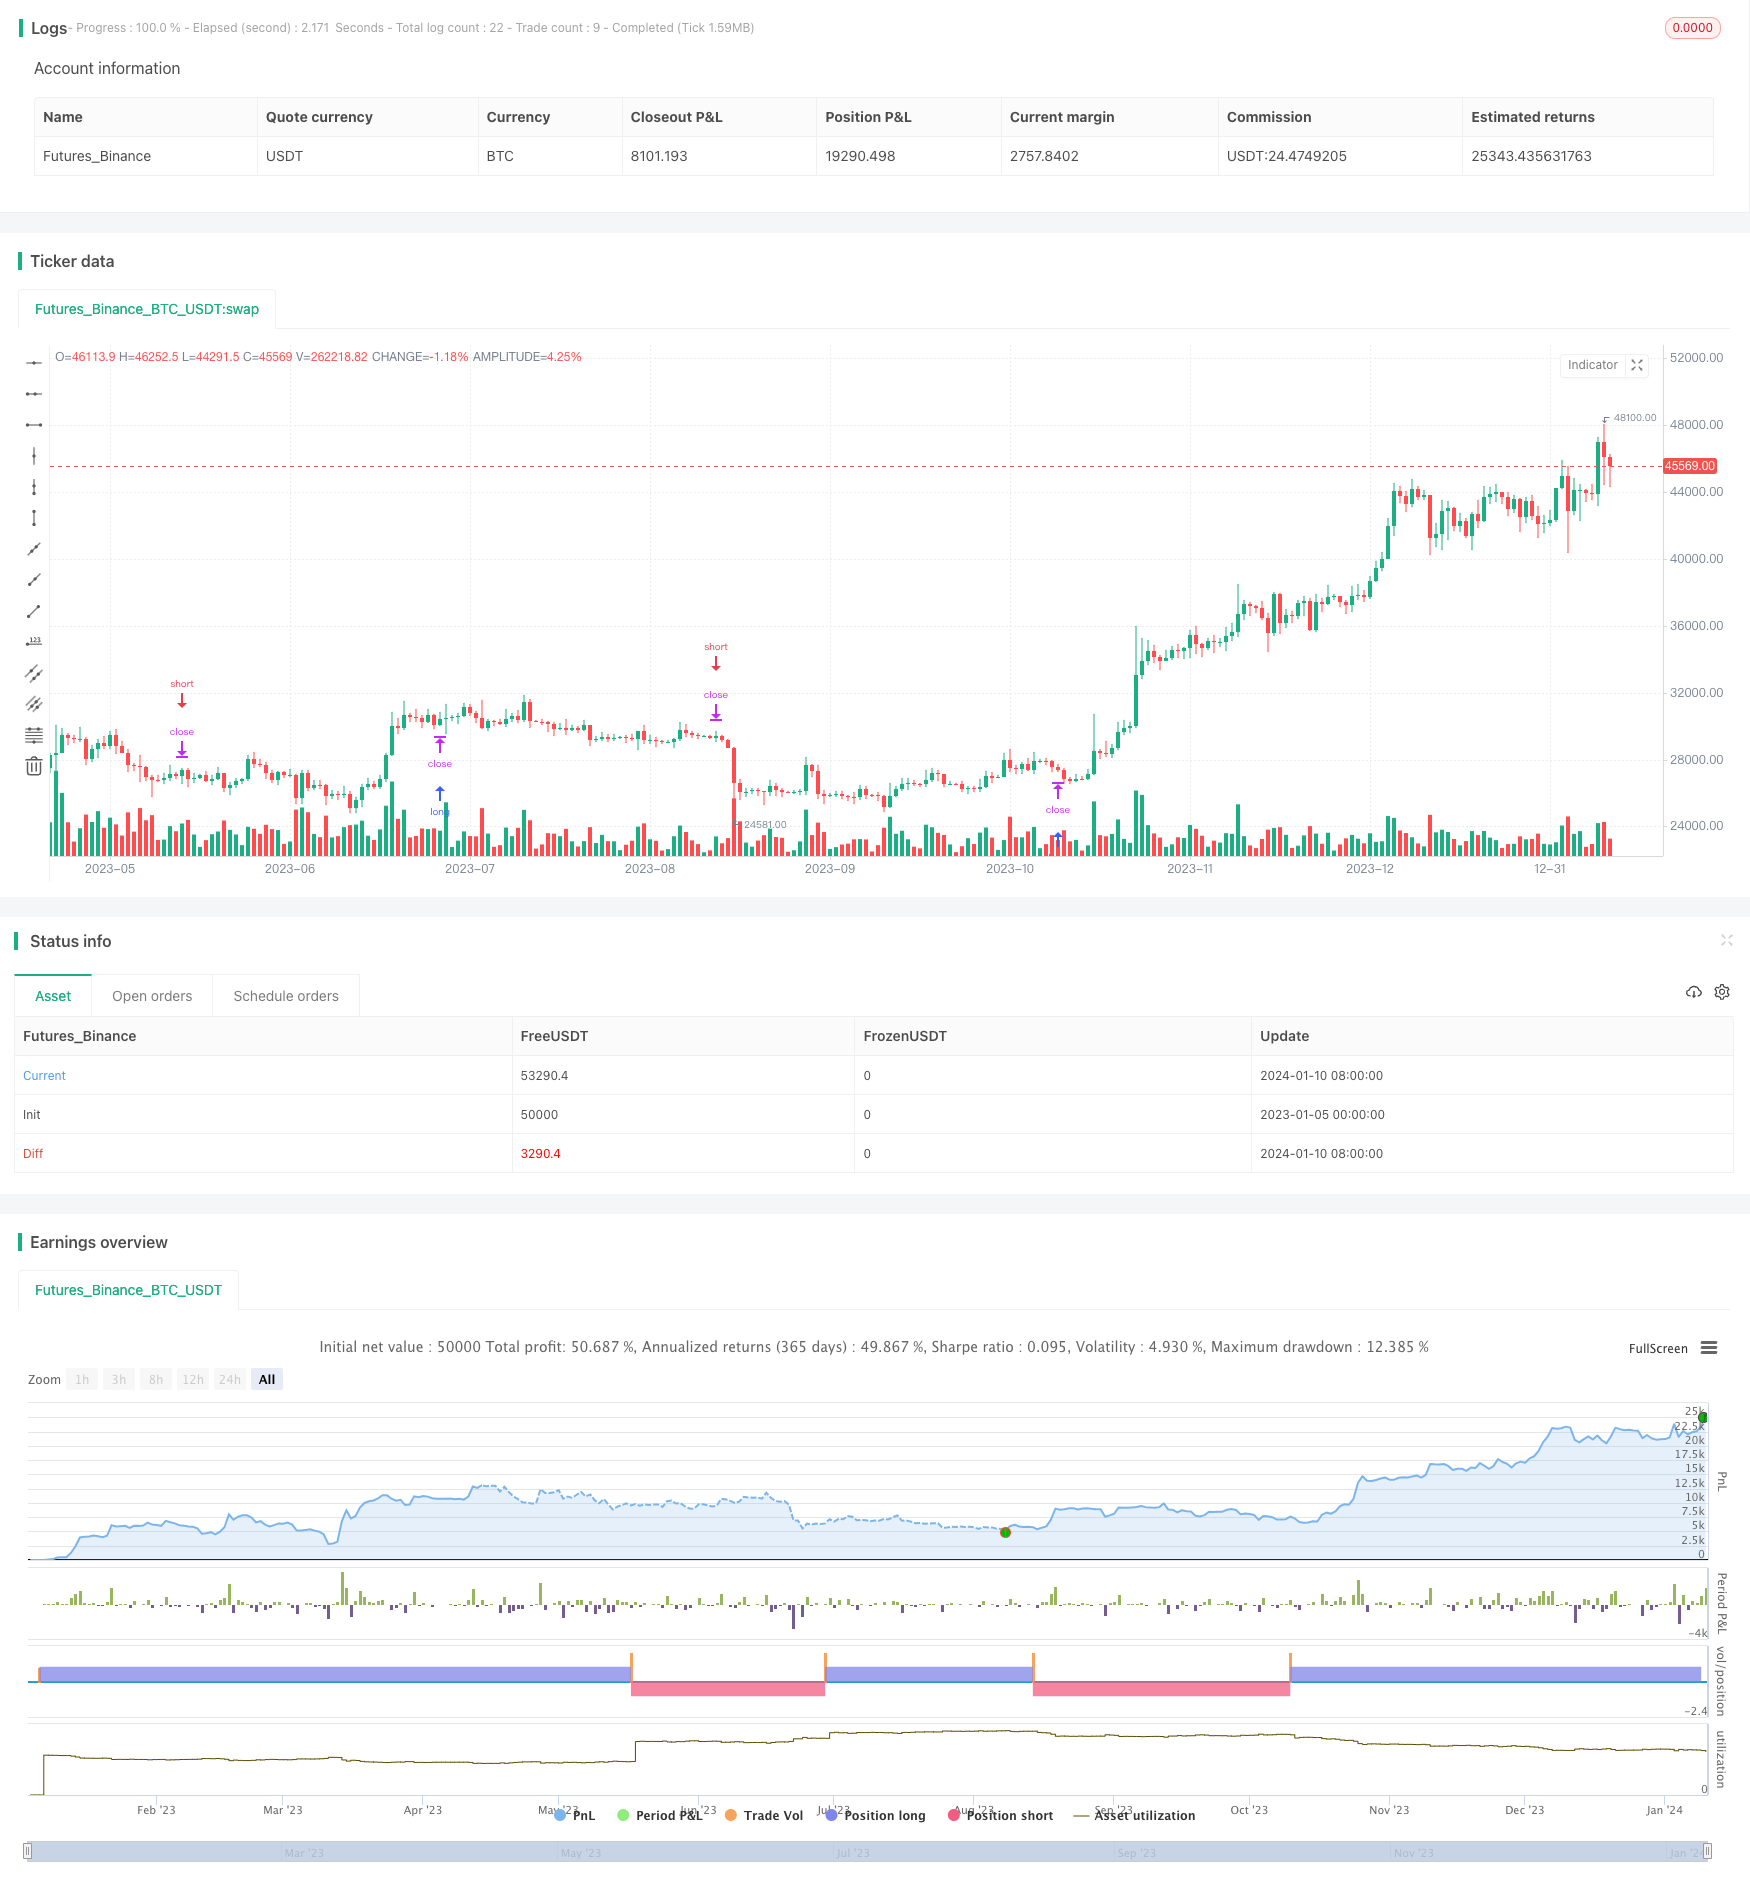
Overview
The BTC Hash Ribbons strategy utilizes the hash rate indicator of the Bitcoin network to go long when miner capitulation ends and recovery begins, and go short when miners start capitulating, in order to profit from the fluctuations of the miner cycle.
Strategy Logic
This strategy uses IntoTheBlock data to show Bitcoin's daily hash rate on the trading view. It calculates the fast moving average and slow moving average. When the fast moving average crosses above the slow moving average, it goes long, believing that miner capitulation has ended and recovery has begun. When the fast moving average crosses below the slow moving average, it goes short, believing that miners are starting to capitulate.
Specifically, the strategy defines two moving average lines: SignalLine (default length 30 days) and LongLine (default length 60 days). When SignalLine crosses above LongLine, it is considered a long signal; when SignalLine crosses below LongLine, it is considered a short signal. According to the direction parameter, the strategy will open long or short positions when the corresponding signal appears.
Advantage Analysis
The biggest advantage of this strategy is that it utilizes the characteristics of the Bitcoin network itself, reflecting the expansion and contraction cycles of miners through hash rate to generate trading signals. This avoids complex analysis of Bitcoin prices themselves, using network data as a predictive indicator, which is relatively simple and reliable.
Another advantage is the small number of parameters. The main ones are just the length settings of the fast and slow moving averages, which is very simple without overfitting. At the same time, multiple algorithms are provided for the moving average selection, allowing flexible adjustments.
Risk Analysis
The main risk of this strategy is the quality of the hash rate data provider. If there are data quality issues, it will seriously affect the accuracy of the signals. Currently IntoTheBlock provides good quality data, but its sustainability also needs attention.
Another risk is the systemic risk of the market itself. Even if the characteristics of miners' expansion and contraction are captured, it may still suffer losses in the event of large fluctuations in the overall market. More market indicators need to be monitored to determine systemic risk.
Optimization Directions
Consider combining with price indicators to increase confidence when opening positions, such as combining K-line pattern indicators, moving average indicators, etc. Only open positions when both indicate long or short signals.
Test hash ribbons indicators based on different cycles to build strategies. For example, use weekly or monthly indicators to filter out too much noise and determine trend reversals at larger timeframes.
Try machine learning models to determine key reversal points of the hash rate. Compared to fixed parameter moving averages, machine learning models may better simulate the complex characteristics of reversals.
Conclusion
The overall logic of this strategy is clear and simple. By reflecting the miner cycle through the Bitcoin network's own data, it forms trading signals while avoiding complex price forecasts, giving it a certain reliability. But further optimization and combination are still needed to reduce the impact of market systemic risks and improve stable profitability.
Parameters
| Name | Default | What it controls |
|---|---|---|
| v_input_1 | false | (?Direction)Both(0), Long(1), Short(-1) |
| v_input_string_1 | 0 | (?Hashrate Settings)Smoothing short MA: SMA | RMA | EMA | WMA |
| v_input_2 | 30 | Short MA length |
| v_input_string_2 | 0 | Smoothing long MA: SMA | RMA | EMA | WMA |
| v_input_3 | 60 | Long MA length |
Source Pine Script
/*backtest
start: 2023-01-05 00:00:00
end: 2024-01-11 00:00:00
period: 1d
basePeriod: 1h
exchanges: [{"eid":"Futures_Binance","currency":"BTC_USDT"}]
*/

// This source code is subject to the terms of the Mozilla Public License 2.0 at https://mozilla.org/MPL/2.0/
// © Powerscooter
// Since IntoTheBlock only provides daily hashrate data, this chart might look chunky on lower timeframes, even with smoothing.

//@version=5
strategy("BTC Hashrate ribbons", overlay = true)
enableDirection = input(0, title="Both(0), Long(1), Short(-1)", group="Direction")
smoothingS = input.string(title="Smoothing short MA", defval="SMA", options=["SMA", "RMA", "EMA", "WMA"], group="Hashrate Settings")
SmoothLengthS = input(30, 'Short MA length', group="Hashrate Settings")
smoothingL = input.string(title="Smoothing long MA", defval="SMA", options=["SMA", "RMA", "EMA", "WMA"], group="Hashrate Settings")
SmoothLengthL = input(60, 'Long MA length', group="Hashrate Settings")
ma_functionS(source, length) =>
	switch smoothingS
		"RMA" => ta.rma(source, length)
		"SMA" => ta.sma(source, length)
		"EMA" => ta.ema(source, length)
		=> ta.wma(source, length)
ma_functionL(source, length) =>
	switch smoothingL
		"RMA" => ta.rma(source, length)
		"SMA" => ta.sma(source, length)
		"EMA" => ta.ema(source, length)
		=> ta.wma(source, length)

HashRate = request.security("INTOTHEBLOCK:BTC_HASHRATE", "D", close)

SignalLine = ma_functionS(HashRate, SmoothLengthS)
LongLine = ma_functionL(HashRate, SmoothLengthL)

plot(ma_functionS(HashRate, SmoothLengthS), "Short MA", color=color.yellow)
plot(ma_functionL(HashRate, SmoothLengthL), "Long MA", color=color.blue)

LongCondition = ta.crossover(SignalLine, LongLine)
ShortCondition = ta.crossunder(SignalLine, LongLine)

//Long Entry Condition
if LongCondition and (enableDirection == 1 or enableDirection == 0)
    strategy.entry("Long", strategy.long)
if LongCondition and (enableDirection == -1)
    strategy.close("Short")

//Short Entry condition
if ShortCondition and (enableDirection == -1 or enableDirection == 0)
    strategy.entry("Short", strategy.short)
if ShortCondition and (enableDirection == 1)
    strategy.close("Long")
Published by ChaoZhang on the FMZ strategy square · last modified 2024-01-12. Collected in the Quant Trading Vault. Unvalidated research: re-test with your own data and costs before trusting it.
Build this with AgenKit
A spec is not a trading system. Paste this into your coding agent and AgenKit runs a specialist team — architecture, test-first build, risk gates, review — with paper trading on by default.
/agenkit build a production-grade trading bot with a backtest engine, risk controls and paper trading by default from strategies/BTC-Hash-Ribbons-Strategy.md- npx agenkit install engineering-kit in your project
- Paste the command into your agent and approve each phase
- Get tests, backtest, risk controls and a paper-trading switch
Understand it first
Before you run this, read the lesson behind the idea and how to backtest it honestly. Specs like this one are the survivors of an unknown number of trials; deflate their results accordingly.
Related specs
- ADX MA and EMA Long Only Trend Tracking StrategyPine Script · Trend following · 1d
- ATR and Moving Average Crossover Hybrid StrategyPine Script · Trend following · 1h
- Bollinger Band Moving Average Crossover StrategyPine Script · Trend following · 1h
- Bollinger Bands and EMA Trend Following StrategyPine Script · Trend following · 1h
- Bollinger Bands and RSI Trend Following StrategyPine Script · Trend following · 1h
- Candlestick Pattern Trend Filter StrategyPine Script · Trend following · 1d