Strategy vault / Machine learning
Bullish Divergence Short term Long Trade Finder Strategy
This strategy tries to identify short-term opportunities where Bitcoin is likely to bounce up by looking for bullish divergence patterns in the RSI indicator, and thus determine good entry points for long trades.
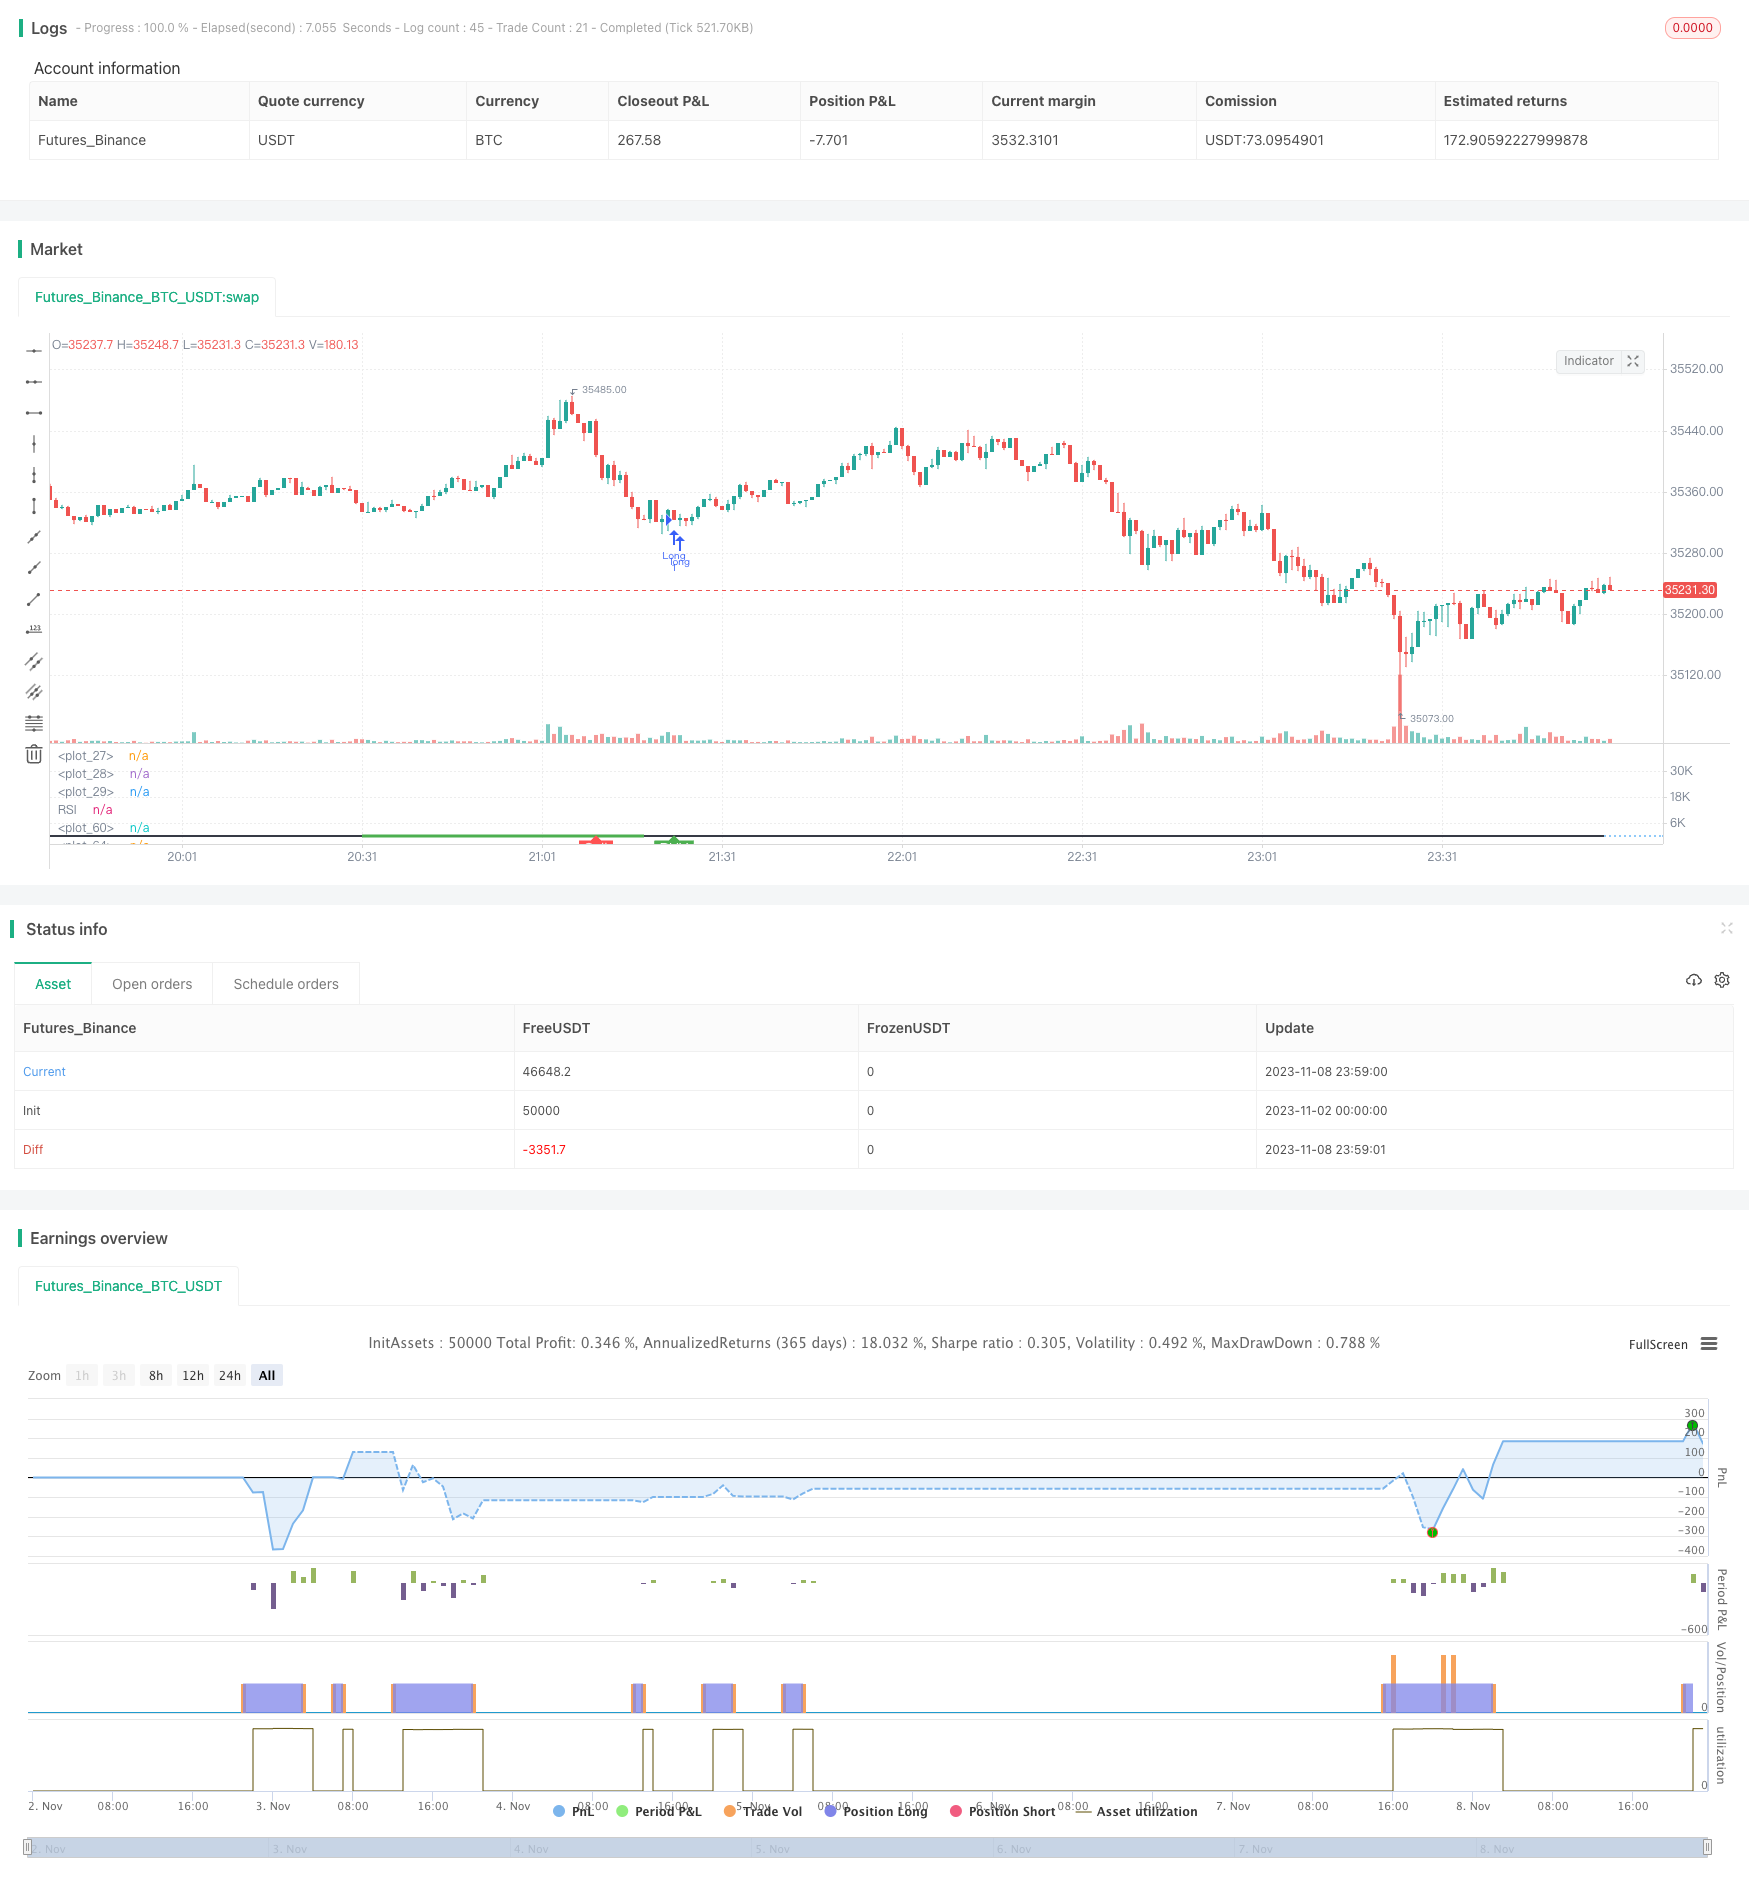
Overview
This strategy tries to identify short-term opportunities where Bitcoin is likely to bounce up by looking for bullish divergence patterns in the RSI indicator, and thus determine good entry points for long trades.
Strategy Logic
Identify bullish divergence with RSI indicator
- Define RSI parameters (default 14 periods)
- Calculate current RSI value
- Check if the following bullish divergence exists:
- RSI formed a lower low
- Price formed a lower low at the same time
- RSI then formed a higher low
- Price then formed a higher low
Check if RSI value is below threshold
- Define RSI low threshold (default 40)
- If current RSI is below this threshold, it may signal a long entry point
Check if close price is below the previous divergence low
- If yes, further validate the bullish divergence buy signal
Define stop loss exit conditions
- Set stop loss percentage (default 5%)
- Exit if drawdown reaches this percentage
Define take profit exit conditions
- Set RSI high threshold (default 75)
- Exit if RSI rises above this threshold
Advantage Analysis
Using RSI divergence can effectively capture opportunities for short-term price bounce
Combining with RSI low threshold helps determine specific entry points
Stop loss and take profit settings help manage risk and reward
The strategy references lots of real trading experience with Bitcoin RSI signals and is very suitable for Bitcoin long scalping
Reasonable parameter settings make the strategy adaptable to different market conditions and good for live trading
Risk Analysis
RSI divergence may fail, leading to losing trades if identified wrongly
A single indicator tends to generate false signals, should combine with others
Need to choose proper parameter values, improper settings affect profitability
Long trading needs to consider overall trend, avoid trading against the trend
Need to watch out for trading costs, high frequency trading impacts profits
Should backtest and optimize parameters regularly based on changing markets
Optimization Directions
Consider adding other indicators like moving averages for filter conditions to reduce false signals
Test different period settings on each time frame to find optimal combinations
Incorporate higher timeframe trend analysis to avoid buying against a trend reversal
Implement dynamic stop loss that gradually raises stops as profit level increases
Adjust stop loss percentage based on specific position sizing
Introduce machine learning for automatic parameter optimization
Conclusion
This strategy aims to identify Bitcoin short-term bounce opportunities by detecting RSI bullish divergences and determine good long entry points. The strategy is simple and effective, incorporating lots of practical trading experience, making it very suitable for Bitcoin scalping longs. However, reliance on a single indicator tends to generate false signals, so it should be combined with other indicators. Attention should also be given to parameter optimization, stop loss placement, trading costs, etc. If used properly, this strategy can be very profitable in live trading.
Parameters
| Name | Default | What it controls |
|---|---|---|
| v_input_1_close | 0 | Source: close | high | low | open | hl2 | hlc3 | hlcc4 | ohlc4 |
| v_input_int_1 | 50 | RSI Bearish Condition Minimum |
| v_input_int_2 | 60 | RSI Bearish Condition Sell Min |
| v_input_int_3 | 40 | RSI Bull Condition Minimum |
| v_input_int_4 | 25 | Look Back this many candles |
| v_input_int_5 | 75 | RSI Sell Value |
| v_input_int_6 | 5 | Stop loss Percentage |
| v_input_int_7 | 14 | RSI Length |
| v_input_int_8 | 30 | RSI Oversold Level |
| v_input_int_9 | 70 | RSI Overbought Level |
Source Pine Script
/*backtest
start: 2023-11-02 00:00:00
end: 2023-11-09 00:00:00
period: 1m
basePeriod: 1m
exchanges: [{"eid":"Futures_Binance","currency":"BTC_USDT"}]
*/

//@version=5
strategy("Bullish Divergence Short-term Long Trade Finder", overlay=false)

max_range = 50
min_range = 5
///pivot_left = 25
pivot_right = 5

//Inputs
src = input(close, title="Source")
rsiBearCondMin = input.int(50, title="RSI Bearish Condition Minimum")
rsiBearCondSellMin = input.int(60, title="RSI Bearish Condition Sell Min")
rsiBullCondMin = input.int(40, title="RSI Bull Condition Minimum")
pivot_left = input.int(25, title="Look Back this many candles")
SellWhenRSI = input.int(75, title="RSI Sell Value")
StopLossPercent = input.int(5, title="Stop loss Percentage")
rsiPeriod = input.int(14, title="RSI Length")
rsiOversold = input.int(30, title="RSI Oversold Level")
rsiOverbought = input.int(70, title="RSI Overbought Level")

//RSI Function/ value
rsi_value = ta.rsi(src, rsiPeriod)
rsi_hour = request.security(syminfo.tickerid,'60',rsi_value)
rsi_4hour = request.security(syminfo.tickerid,'240',rsi_value)
rsi_Day = request.security(syminfo.tickerid,'D',rsi_value)
plot(rsi_value, title="RSI", linewidth = 2, color = color.black, display =display.all)
hline(50, linestyle = hline.style_dotted)
rsi_ob = hline(70, linestyle=hline.style_dotted)
rsi_os = hline(30, linestyle=hline.style_dotted)
fill(rsi_ob, rsi_os, color.white)
SL_percent = (100-StopLossPercent)/100

pivot_low_true = na(ta.pivotlow(rsi_value, pivot_left, pivot_right)) ? false : true

//create a function that returns truee/false
confirm_range(x) =>
    bars = ta.barssince(x == true) //counts the number of bars since thee last time condition was true
    min_range <= bars and bars <= max_range // makees sure bars is less than max_range(50) and greater than min_range(5)


// RSI higher check / low check
RSI_HL_check = rsi_value<rsiBullCondMin and rsi_value > ta.valuewhen(pivot_low_true and rsi_value<rsiBullCondMin, rsi_value,1) and confirm_range(pivot_low_true[1])

// price check for lower low
price_ll_check = low < ta.valuewhen(pivot_low_true, low, 1)

bullCond = price_ll_check and RSI_HL_check and pivot_low_true

//pivot_high_true = na(ta.pivothigh(rsi_value, pivot_left, pivot_right))  ? false : true
pivot_high_true = na(ta.pivothigh(rsi_value, pivot_left, pivot_right))   ? false : true

// RSI Lower check / high check ensuring that the RSI dips below 30 to start divergence
RSI_LH_check = rsi_value < ta.valuewhen(pivot_high_true and rsi_value>rsiBearCondMin, rsi_value,1) and confirm_range(pivot_high_true[1]) //and rsi_value[pivot_right] >= 65

// price check for lower low
price_hh_check = high > ta.valuewhen(pivot_high_true, high, 1)

bearCond = price_hh_check and RSI_LH_check and pivot_high_true and rsi_value[3] > rsiBearCondSellMin

plot(pivot_low_true ? rsi_value : na, offset=-5, linewidth=3, color=(bullCond ? color.green : color.new(color.white, 100)))

plotshape(bullCond ? rsi_value : na , text = "BUY", style =  shape.labelup, location = location.absolute, color = color.green, offset =0, textcolor = color.white )

plot(pivot_low_true ? rsi_value : na, offset=-5, linewidth=3, color=(bearCond ? color.red : color.new(color.white, 100)))

plotshape(bearCond ? rsi_value : na , text = "Sell", style =  shape.labelup, location = location.absolute, color = color.red, offset =0, textcolor = color.white )
//[bbUpperBand, bbMiddleBand, bbLowerBand] = ta.bb(src, bbPeriod, bbDev)

//Entry Condition
longCondition = false

//bullEntry = bullCond and RSI_HL_check and confirm_range(pivot_low_true[1])
if bullCond and close < ta.valuewhen(pivot_low_true, low, 1) and rsi_hour <40 ///and rsi_4hour<40 //and rsi_Day<50
    strategy.entry("Long", strategy.long)

//Exit Condition
if (strategy.position_size > 0 and close < strategy.position_avg_price*SL_percent)
    strategy.close("Long")
if (strategy.position_size > 0 and (rsi_value > SellWhenRSI or bearCond))
    strategy.close("Long")
Published by ChaoZhang on the FMZ strategy square · last modified 2023-11-10. Collected in the Quant Trading Vault. Unvalidated research: re-test with your own data and costs before trusting it.
Build this with AgenKit
A spec is not a trading system. Paste this into your coding agent and AgenKit runs a specialist team — architecture, test-first build, risk gates, review — with paper trading on by default.
/agenkit build a production-grade trading bot with a backtest engine, risk controls and paper trading by default from strategies/Bullish-Divergence-Short-term-Long-Trade-Finder-Strategy.md- npx agenkit install engineering-kit in your project
- Paste the command into your agent and approve each phase
- Get tests, backtest, risk controls and a paper-trading switch
Understand it first
Before you run this, read the lesson behind the idea and how to backtest it honestly. Specs like this one are the survivors of an unknown number of trials; deflate their results accordingly.
Related specs
- High Frequency Hybrid Technical Analysis Quantitative StrategyPine Script · Machine learning · 15m
- Multi indicator Assisted StrategyPine Script · Machine learning · 1d
- MT Coordination Trading StrategyPine Script · Machine learning · 10m
- Multi Level Balanced Quantitative Trading StrategyPine Script · Machine learning · 1d
- AI Powered Volatility Price System Divergence Trading StrategyPine Script · Machine learning · 1h
- Configurable BBRSIAroon Strategy BacktestPine Script · Machine learning · 5m