Strategy vault / Mean reversion
CCI DMI and MACD Hybrid Long Short Strategy
This strategy combines three technical indicators: Commodity Channel Index (CCI), Directional Movement Index (DMI), and Moving Average Convergence Divergence (MACD) to determine the overbought and oversold conditions…
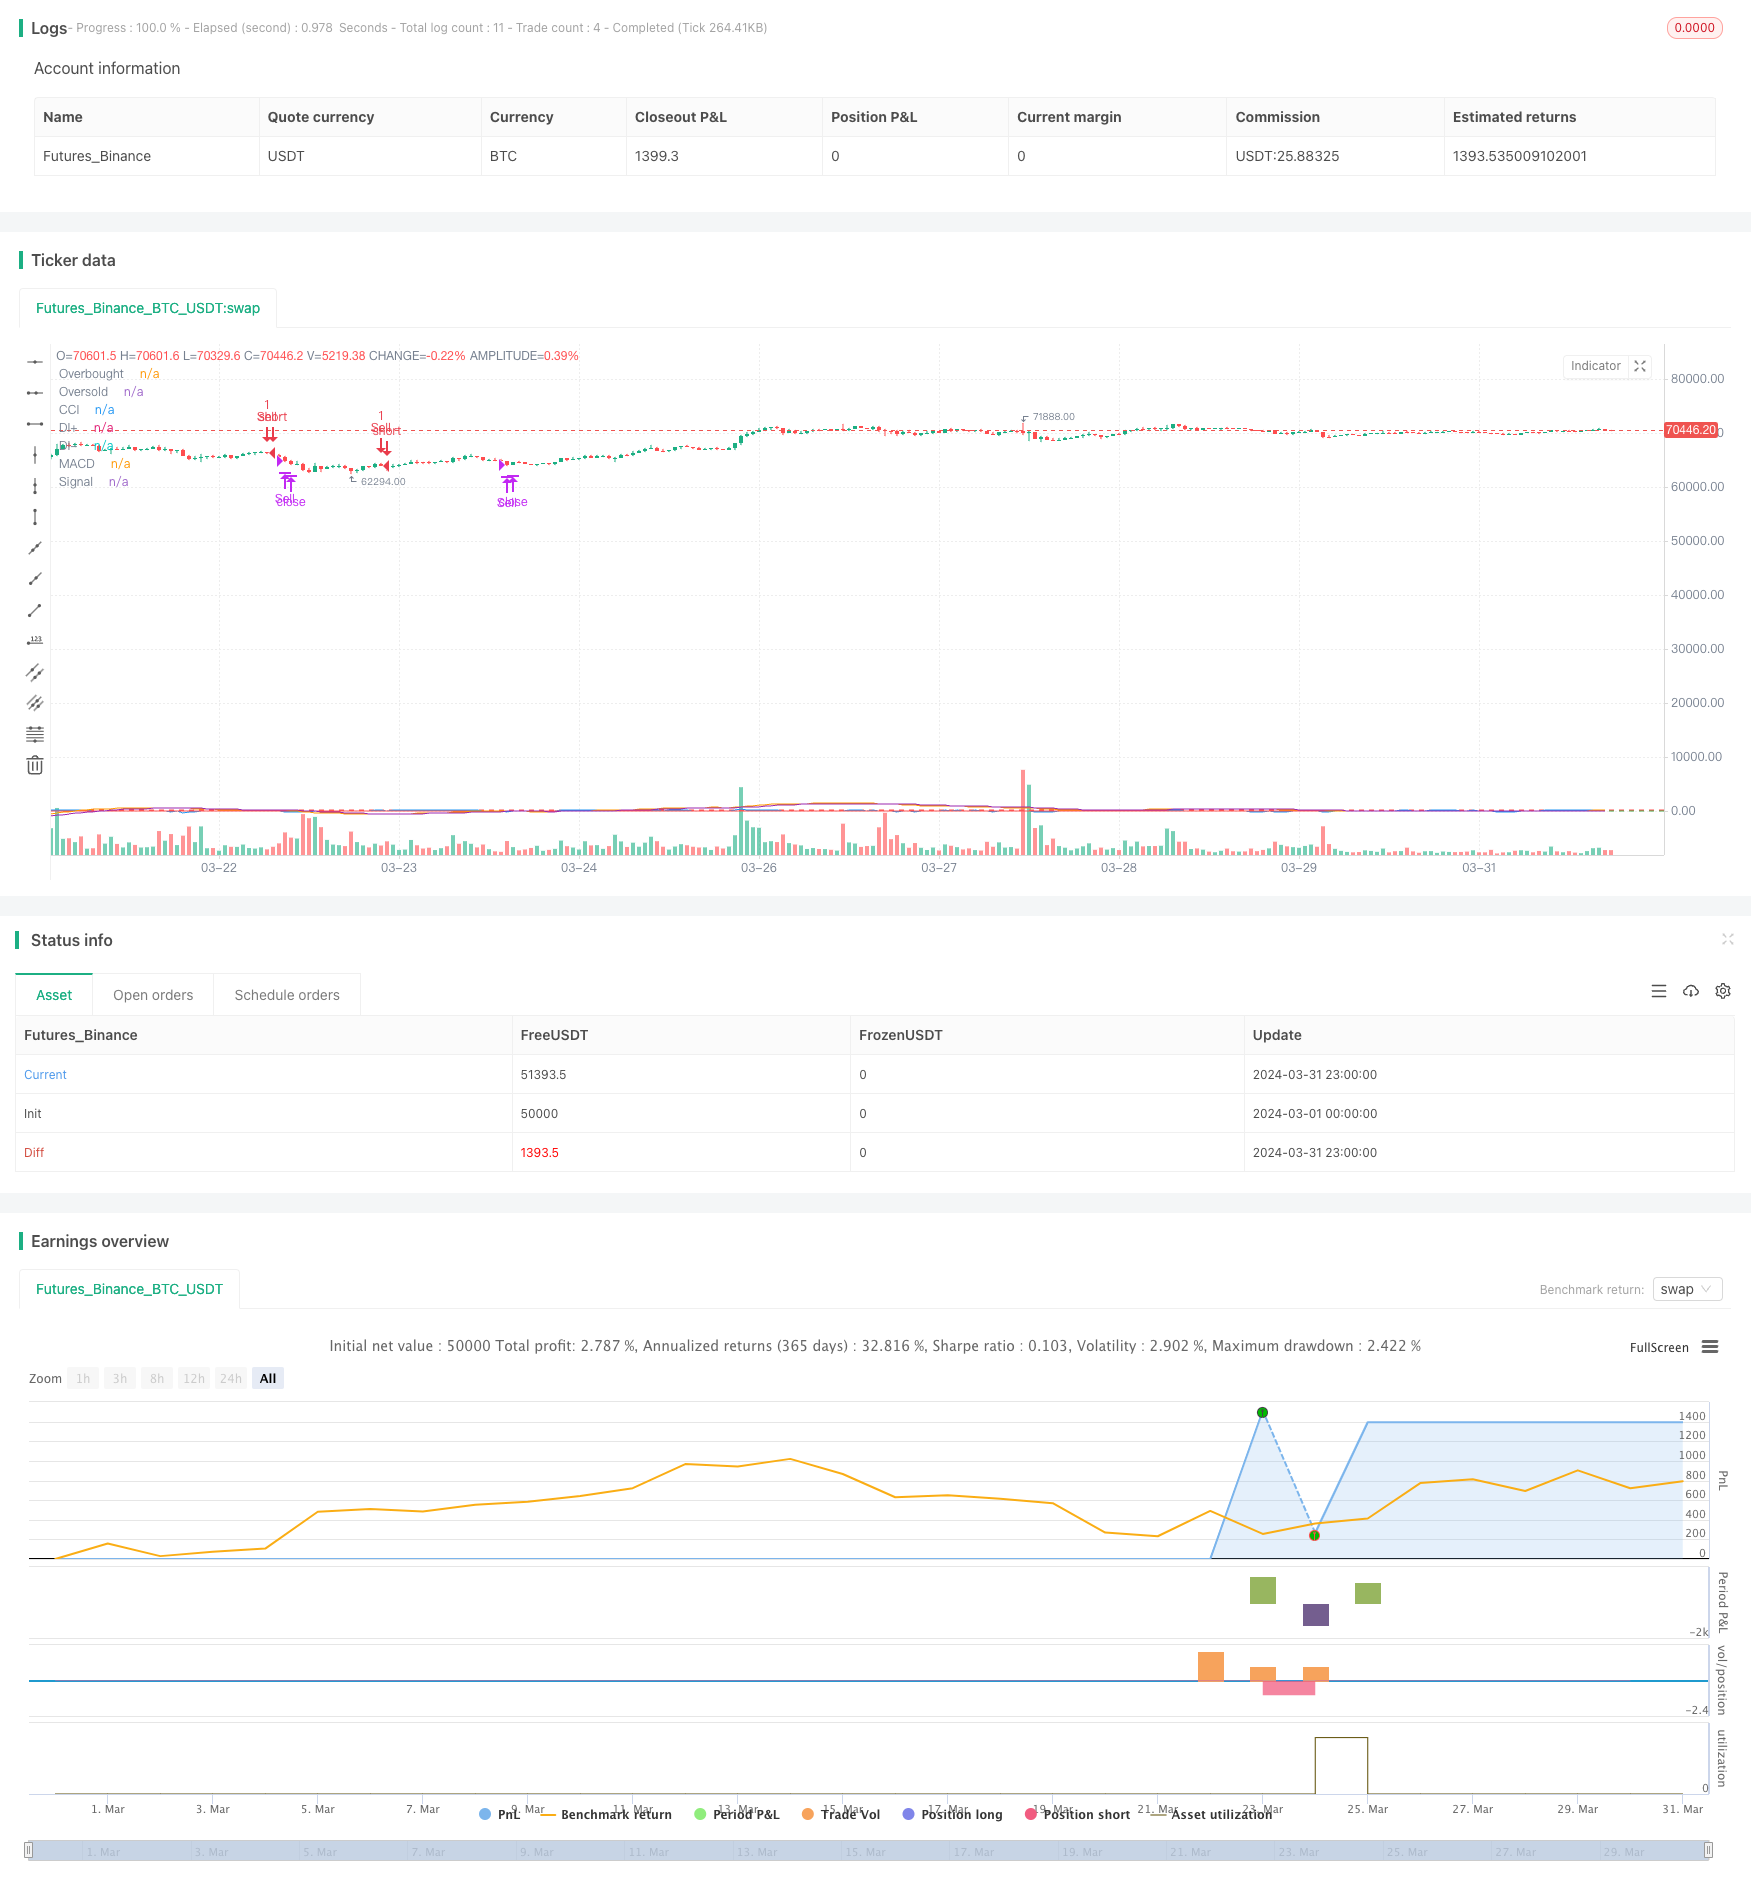
Overview
This strategy combines three technical indicators: Commodity Channel Index (CCI), Directional Movement Index (DMI), and Moving Average Convergence Divergence (MACD) to determine the overbought and oversold conditions of the market and the trend direction. When CCI breaks above the oversold area, DI+ is greater than DI-, and MACD is above the signal line, a buy signal is generated. When CCI breaks below the overbought area, DI- is greater than DI+, and MACD is below the signal line, a sell signal is generated.
Strategy Principles
- Calculate the CCI indicator to determine the overbought and oversold conditions of the market. When CCI breaks above the oversold area (below -100), it indicates that the market is turning from oversold and may rise. When CCI breaks below the overbought area (above 100), it indicates that the market is turning from overbought and may fall.
- Calculate the DMI indicator to determine the direction of the market trend. When DI+ is greater than DI-, it indicates that the uptrend is dominant. When DI- is greater than DI+, it indicates that the downtrend is dominant.
- Calculate the MACD indicator to determine the strength of the market trend. When MACD is above the signal line, it indicates strong upward momentum. When MACD is below the signal line, it indicates strong downward momentum.
- Combining the above three indicators, when CCI breaks above the oversold area, DI+ is greater than DI-, and MACD is above the signal line, a buy signal is generated. When CCI breaks below the overbought area, DI- is greater than DI+, and MACD is below the signal line, a sell signal is generated.
Strategy Advantages
- By combining multiple technical indicators, the market is analyzed from different perspectives, improving the reliability of the signals.
- It takes into account the overbought and oversold conditions of the market, trend direction, and trend strength, enabling it to capture the main trend of the market.
- It sets clear entry and exit conditions, making it easy to implement automated trading.
Strategy Risks
- During market fluctuations or unclear trends, this strategy may generate many false signals, leading to frequent trading and high transaction costs.
- The strategy relies on historical data and may react slowly to sudden market events or significant news.
- The strategy parameters (such as the overbought and oversold thresholds of CCI, the fast and slow line periods of MACD, etc.) need to be optimized for different markets and instruments; otherwise, it may affect the strategy performance.
Strategy Optimization Directions
- Introduce more technical indicators or market sentiment indicators to improve the reliability and stability of signals.
- Optimize the strategy parameters using intelligent optimization methods such as genetic algorithms to find the optimal parameter combination.
- Add risk control modules such as stop-loss, take-profit, and position management to improve the risk-reward ratio of the strategy.
- Set different trading rules for different market environments to improve the adaptability of the strategy.
Summary
By combining the three technical indicators of CCI, DMI, and MACD, this strategy makes a comprehensive judgment on the overbought and oversold conditions, trend direction, and trend strength of the market to generate buy and sell signals. The strategy is clear and easy to implement, but in practical applications, attention needs to be paid to optimizing strategy parameters, controlling trading frequency and risk to improve the stability and profitability of the strategy.
Parameters
| Name | Default | What it controls |
|---|---|---|
| v_input_1 | 14 | CCI Length |
| v_input_2 | 100 | Overbought Level |
| v_input_3 | -100 | Oversold Level |
Source Pine Script
/*backtest
start: 2024-03-01 00:00:00
end: 2024-03-31 23:59:59
period: 1h
basePeriod: 15m
exchanges: [{"eid":"Futures_Binance","currency":"BTC_USDT"}]
*/

//@version=5
strategy("CCI, DMI, and MACD Strategy", overlay=true)

// Define inputs
cci_length = input(14, title="CCI Length")
overbought_level = input(100, title="Overbought Level")
oversold_level = input(-100, title="Oversold Level")

// Calculate CCI
cci_value = ta.cci(close, cci_length)

// Calculate DMI
[di_plus, di_minus, _] = ta.dmi(14, 14)

// Calculate MACD
[macd_line, signal_line, _] = ta.macd(close, 24, 52, 9)

// Define buy and sell conditions
buy_signal = ta.crossover(cci_value, oversold_level) and di_plus > di_minus and macd_line > signal_line // CCI crosses above -100, Di+ > Di-, and MACD > Signal
sell_signal = ta.crossunder(cci_value, overbought_level) and di_minus > di_plus and macd_line < signal_line // CCI crosses below 100, Di- > Di+, and MACD < Signal

// Define exit conditions
buy_exit_signal = ta.crossover(cci_value, overbought_level) // CCI crosses above 100
sell_exit_signal = ta.crossunder(cci_value, oversold_level) // CCI crosses below -100

// Execute trades based on conditions
strategy.entry("Buy", strategy.long, when=buy_signal)
strategy.close("Buy", when=buy_exit_signal)

strategy.entry("Sell", strategy.short, when=sell_signal)
strategy.close("Sell", when=sell_exit_signal)

// Plot CCI
plot(cci_value, title="CCI", color=color.blue)

// Plot DMI
plot(di_plus, title="DI+", color=color.green)
plot(di_minus, title="DI-", color=color.red)

// Plot MACD and Signal lines
plot(macd_line, title="MACD", color=color.orange)
plot(signal_line, title="Signal", color=color.purple)

// Plot overbought and oversold levels
hline(overbought_level, "Overbought", color=color.red)
hline(oversold_level, "Oversold", color=color.green)
Published by ChaoZhang on the FMZ strategy square · last modified 2024-04-28. Collected in the Quant Trading Vault. Unvalidated research: re-test with your own data and costs before trusting it.
Build this with AgenKit
A spec is not a trading system. Paste this into your coding agent and AgenKit runs a specialist team — architecture, test-first build, risk gates, review — with paper trading on by default.
/agenkit build a production-grade trading bot with a backtest engine, risk controls and paper trading by default from strategies/CCI-DMI-and-MACD-Hybrid-Long-Short-Strategy.md- npx agenkit install engineering-kit in your project
- Paste the command into your agent and approve each phase
- Get tests, backtest, risk controls and a paper-trading switch
Understand it first
Before you run this, read the lesson behind the idea and how to backtest it honestly. Specs like this one are the survivors of an unknown number of trials; deflate their results accordingly.
Related specs
- CCIDMIMACDADX Multi Indicator Combination Strategy CCI DMI MACD ADXPine Script · Mean reversion · 1d
- Moving Average Envelopes Trading StrategyPine Script · Mean reversion · 1h
- Trend Reversal Momentum Indicators Crossover Tracking StrategyPine Script · Mean reversion · 1h
- Dual Indicator Slight Reversal Trading StrategyPine Script · Mean reversion · 15m
- Multi Dimensional Technical Indicator Cross Confirmation Buy Signal Optimization StrategyPine Script · Mean reversion · 1d
- Multi Indicator Scoring Trading StrategyPine Script · Mean reversion · 1d