Combined SMA and Bollinger Bands Engulfing Pattern Trading Strategy
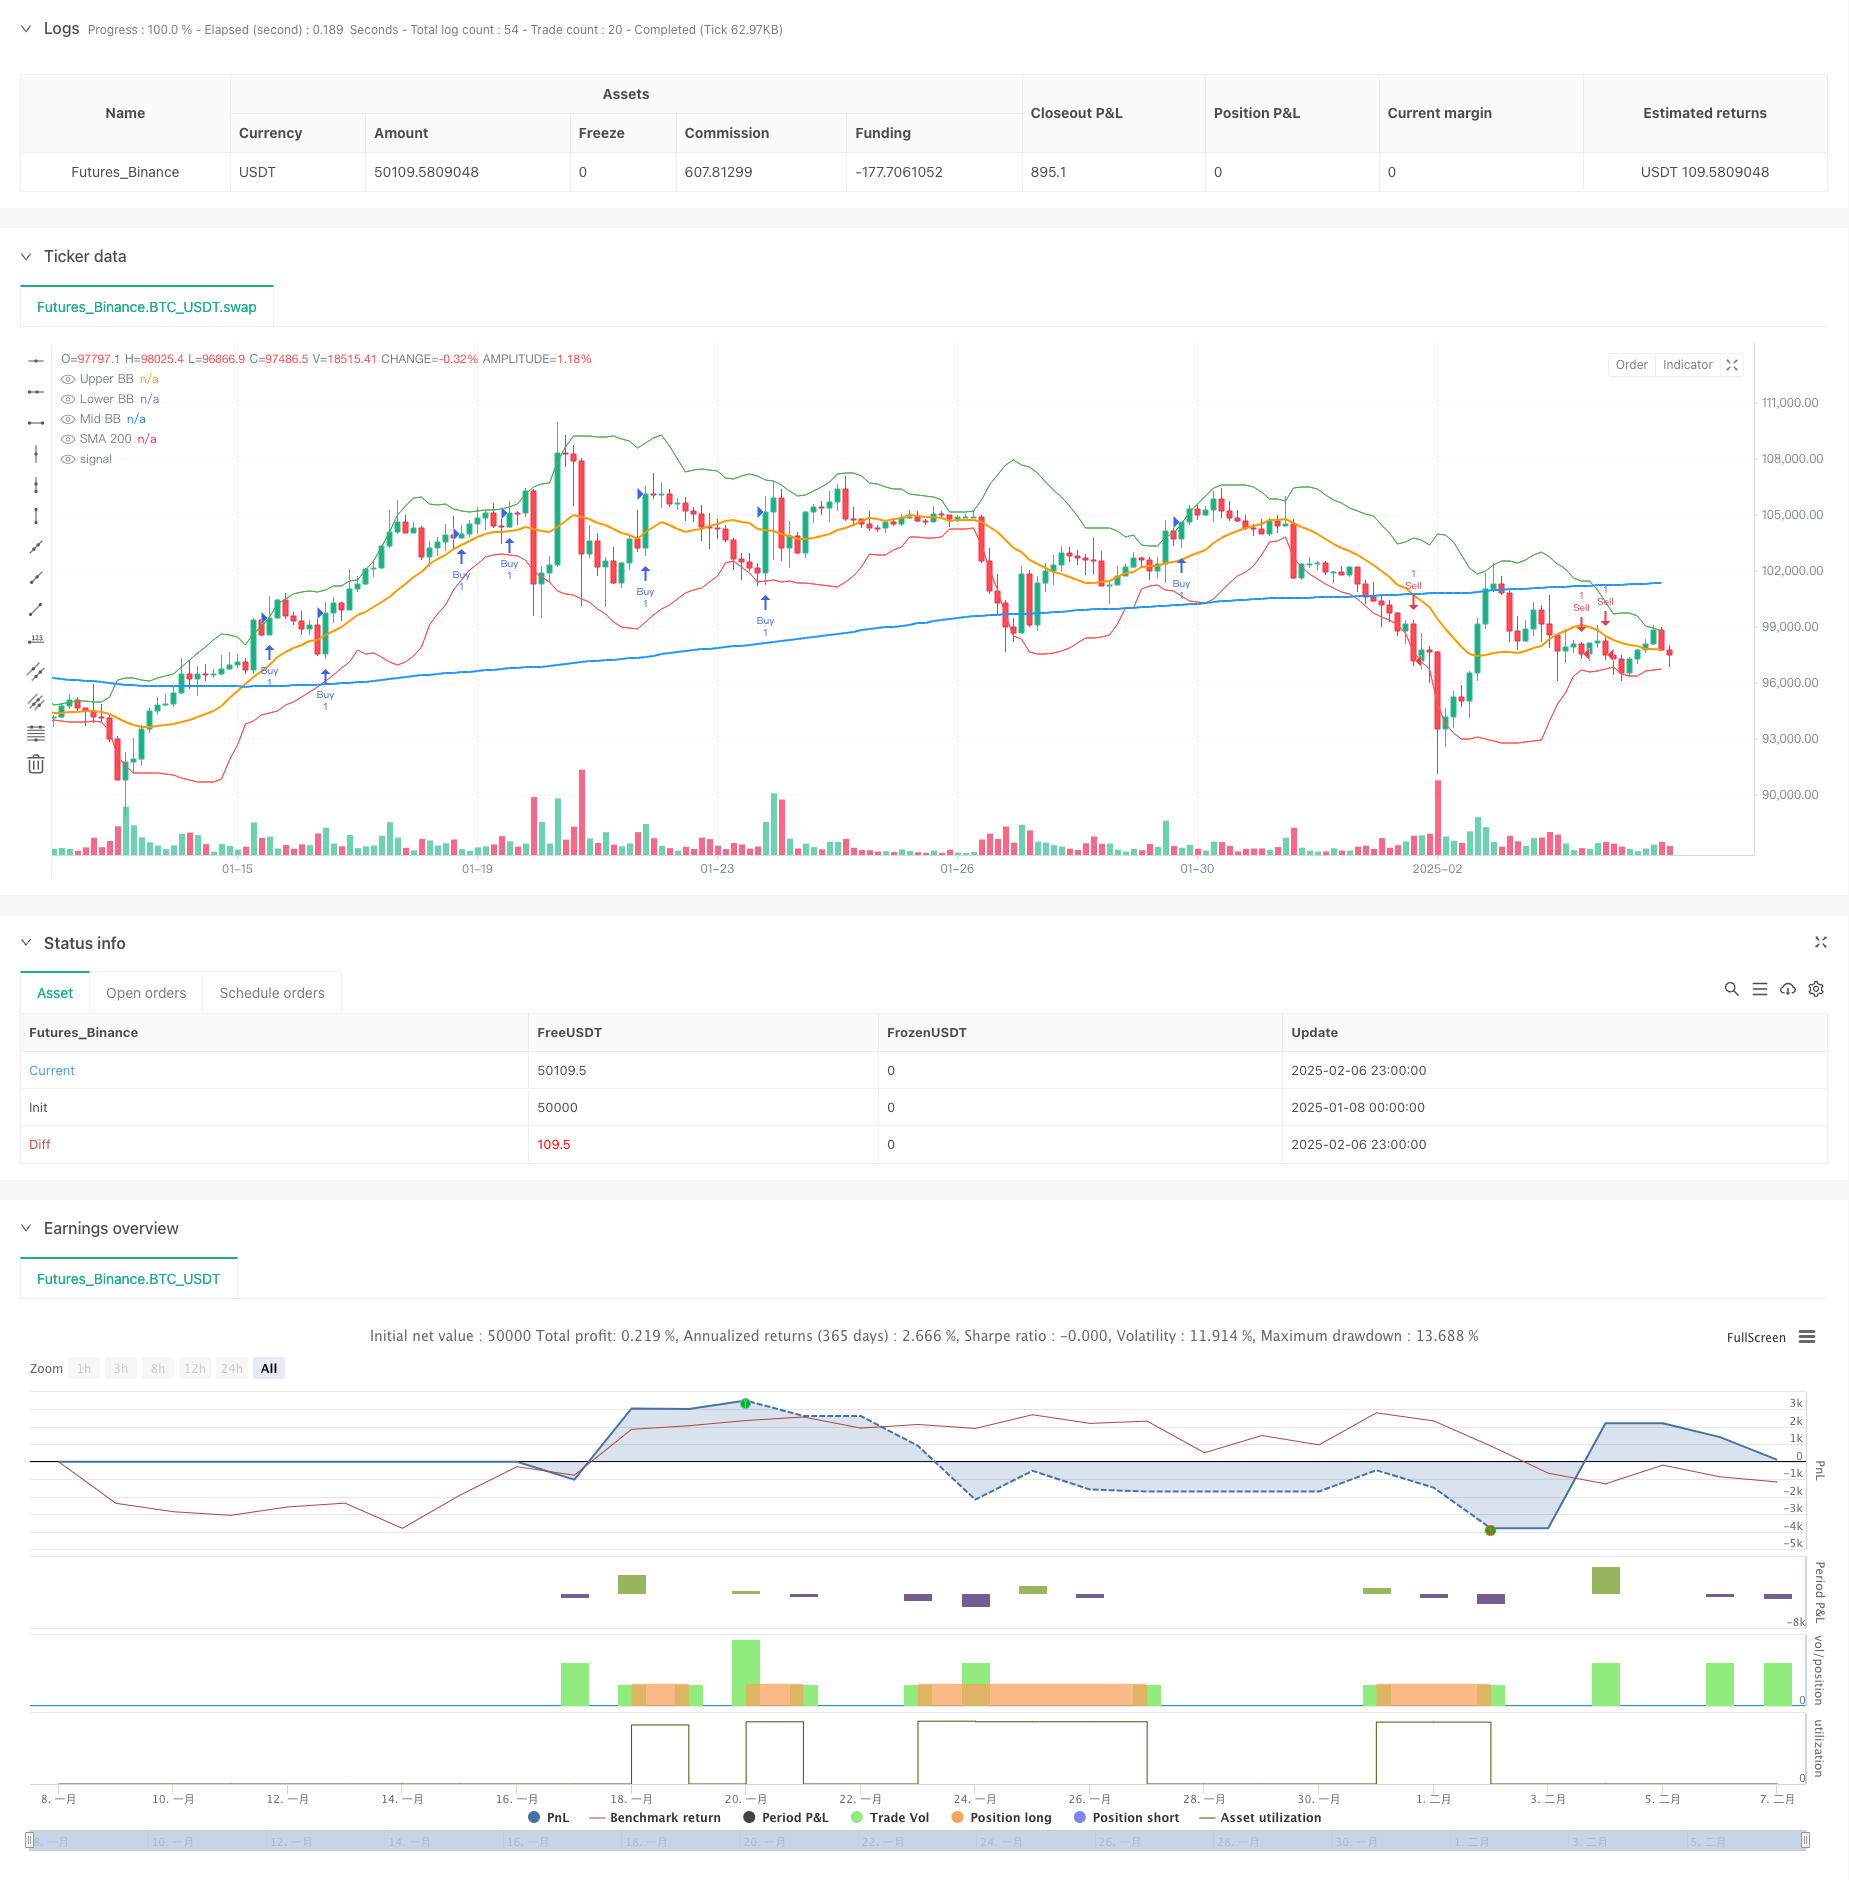
This strategy is a trend-following trading system that combines Moving Average (SMA), Bollinger Bands (BB), and candlestick patterns. It primarily identifies trading signals through engulfing patterns, confirmed by…
Overview
This strategy is a trend-following trading system that combines Moving Average (SMA), Bollinger Bands (BB), and candlestick patterns. It primarily identifies trading signals through engulfing patterns, confirmed by the 200-day moving average and Bollinger Bands middle line, while implementing a 1:2 risk-reward ratio for risk management.
Strategy Principles
The core logic relies on the combination of multiple technical indicators to confirm trading signals. Specifically:
- Uses 200-day SMA to determine the overall trend direction
- Employs Bollinger Bands middle line as secondary trend confirmation
- Identifies specific entry points through engulfing patterns
- Implements a fixed 1:2 risk-reward ratio for stop-loss and take-profit levels
The system enters long positions when bullish engulfing patterns appear above both the 200-day SMA and Bollinger Bands middle line. Conversely, it enters short positions when bearish engulfing patterns form below these levels.
Strategy Advantages
- Multiple technical indicators increase signal reliability
- Uses classic trend-following indicators that are easy to understand and implement
- Fixed risk-reward ratio promotes long-term profitable trading
- Clear entry and exit rules minimize subjective judgment
- Combines trend and momentum analysis for improved success rate
Strategy Risks
- May generate frequent false signals in ranging markets
- SMA and Bollinger Bands are lagging indicators, potentially missing opportunities
- Fixed risk-reward ratio might not suit all market conditions
- Stop-loss levels may be wide in highly volatile markets
- Requires a large sample size to demonstrate strategy effectiveness
Strategy Optimization
- Consider implementing dynamic risk-reward ratios based on market volatility
- Add volume indicators for additional confirmation
- Incorporate additional technical indicators to filter false signals
- Optimize entry timing through multi-timeframe signal coordination
- Introduce adaptive indicator parameters to improve strategy flexibility
Summary
This is a well-structured trend-following strategy with clear logic. The combination of moving averages, Bollinger Bands, and engulfing patterns ensures reliable trading signals while providing explicit risk management methods. Despite some inherent lag, it represents a highly operable trading system with controllable risk.
Source Pine Script
/*backtest
start: 2025-01-08 00:00:00
end: 2025-02-07 00:00:00
period: 3h
basePeriod: 3h
exchanges: [{"eid":"Futures_Binance","currency":"BTC_USDT"}]
*/

// This Pine Script™ code is subject to the terms of the Mozilla Public License 2.0 at https://mozilla.org/MPL/2.0/
// © ardhankurniawan

//@version=5
//@version=5
strategy("Engulfing Candles Strategy with Risk-Reward 1:2 by ardhankurniawan", overlay = true)

// Menyimpan harga pembukaan dan penutupan dari candle sebelumnya dan saat ini
openBarPrevious = open[1]
closeBarPrevious = close[1]
openBarCurrent = open
closeBarCurrent = close

// Menghitung SMA 200
sma200 = ta.sma(close, 200)

// Menghitung Bollinger Bands (BB) dengan periode 14 dan standar deviasi 2
length = 14
src = close
mult = 2.0
basis = ta.sma(src, length)  // Mid Bollinger Band (SMA)
dev = mult * ta.stdev(src, length)  // Standard deviation
upperBB = basis + dev
lowerBB = basis - dev
midBB = basis  // Mid Bollinger Band adalah SMA

// Kondisi Bullish Engulfing: harga pembukaan saat ini lebih rendah dari harga penutupan sebelumnya,
// harga pembukaan saat ini lebih rendah dari harga pembukaan sebelumnya, dan harga penutupan saat ini lebih tinggi dari harga pembukaan sebelumnya.
bullishEngulfing = (openBarCurrent <= closeBarPrevious) and (openBarCurrent < openBarPrevious) and (closeBarCurrent > openBarPrevious)

// Kondisi Bearish Engulfing: harga pembukaan saat ini lebih tinggi dari harga penutupan sebelumnya,
// harga pembukaan saat ini lebih tinggi dari harga pembukaan sebelumnya, dan harga penutupan saat ini lebih rendah dari harga pembukaan sebelumnya.
bearishEngulfing = (openBarCurrent >= closeBarPrevious) and (openBarCurrent > openBarPrevious) and (closeBarCurrent < openBarPrevious)

// Kondisi untuk membeli (buy) hanya jika Bullish Engulfing terjadi di atas SMA 200 dan Mid Bollinger Band
buyCondition = bullishEngulfing and close > sma200 and close > midBB

// Kondisi untuk menjual (sell) hanya jika Bearish Engulfing terjadi di bawah SMA 200 dan Mid Bollinger Band
sellCondition = bearishEngulfing and close < sma200 and close < midBB

// Menghitung Stop Loss dan Take Profit dengan Risk-Reward Ratio 1:2
longSL = low  // SL di low candle bullish engulfing (prev low)
longRR = (close - low) * 2  // TP dengan Risk-Reward 1:2
longTP = close + longRR  // TP untuk posisi long

shortSL = high  // SL di high candle bearish engulfing (prev high)
shortRR = (high - close) * 2  // TP dengan Risk-Reward 1:2
shortTP = close - shortRR  // TP untuk posisi short

// Strategi Buy ketika kondisi beli terpenuhi dengan SL dan TP
if buyCondition
    strategy.entry("Buy", strategy.long)  // Perintah beli ketika Bullish Engulfing terjadi di atas SMA 200 dan Mid Bollinger Band
    strategy.exit("Sell Exit", from_entry = "Buy", stop = longSL, limit = longTP)  // SL dan TP untuk posisi long

// Strategi Sell ketika kondisi jual terpenuhi dengan SL dan TP
if sellCondition
    strategy.entry("Sell", strategy.short)  // Perintah jual ketika Bearish Engulfing terjadi di bawah SMA 200 dan Mid Bollinger Band
    strategy.exit("Buy Exit", from_entry = "Sell", stop = shortSL, limit = shortTP)  // SL dan TP untuk posisi short

// Menambahkan kondisi untuk keluar dari posisi
if sellCondition
    strategy.close("Buy")  // Menutup posisi beli jika Bearish Engulfing terjadi di bawah SMA 200 dan Mid Bollinger Band
if buyCondition
    strategy.close("Sell")  // Menutup posisi jual jika Bullish Engulfing terjadi di atas SMA 200 dan Mid Bollinger Band

// Plotting SMA 200 dan Bollinger Bands
plot(sma200, color = color.blue, linewidth = 2, title = "SMA 200")
plot(upperBB, color = color.green, linewidth = 1, title = "Upper BB")
plot(lowerBB, color = color.red, linewidth = 1, title = "Lower BB")
plot(midBB, color = color.orange, linewidth = 2, title = "Mid BB")

// Alert condition
alertcondition(buyCondition, title = "Bullish Engulfing Above SMA 200 and Mid BB", message = "[CurrencyPair] [TimeFrame], Bullish Engulfing above SMA 200 and Mid Bollinger Band")
alertcondition(sellCondition, title = "Bearish Engulfing Below SMA 200 and Mid BB", message = "[CurrencyPair] [TimeFrame], Bearish Engulfing below SMA 200 and Mid Bollinger Band")
Published by ChaoZhang on the FMZ strategy square · last modified 2025-02-08. Collected in the Quant Trading Vault. Unvalidated research: re-test with your own data and costs before trusting it.
Build this with AgenKit
A spec is not a trading system. Paste this into your coding agent and AgenKit runs a specialist team — architecture, test-first build, risk gates, review — with paper trading on by default.
/agenkit build a production-grade trading bot with a backtest engine, risk controls and paper trading by default from strategies/Combined-SMA-and-Bollinger-Bands-Engulfing-Pattern-Trading-Strategy.md- npx agenkit install engineering-kit in your project
- Paste the command into your agent and approve each phase
- Get tests, backtest, risk controls and a paper-trading switch
Understand it first
Before you run this, read the lesson behind the idea and how to backtest it honestly. Specs like this one are the survivors of an unknown number of trials; deflate their results accordingly.
Related specs
- ADX Momentum Trend StrategyPine Script · Momentum · 10m
- Bollinger Bands Momentum Trend Following Quantitative StrategyPine Script · Momentum · 1d
- Momentum Oscillator Bollinger Band RSI Trading StrategyPine Script · Momentum · 1m
- Moving Average Candle Regression StrategyPine Script · Momentum · 15m
- Multi Timeframe Unified Strategy Based on Quantitative Momentum and Convergence DivergencePine Script · Momentum · 1d
- Adaptive Trading Strategy Based on Momentum IndicatorsPine Script · Momentum · 1d