Strategy vault / Trend following
Combo Trend Tracking Strategy
The combo trend tracking strategy is a quantitative trading strategy that combines double indicators to judge the trend. It first uses the 123 reversal indicator to determine price reversal signals, and then combines…
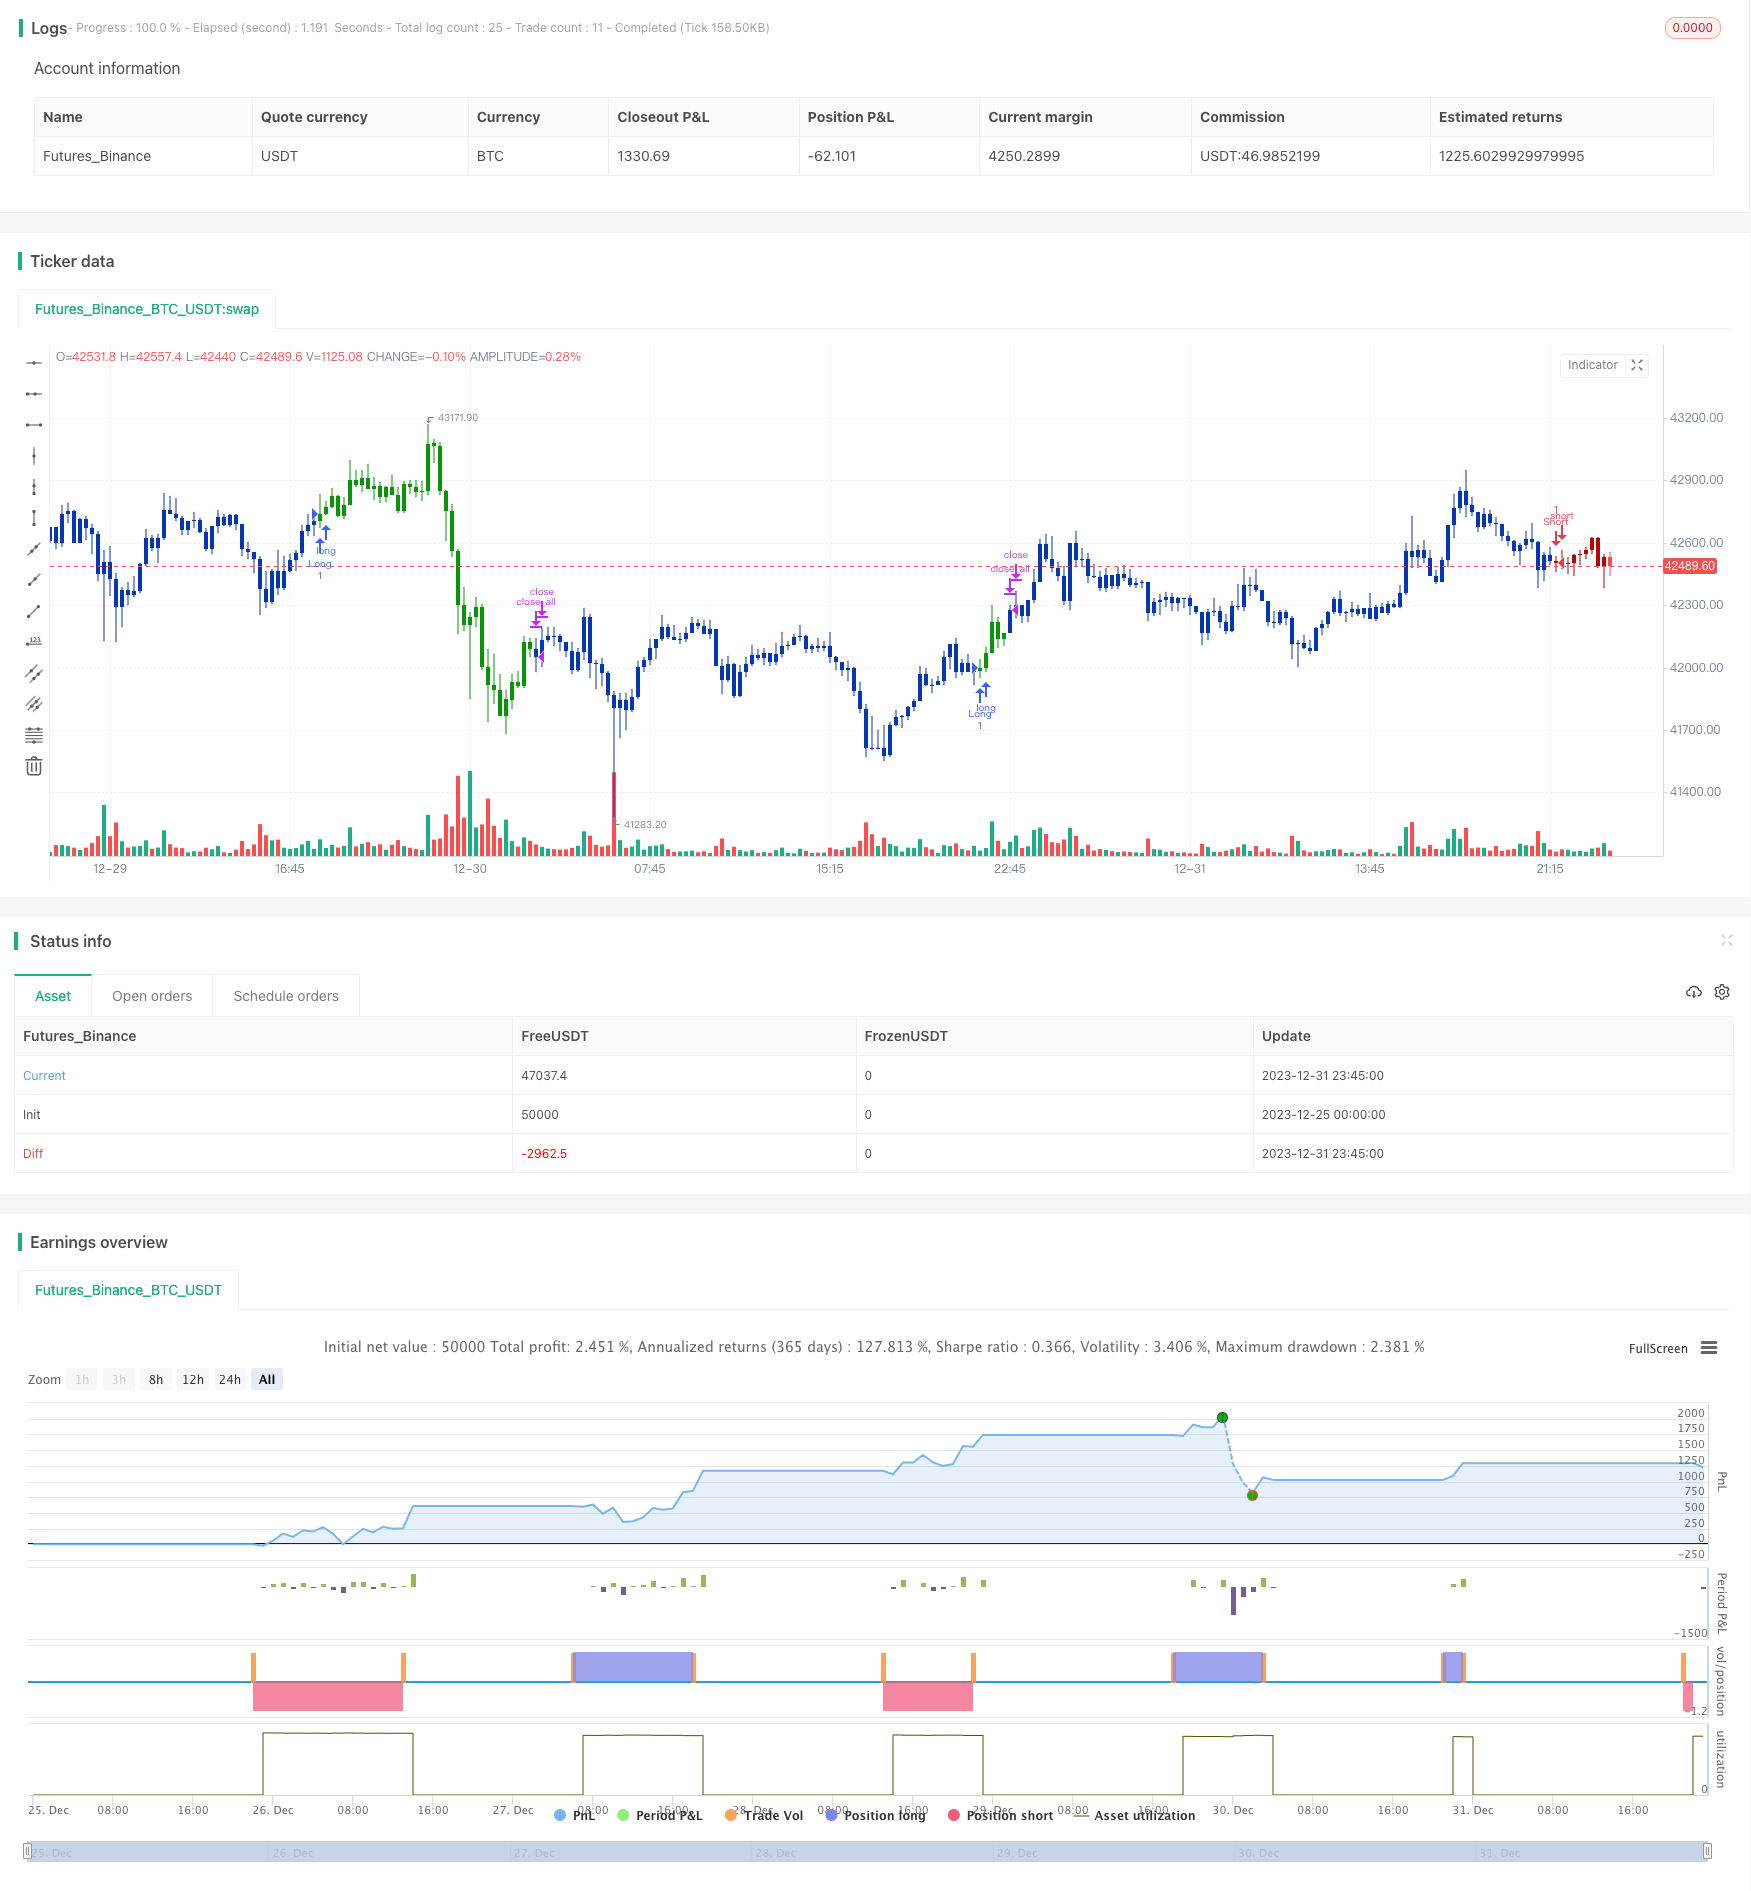
Overview
The combo trend tracking strategy is a quantitative trading strategy that combines double indicators to judge the trend. It first uses the 123 reversal indicator to determine price reversal signals, and then combines the directional trend index (DTI) to judge the price trend direction, so as to achieve double confirmation order signals.
Strategy Principle
The strategy consists of two main parts:
123 Reversal Indicator
The judging principle of the 123 reversal indicator is:
When the closing price rises continuously for 2 days and the 9-day slow K-line is lower than 50, go long;
When the closing price falls continuously for 2 days and the 9-day fast K-line is higher than 50, go short.
This can capture the timing point of price reversal.
Directional Trend Index (DTI)
The DTI indicator judging principle is: calculate the moving average of absolute price fluctuation over a period of time, and then divide it by the average volatility of price.
When DTI is higher than the overbought line, it means the current is a downward trend;
When DTI is lower than the oversold line, it means the current is a upward trend.
Combination
First, use the 123 reversal indicator to determine whether a price reversal signal occurs. Then, combined with the DTI indicator to determine the overall trend direction after the reversal.
This avoids the problem of false reversal caused by relying solely on reversal signals, thereby improving the stability and profitability of strategies.
Advantages
Double indicator confirmation avoids risks caused by false reversals
Combining reversals and trends strikes a balance between operational flexibility and stability
Large parameter optimization space, can be flexibly adjusted to adapt to different varieties
Risk Analysis
Setting DTI parameters requires experience, inappropriate will misjudge the trend direction
Reversal does not necessarily represent a new trend, there may be range-bound oscillations
Need effective stop loss to control single loss
Solutions: Parameter optimization test + Reasonable stop loss + Combination of other indicators
Optimization Direction
Test DTI parameters to find optimal parameter combinations
Use other indicators to filter out false reversal signals
Optimize stop loss strategies and find optimal stop loss points
Summary
The combo trend tracking strategy effectively determines the essentiality of price reversals and captures new trend directions through the double confirmation of 123 reversals and DTI, thereby improving the profitability of strategies. However, parameter settings and stop loss strategies still require continuous testing and optimization in order to maximize the profit space of strategies. Overall, by combining the advantages of trend trading and reversal trading, this is a worthwhile quantitative strategy to recommend.
Parameters
| Name | Default | What it controls |
|---|---|---|
| v_input_1 | 14 | Length |
| v_input_2 | true | KSmoothing |
| v_input_3 | 3 | DLength |
| v_input_4 | 50 | Level |
| v_input_5 | 14 | r |
| v_input_6 | 10 | s |
| v_input_7 | 5 | u |
| v_input_8 | 45 | OS |
| v_input_9 | -45 | OB |
| v_input_10 | false | Trade reverse |
Source Pine Script
/*backtest
start: 2023-12-25 00:00:00
end: 2024-01-01 00:00:00
period: 15m
basePeriod: 5m
exchanges: [{"eid":"Futures_Binance","currency":"BTC_USDT"}]
*/

//@version=4
////////////////////////////////////////////////////////////
//  Copyright by HPotter v1.0 19/02/2020
// This is combo strategies for get a cumulative signal.
//
// First strategy
// This System was created from the Book "How I Tripled My Money In The
// Futures Market" by Ulf Jensen, Page 183. This is reverse type of strategies.
// The strategy buys at market, if close price is higher than the previous close
// during 2 days and the meaning of 9-days Stochastic Slow Oscillator is lower than 50.
// The strategy sells at market, if close price is lower than the previous close price
// during 2 days and the meaning of 9-days Stochastic Fast Oscillator is higher than 50.
//
// Second strategy
// This technique was described by William Blau in his book "Momentum,
// Direction and Divergence" (1995). His book focuses on three key aspects
// of trading: momentum, direction and divergence. Blau, who was an electrical
// engineer before becoming a trader, thoroughly examines the relationship between
// price and momentum in step-by-step examples. From this grounding, he then looks
// at the deficiencies in other oscillators and introduces some innovative techniques,
// including a fresh twist on Stochastics. On directional issues, he analyzes the
// intricacies of ADX and offers a unique approach to help define trending and
// non-trending periods.
// Directional Trend Index is an indicator similar to DM+ developed by Welles Wilder.
// The DM+ (a part of Directional Movement System which includes both DM+ and
// DM- indicators) indicator helps determine if a security is "trending." William
// Blau added to it a zeroline, relative to which the indicator is deemed positive or
// negative. A stable uptrend is a period when the DTI value is positive and rising, a
// downtrend when it is negative and falling.
//
// WARNING:
// - For purpose educate only
// - This script to change bars colors.
////////////////////////////////////////////////////////////
Reversal123(Length, KSmoothing, DLength, Level) =>
    vFast = sma(stoch(close, high, low, Length), KSmoothing)
    vSlow = sma(vFast, DLength)
    pos = 0.0
    pos := iff(close[2] < close[1] and close > close[1] and vFast < vSlow and vFast > Level, 1,
	         iff(close[2] > close[1] and close < close[1] and vFast > vSlow and vFast < Level, -1, nz(pos[1], 0)))
	pos

TDI(r,s,u,OS,OB) =>
    pos = 0.0
    xHMU = iff(high - high[1] > 0, high - high[1], 0)
    xLMD = iff(low - low[1] < 0, -(low - low[1]), 0)
    xPrice = xHMU - xLMD
    xPriceAbs = abs(xPrice)
    xuXA = ema(ema(ema(xPrice, r),s),u)
    xuXAAbs = ema(ema(ema(xPriceAbs, r),s),u)
    Val1 = 100 * xuXA
    Val2 = xuXAAbs
    DTI = iff(Val2 != 0, Val1 / Val2, 0)
    pos := iff(DTI > OS, -1,
    	     iff(DTI < OB, 1, nz(pos[1], 0)))
    pos

strategy(title="Combo Backtest 123 Reversal & Directional Trend Index (DTI)", shorttitle="Combo", overlay = true)
Length = input(14, minval=1)
KSmoothing = input(1, minval=1)
DLength = input(3, minval=1)
Level = input(50, minval=1)
//-------------------------
r = input(14, minval=1)
s = input(10, minval=1)
u = input(5, minval=1)
OS = input(45, minval=1)
OB = input(-45, maxval=-1)
reverse = input(false, title="Trade reverse")
posReversal123 = Reversal123(Length, KSmoothing, DLength, Level)
posTDI = TDI(r,s,u,OS,OB)
pos = iff(posReversal123 == 1 and posTDI == 1 , 1,
	   iff(posReversal123 == -1 and posTDI == -1, -1, 0))
possig = iff(reverse and pos == 1, -1,
          iff(reverse and pos == -1 , 1, pos))
if (possig == 1)
    strategy.entry("Long", strategy.long)
if (possig == -1)
    strategy.entry("Short", strategy.short)
if (possig == 0)
    strategy.close_all()
barcolor(possig == -1 ? #b50404: possig == 1 ? #079605 : #0536b3 )Published by ChaoZhang on the FMZ strategy square · last modified 2024-01-02. Collected in the Quant Trading Vault. Unvalidated research: re-test with your own data and costs before trusting it.
Build this with AgenKit
A spec is not a trading system. Paste this into your coding agent and AgenKit runs a specialist team — architecture, test-first build, risk gates, review — with paper trading on by default.
/agenkit build a production-grade trading bot with a backtest engine, risk controls and paper trading by default from strategies/Combo-Trend-Tracking-Strategy.md- npx agenkit install engineering-kit in your project
- Paste the command into your agent and approve each phase
- Get tests, backtest, risk controls and a paper-trading switch
Understand it first
Before you run this, read the lesson behind the idea and how to backtest it honestly. Specs like this one are the survivors of an unknown number of trials; deflate their results accordingly.
Related specs
- EMA AROON ASHPine Script · Trend following · 3m
- EMA SMA Multi Indicator Comprehensive Trend Following StrategyPine Script · Trend following · 1h
- Trend Following Strategy Based on Multiple IndicatorsPine Script · Trend following · 2h
- WaveTrend and DER Based Swing Trading StrategyPine Script · Trend following · 1d
- Dual EMA Stochastic Trend Following Trading StrategyPine Script · Trend following · 1d
- Trend Following Strategy Based on Moving Average Crossover 430022Pine Script · Trend following · 1d