Strategy vault / Trend following
Crude Oil ADX Trend Following Strategy
This strategy is adapted from Kevin Davey's free crude oil futures trading strategy. It utilizes the ADX indicator to determine the trend in the crude oil market and, combined with the price breakout principle…
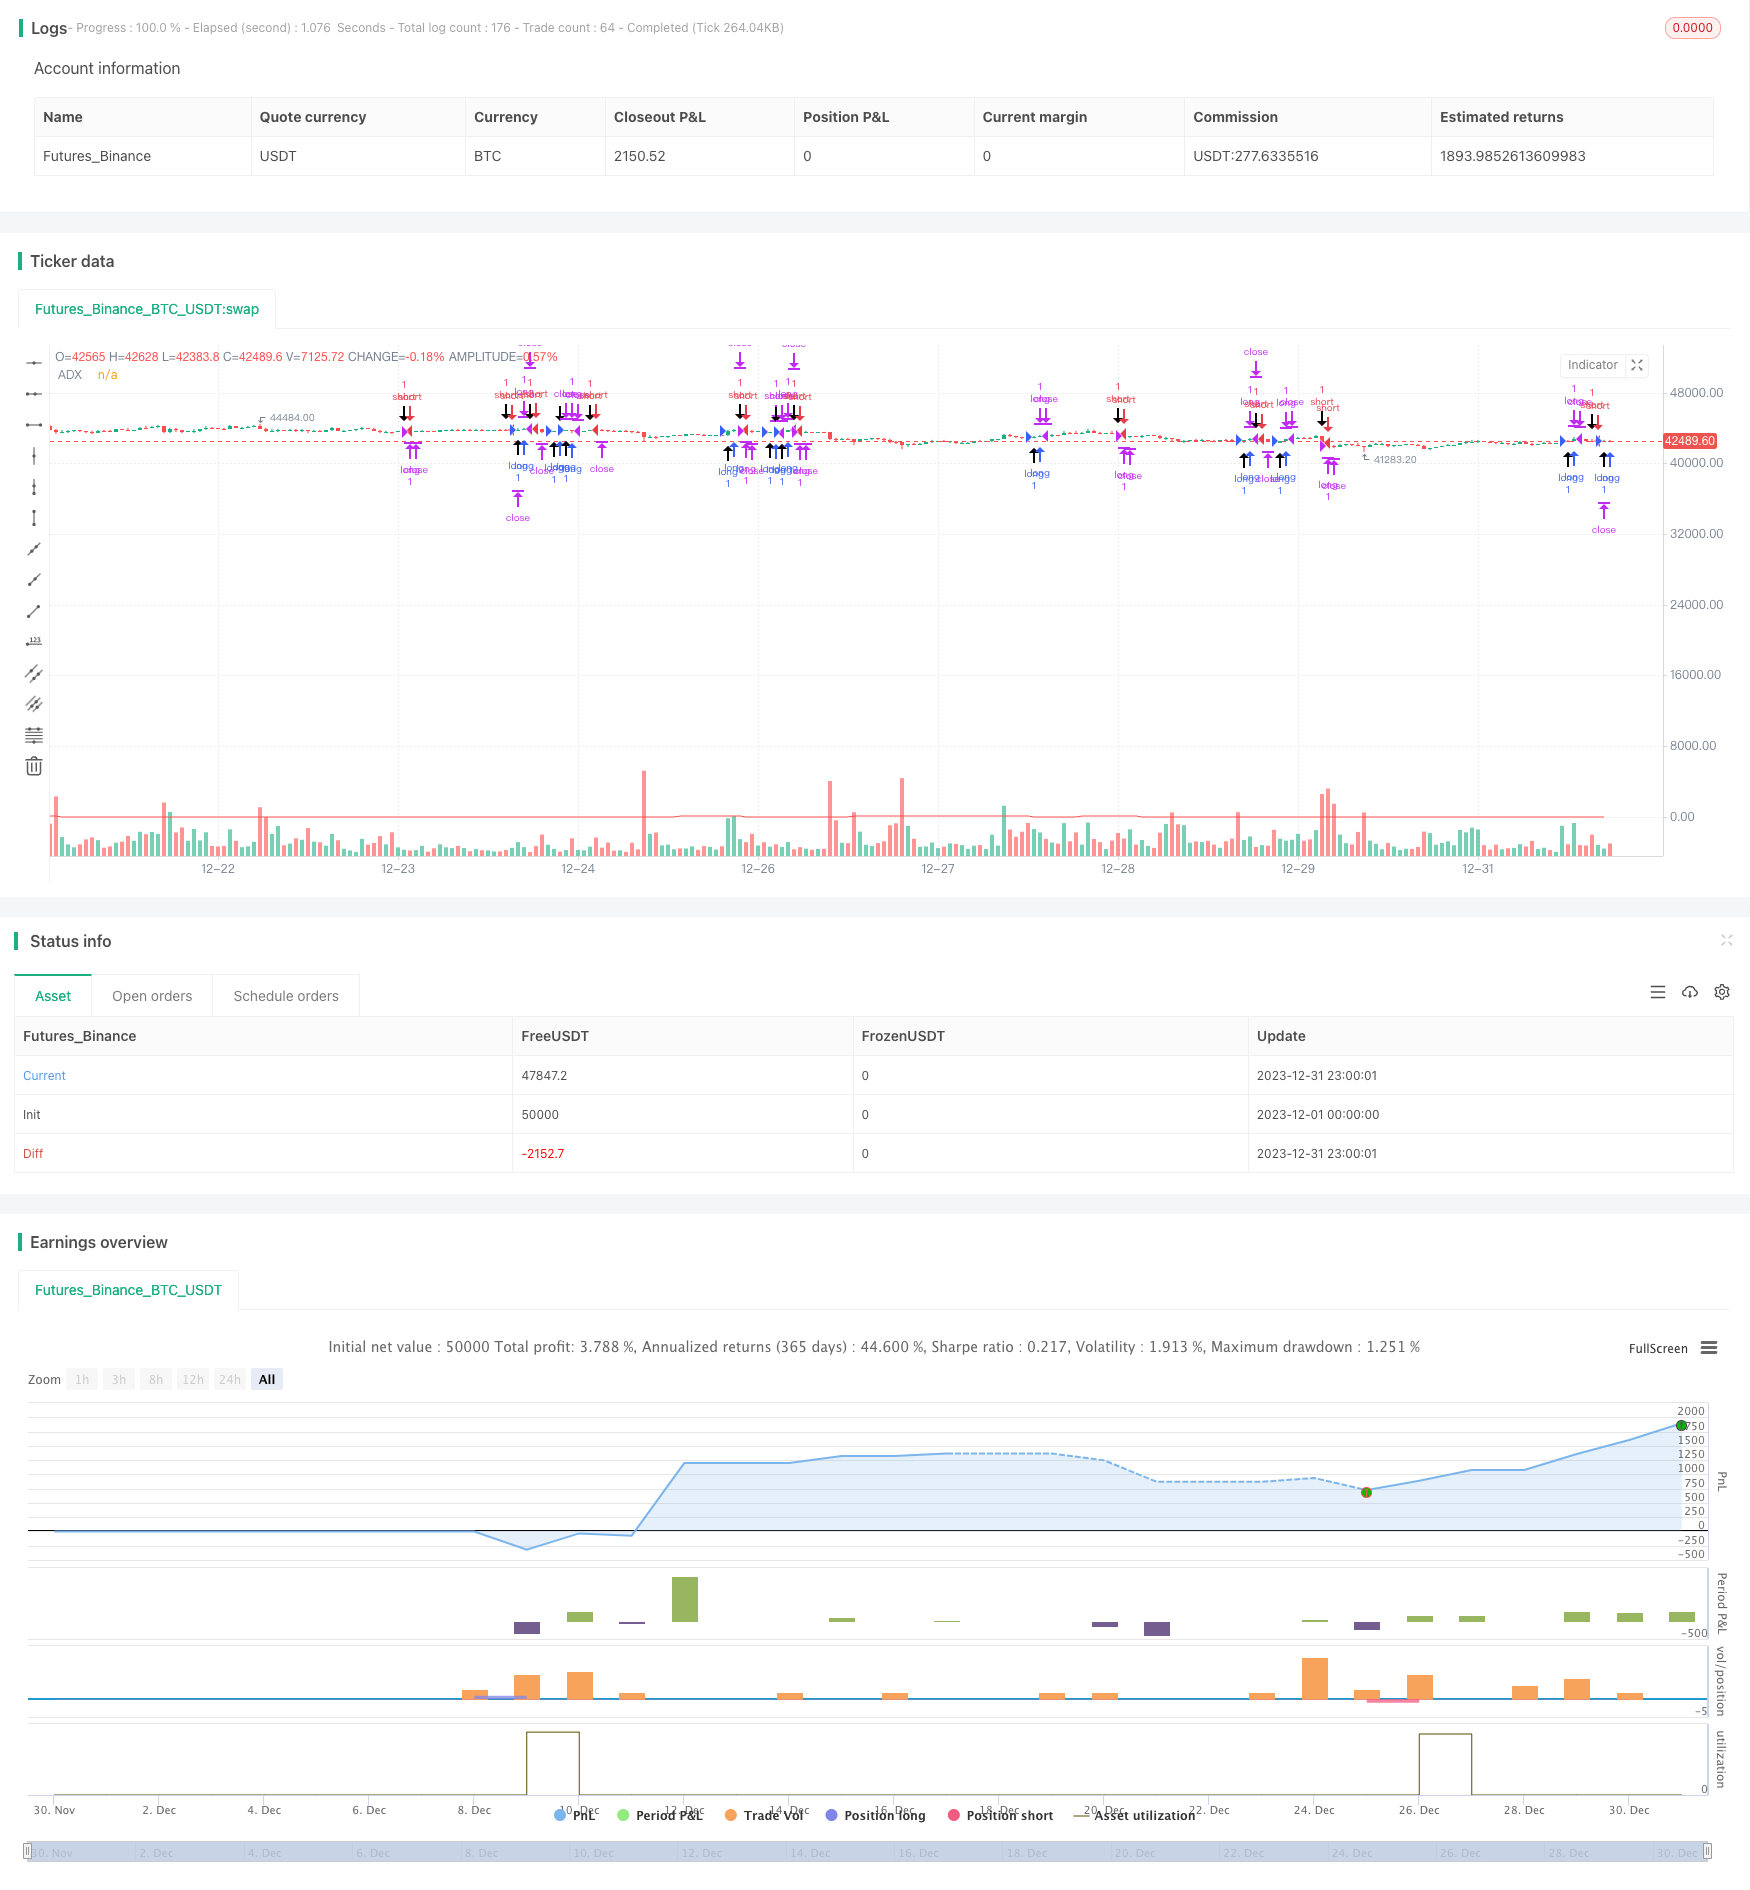
Overview
This strategy is adapted from Kevin Davey's free crude oil futures trading strategy. It utilizes the ADX indicator to determine the trend in the crude oil market and, combined with the price breakout principle, implements a simple and practical automated trading strategy for crude oil.
Strategy Principle
- Calculate the 14-period ADX indicator
- When ADX>10, the market is considered to have a trend
- If the closing price is higher than the closing price 65 bars ago, it indicates a price breakout and a long signal
- If the closing price is lower than the closing price 65 bars ago, it indicates a price breakout and a short signal
- Set stop loss and take profit after entering the position
The strategy mainly relies on the ADX indicator to determine the trend, and generates trading signals based on fixed-cycle price breakouts under trend conditions. The overall strategy logic is very simple and clear.
Advantage Analysis
- Use ADX to determine trends and avoid missing trend opportunities
- Fixed-cycle price breakouts generate signals with good backtest results
- Intuitive and simple code, easy to understand and modify
- Kevin Davey's multi-year live trading verification, non-curve fitting
Risk Analysis
- As the main indicator, ADX is sensitive to parameter selection and breakout cycle selection
- Fixed-cycle breakouts may miss some opportunities
- Improper stop loss and take profit settings may increase losses
- There may be differences between live trading and backtest results
Optimization Directions
- Optimize ADX parameters and breakout cycles
- Increase dynamic adjustment of position size
- Continuously modify and improve the strategy based on backtest results and live trading verification
- Introduce machine learning and deep learning techniques for strategy optimization
Summary
Overall this is a very practical crude oil trading strategy. It uses the ADX indicator to determine the trend very reasonably. The price breakout principle is simple and effective with good backtest results. At the same time, as Kevin Davey's public free strategy, it has very strong reliability in actual combat. Although there is still room for improvement in the strategy, it is a very suitable choice for beginners and small capital traders to get started and practice.
Parameters
| Name | Default | What it controls |
|---|---|---|
| v_input_1 | 14 | ADX Smoothing |
| v_input_2 | 14 | DI Length |
Source Pine Script
/*backtest
start: 2023-12-01 00:00:00
end: 2023-12-31 23:59:59
period: 1h
basePeriod: 15m
exchanges: [{"eid":"Futures_Binance","currency":"BTC_USDT"}]
*/

// Strategy idea coded from EasyLanguage to Pinescript
//@version=5
strategy("Kevin Davey Crude free crude oil strategy", shorttitle="CO Fut", format=format.price, precision=2, overlay = true, calc_on_every_tick = true)
adxlen = input(14, title="ADX Smoothing")
dilen = input(14, title="DI Length")
dirmov(len) =>
	up = ta.change(high)
	down = -ta.change(low)
	plusDM = na(up) ? na : (up > down and up > 0 ? up : 0)
	minusDM = na(down) ? na : (down > up and down > 0 ? down : 0)
	truerange = ta.rma(ta.tr, len)
	plus = fixnan(100 * ta.rma(plusDM, len) / truerange)
	minus = fixnan(100 * ta.rma(minusDM, len) / truerange)
	[plus, minus]
adx(dilen, adxlen) =>
	[plus, minus] = dirmov(dilen)
	sum = plus + minus
	adx = 100 * ta.rma(math.abs(plus - minus) / (sum == 0 ? 1 : sum), adxlen)
sig = adx(dilen, adxlen)
plot(sig, color=color.red, title="ADX")

buy = sig > 10 and (close - close[65]) > 0 and (close - close[65])[1] < 0
sell = sig > 10 and (close - close[65]) < 0 and (close - close[65])[1] > 0

plotshape(buy, style = shape.arrowup, location = location.belowbar,size = size.huge)
plotshape(sell, style = shape.arrowdown, location = location.abovebar,size = size.huge)

if buy
	strategy.entry("long", strategy.long)
if sell
	strategy.entry("short", strategy.short)

if strategy.position_size != 0
	strategy.exit("long", profit = 450, loss = 300)
	strategy.exit("short", profit = 450, loss = 300)


// GetTickValue() returns the currency value of the instrument's
// smallest possible price movement.
GetTickValue() =>
    syminfo.mintick * syminfo.pointvalue

// On the last historical bar, make a label to display the
// instrument's tick value
if barstate.islastconfirmedhistory
    label.new(x=bar_index + 1, y=close, style=label.style_label_left,
         color=color.black, textcolor=color.white, size=size.large,
         text=syminfo.ticker + " has a tick value of:\n" +
             syminfo.currency + " " + str.tostring(GetTickValue()))
Published by ChaoZhang on the FMZ strategy square · last modified 2024-01-25. Collected in the Quant Trading Vault. Unvalidated research: re-test with your own data and costs before trusting it.
Build this with AgenKit
A spec is not a trading system. Paste this into your coding agent and AgenKit runs a specialist team — architecture, test-first build, risk gates, review — with paper trading on by default.
/agenkit build a production-grade trading bot with a backtest engine, risk controls and paper trading by default from strategies/Crude-Oil-ADX-Trend-Following-Strategy.md- npx agenkit install engineering-kit in your project
- Paste the command into your agent and approve each phase
- Get tests, backtest, risk controls and a paper-trading switch
Understand it first
Before you run this, read the lesson behind the idea and how to backtest it honestly. Specs like this one are the survivors of an unknown number of trials; deflate their results accordingly.
Related specs
- ADX MA and EMA Long Only Trend Tracking StrategyPine Script · Trend following · 1d
- Adaptive Risk Management Strategy Based on Dynamic ATR and Moving Average CrossoverPine Script · Trend following · 2h
- Bollinger Band Trend ChaserPine Script · Trend following · 1d
- Dual EMA Crossover Oscillation Tracking StrategyPine Script · Trend following · 5m
- Dual EMA Filtered ATR Adaptive Trend Following StrategyPine Script · Trend following · 1h
- Dual Moving Average Trend Detection with Volatility Based Stop Loss StrategyPine Script · Trend following · 1d