Strategy vault / Mean reversion
Cycle Reversal Trend Following Strategy after Pullback
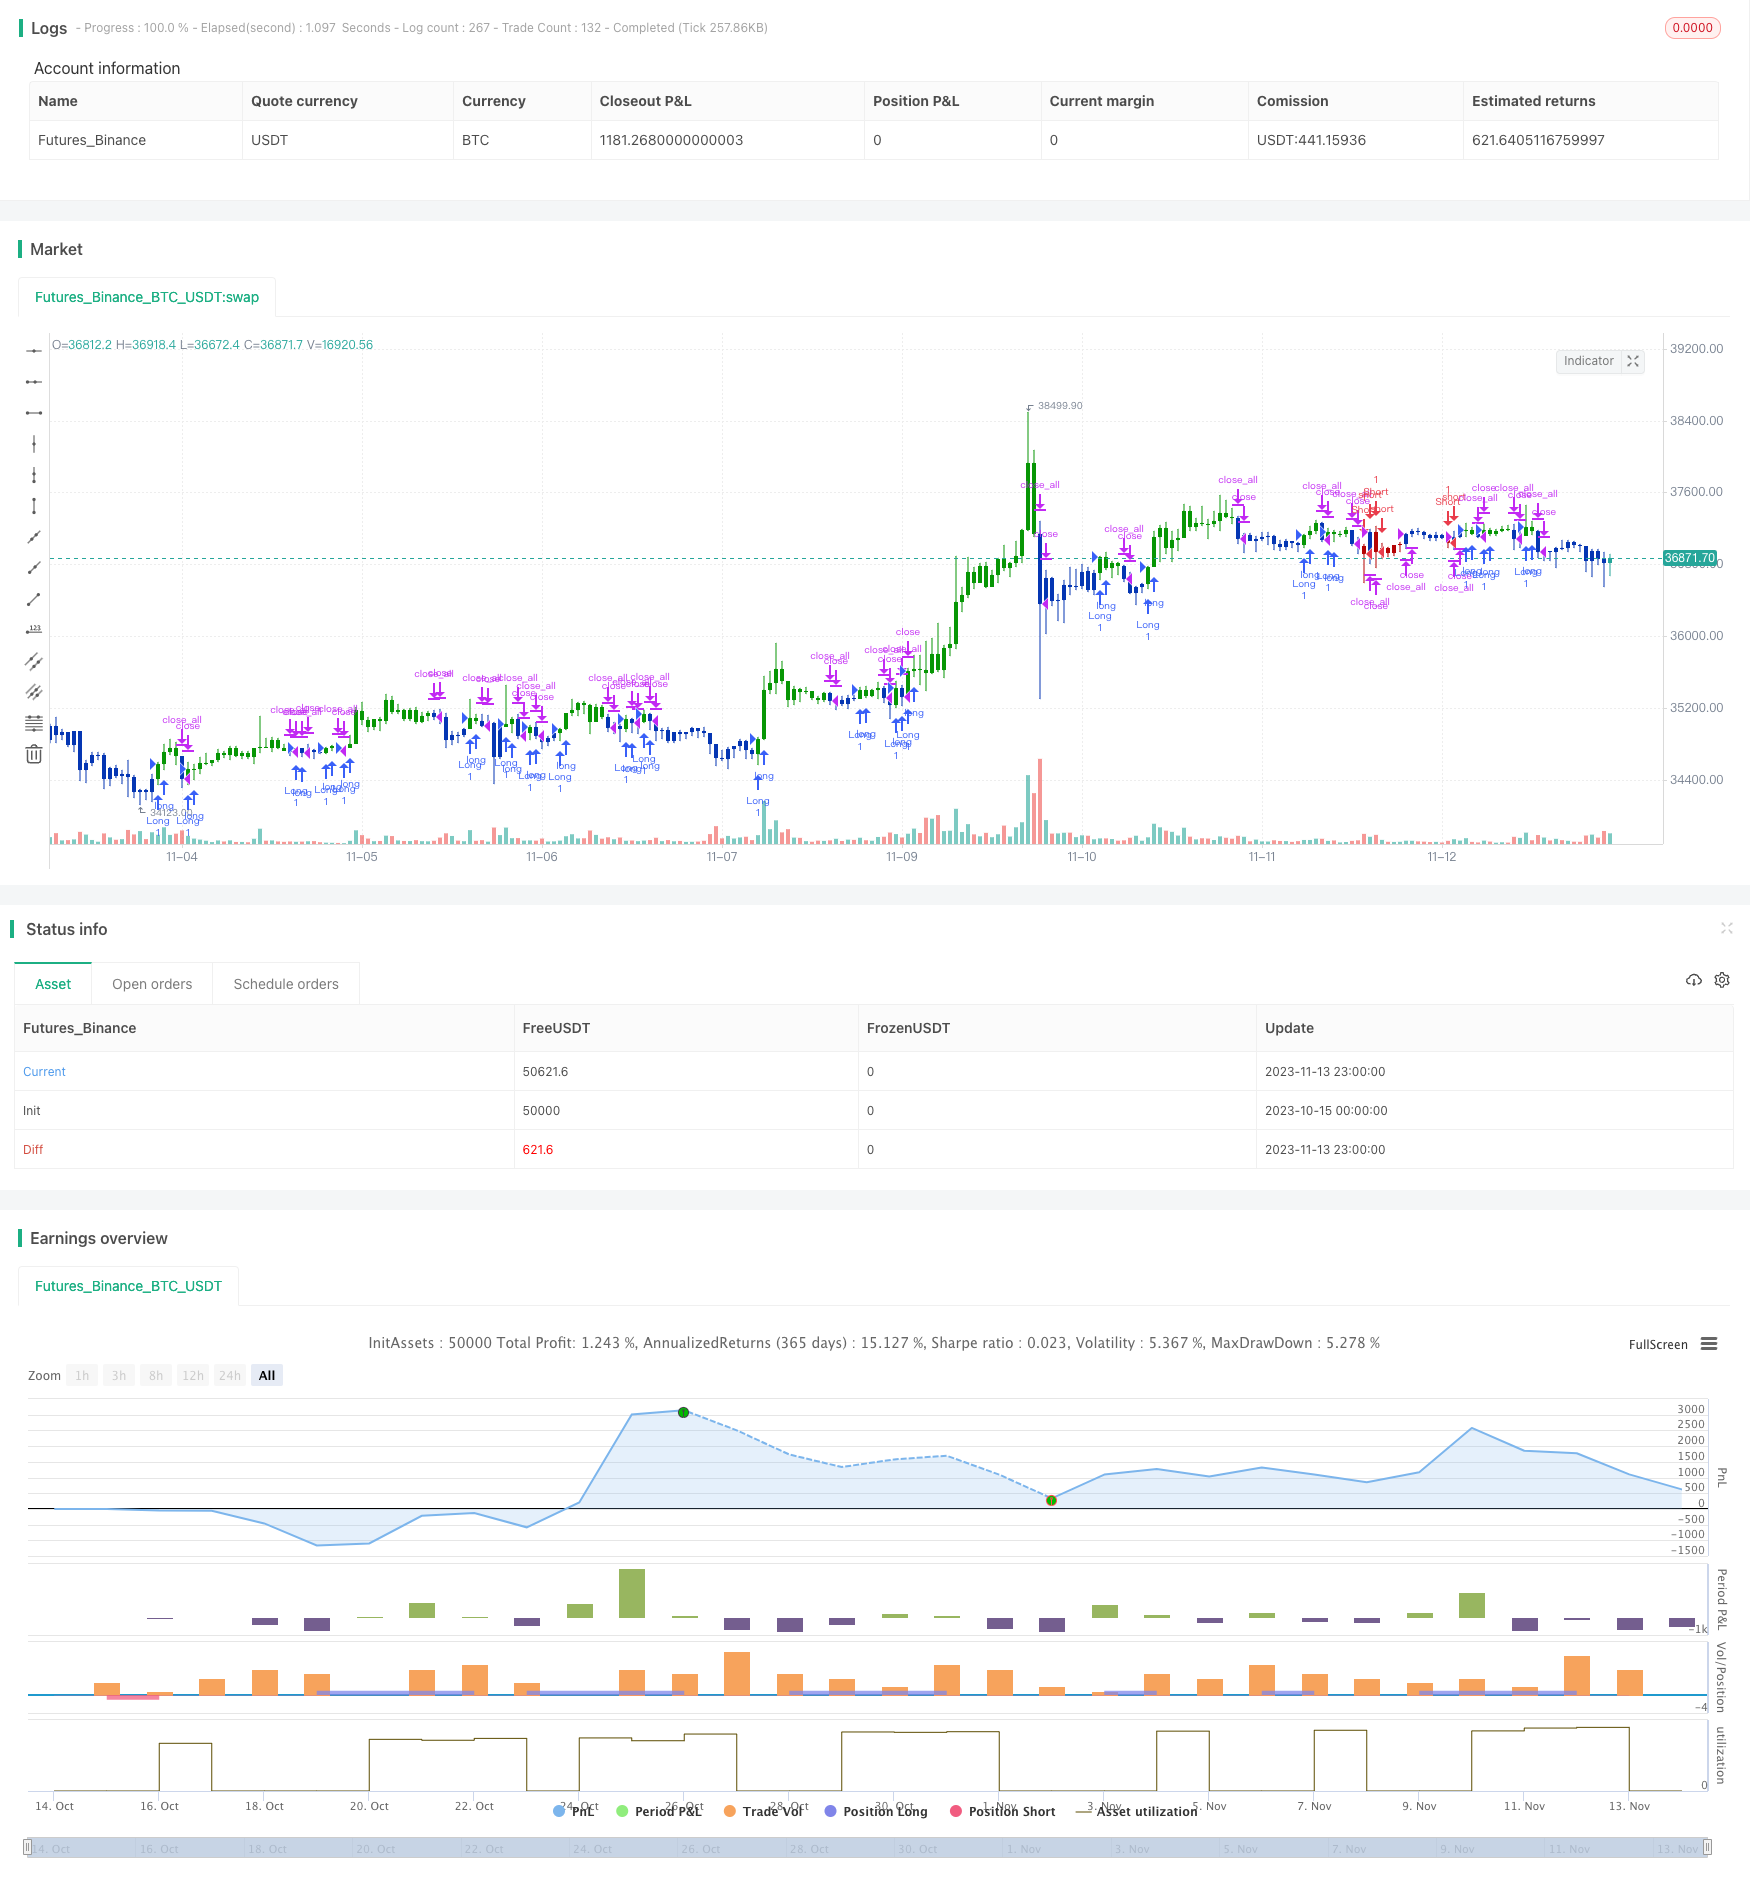
This strategy combines two indicators: moving average reversal and price detrend oscillator to generate trading signals and catch the rebound trend after cycle reversals.
Overview
This strategy combines two indicators: moving average reversal and price detrend oscillator to generate trading signals and catch the rebound trend after cycle reversals.
Principles
This strategy mainly utilizes the following two technical indicators for trading signal judgment:
Moving Average Reversal
It calculates the price uptrend or downtrend in the past two days combined with the fast line K value to determine if a reversal signal occurs. When the price keeps rising in the past two days and the fast line K value is lower than the slow line K value, a buy signal is generated. When the price keeps falling in the past two days and the fast line K value is higher than the slow line K value, a sell signal is generated.
Price Detrend Oscillator
The Detrend Price Oscillator draws a horizontal moving average line and identifies price cycles based on the relationship between the price and the line. It filters out trends longer than the calculation period, thus revealing hidden short-term fluctuations. When the price is above the moving average line, it is a buy signal. When the price is below the line, it is a sell signal.
This strategy combines the signals of the two indicators. That is, when a moving average reversal signal appears and the price detrend oscillator also gives a confirming reversal signal, a trading order is generated. This can filter out some invalid reversal signals and catch the rebound trend after reversals.
Advantages
The biggest advantage of this strategy is that it makes good use of the strengths of the two indicators for complementary confirmation, which can effectively filter out invalid signals and increase signal reliability.
The moving average reversal indicator itself tends to generate false signals. Relying solely on it for judgments tends to chase tops and hit bottoms. The introduction of the price detrend oscillator for combination can avoid reversal operations in non-ideal oscillation zones.
The parameter settings of the price detrend oscillator also determine that it only identifies short-term fluctuations, which matches very well with the judgment of the moving average reversal and can identify reasonable reversal timing.
Risks
The main risks of this strategy include:
- Insufficient rebound momentum, tends to be trapped
Moving average reversals tend to occur in sideways ranges. If the rebound momentum is insufficient, it is likely to callback and touch the stop loss again, failing to profit.
- Improper parameter settings
If the parameters of the price detrend oscillator are set too large, it will identify medium- and long-term trends; if too small, it will increase misjudgment risks. Parameters need to be carefully tested for different products.
- Reversal failures due to sudden events
Major news events can disrupt existing trend judgments, resulting in failure of reversal signals. It is necessary to pay attention to fundamentals and avoid trading blindly when news events occur.
Optimization Directions
The strategy can be further optimized in the following aspects:
- Add stop loss mechanisms
Reasonably set stop loss or time stop loss to control single loss.
- Combine with volume indicators
Add volume confirmation, such as issuing signals only when breaking through the average volume, to avoid ineffective breakthroughs due to insufficient momentum.
- Dynamic parameter optimization
Dynamically optimize parameters according to market conditions, relax parameters appropriately during obvious trends, and tighten parameters during consolidations.
- Use machine learning methods for dynamic optimization
Use machine learning methods like random forest to evaluate and select parameter combinations to achieve dynamic intelligent optimization.
Summary
This strategy combines the strengths of two indicators reasonably to catch the rebound trend at reversal points. Although problems like being trapped and parameter optimization remain, the overall idea is clear and logical. It is worth further testing and optimization to achieve stable profits.
Parameters
| Name | Default | What it controls |
|---|---|---|
| v_input_1 | 14 | Length |
| v_input_2 | true | KSmoothing |
| v_input_3 | 3 | DLength |
| v_input_4 | 50 | Level |
| v_input_5 | 14 | LengthDPO |
| v_input_6 | false | Trade reverse |
Source Pine Script
/*backtest
start: 2023-10-15 00:00:00
end: 2023-11-14 00:00:00
period: 1h
basePeriod: 15m
exchanges: [{"eid":"Futures_Binance","currency":"BTC_USDT"}]
*/

//@version=4
////////////////////////////////////////////////////////////
//  Copyright by HPotter v1.0 30/12/2019
// This is combo strategies for get a cumulative signal.
//
// First strategy
// This System was created from the Book "How I Tripled My Money In The
// Futures Market" by Ulf Jensen, Page 183. This is reverse type of strategies.
// The strategy buys at market, if close price is higher than the previous close
// during 2 days and the meaning of 9-days Stochastic Slow Oscillator is lower than 50.
// The strategy sells at market, if close price is lower than the previous close price
// during 2 days and the meaning of 9-days Stochastic Fast Oscillator is higher than 50.
//
// Second strategy
// The Detrend Price Osc indicator is similar to a moving average,
// in that it filters out trends in prices to more easily identify
// cycles. The indicator is an attempt to define cycles in a trend
// by drawing a moving average as a horizontal straight line and
// placing prices along the line according to their relation to a
// moving average. It provides a means of identifying underlying
// cycles not apparent when the moving average is viewed within a
// price chart. Cycles of a longer duration than the Length (number
// of bars used to calculate the Detrend Price Osc) are effectively
// filtered or removed by the oscillator.
//
// WARNING:
// - For purpose educate only
// - This script to change bars colors.
////////////////////////////////////////////////////////////
Reversal123(Length, KSmoothing, DLength, Level) =>
    vFast = sma(stoch(close, high, low, Length), KSmoothing)
    vSlow = sma(vFast, DLength)
    pos = 0.0
    pos := iff(close[2] < close[1] and close > close[1] and vFast < vSlow and vFast > Level, 1,
	         iff(close[2] > close[1] and close < close[1] and vFast > vSlow and vFast < Level, -1, nz(pos[1], 0)))
	pos

DPO(Length) =>
    pos = 0.0
    xPrice = close
    xsma = sma(xPrice, Length)
    nRes = xPrice - xsma
    pos := iff(nRes > 0, 1,
    	     iff(nRes < 0, -1, nz(pos[1], 0)))
    pos

strategy(title="Combo Backtest 123 Detrended Price Oscillator", shorttitle="Combo", overlay = true)
Length = input(14, minval=1)
KSmoothing = input(1, minval=1)
DLength = input(3, minval=1)
Level = input(50, minval=1)
//-------------------------
LengthDPO = input(14, minval=1)
reverse = input(false, title="Trade reverse")
posReversal123 = Reversal123(Length, KSmoothing, DLength, Level)
posDPO = DPO(LengthDPO)
pos = iff(posReversal123 == 1 and posDPO == 1 , 1,
	   iff(posReversal123 == -1 and posDPO == -1, -1, 0))
possig = iff(reverse and pos == 1, -1,
          iff(reverse and pos == -1 , 1, pos))
if (possig == 1)
    strategy.entry("Long", strategy.long)
if (possig == -1)
    strategy.entry("Short", strategy.short)
if (possig == 0)
    strategy.close_all()
barcolor(possig == -1 ? #b50404: possig == 1 ? #079605 : #0536b3 )Published by ChaoZhang on the FMZ strategy square · last modified 2023-11-15. Collected in the Quant Trading Vault. Unvalidated research: re-test with your own data and costs before trusting it.
Build this with AgenKit
A spec is not a trading system. Paste this into your coding agent and AgenKit runs a specialist team — architecture, test-first build, risk gates, review — with paper trading on by default.
/agenkit build a production-grade trading bot with a backtest engine, risk controls and paper trading by default from strategies/Cycle-Reversal-Trend-Following-Strategy-after-Pullback.md- npx agenkit install engineering-kit in your project
- Paste the command into your agent and approve each phase
- Get tests, backtest, risk controls and a paper-trading switch
Understand it first
Before you run this, read the lesson behind the idea and how to backtest it honestly. Specs like this one are the survivors of an unknown number of trials; deflate their results accordingly.
Related specs
- Adaptive Trading Strategy Combining Dynamic Trend Reversal and Stochastic IndicatorPine Script · Mean reversion · 1d
- Advanced 15 Minute Chart Trading Signal StrategyPine Script · Mean reversion · 3h
- Bollinger Bands Stochastic RSI Extreme Strategy BBSR Extreme StrategyPine Script · Mean reversion · 1h
- BuySell Strategy depends on AOStochRSIATRPine Script · Mean reversion · 30m
- Byron Serpent Cloud Quant StrategyPine Script · Mean reversion · 1h
- Dual Momentum Trend Reversal Strategy Based on RSI and Stochastic RSIPine Script · Mean reversion · 1h