Strategy vault / Trend following
DMI DPO Guard Strategy
This strategy combines two powerful built-in indicators in TradingView - the Directional Movement Index (DMI) and the Detrended Price Oscillator (DPO) to form a reliable basis for trading decisions. The core logic of…
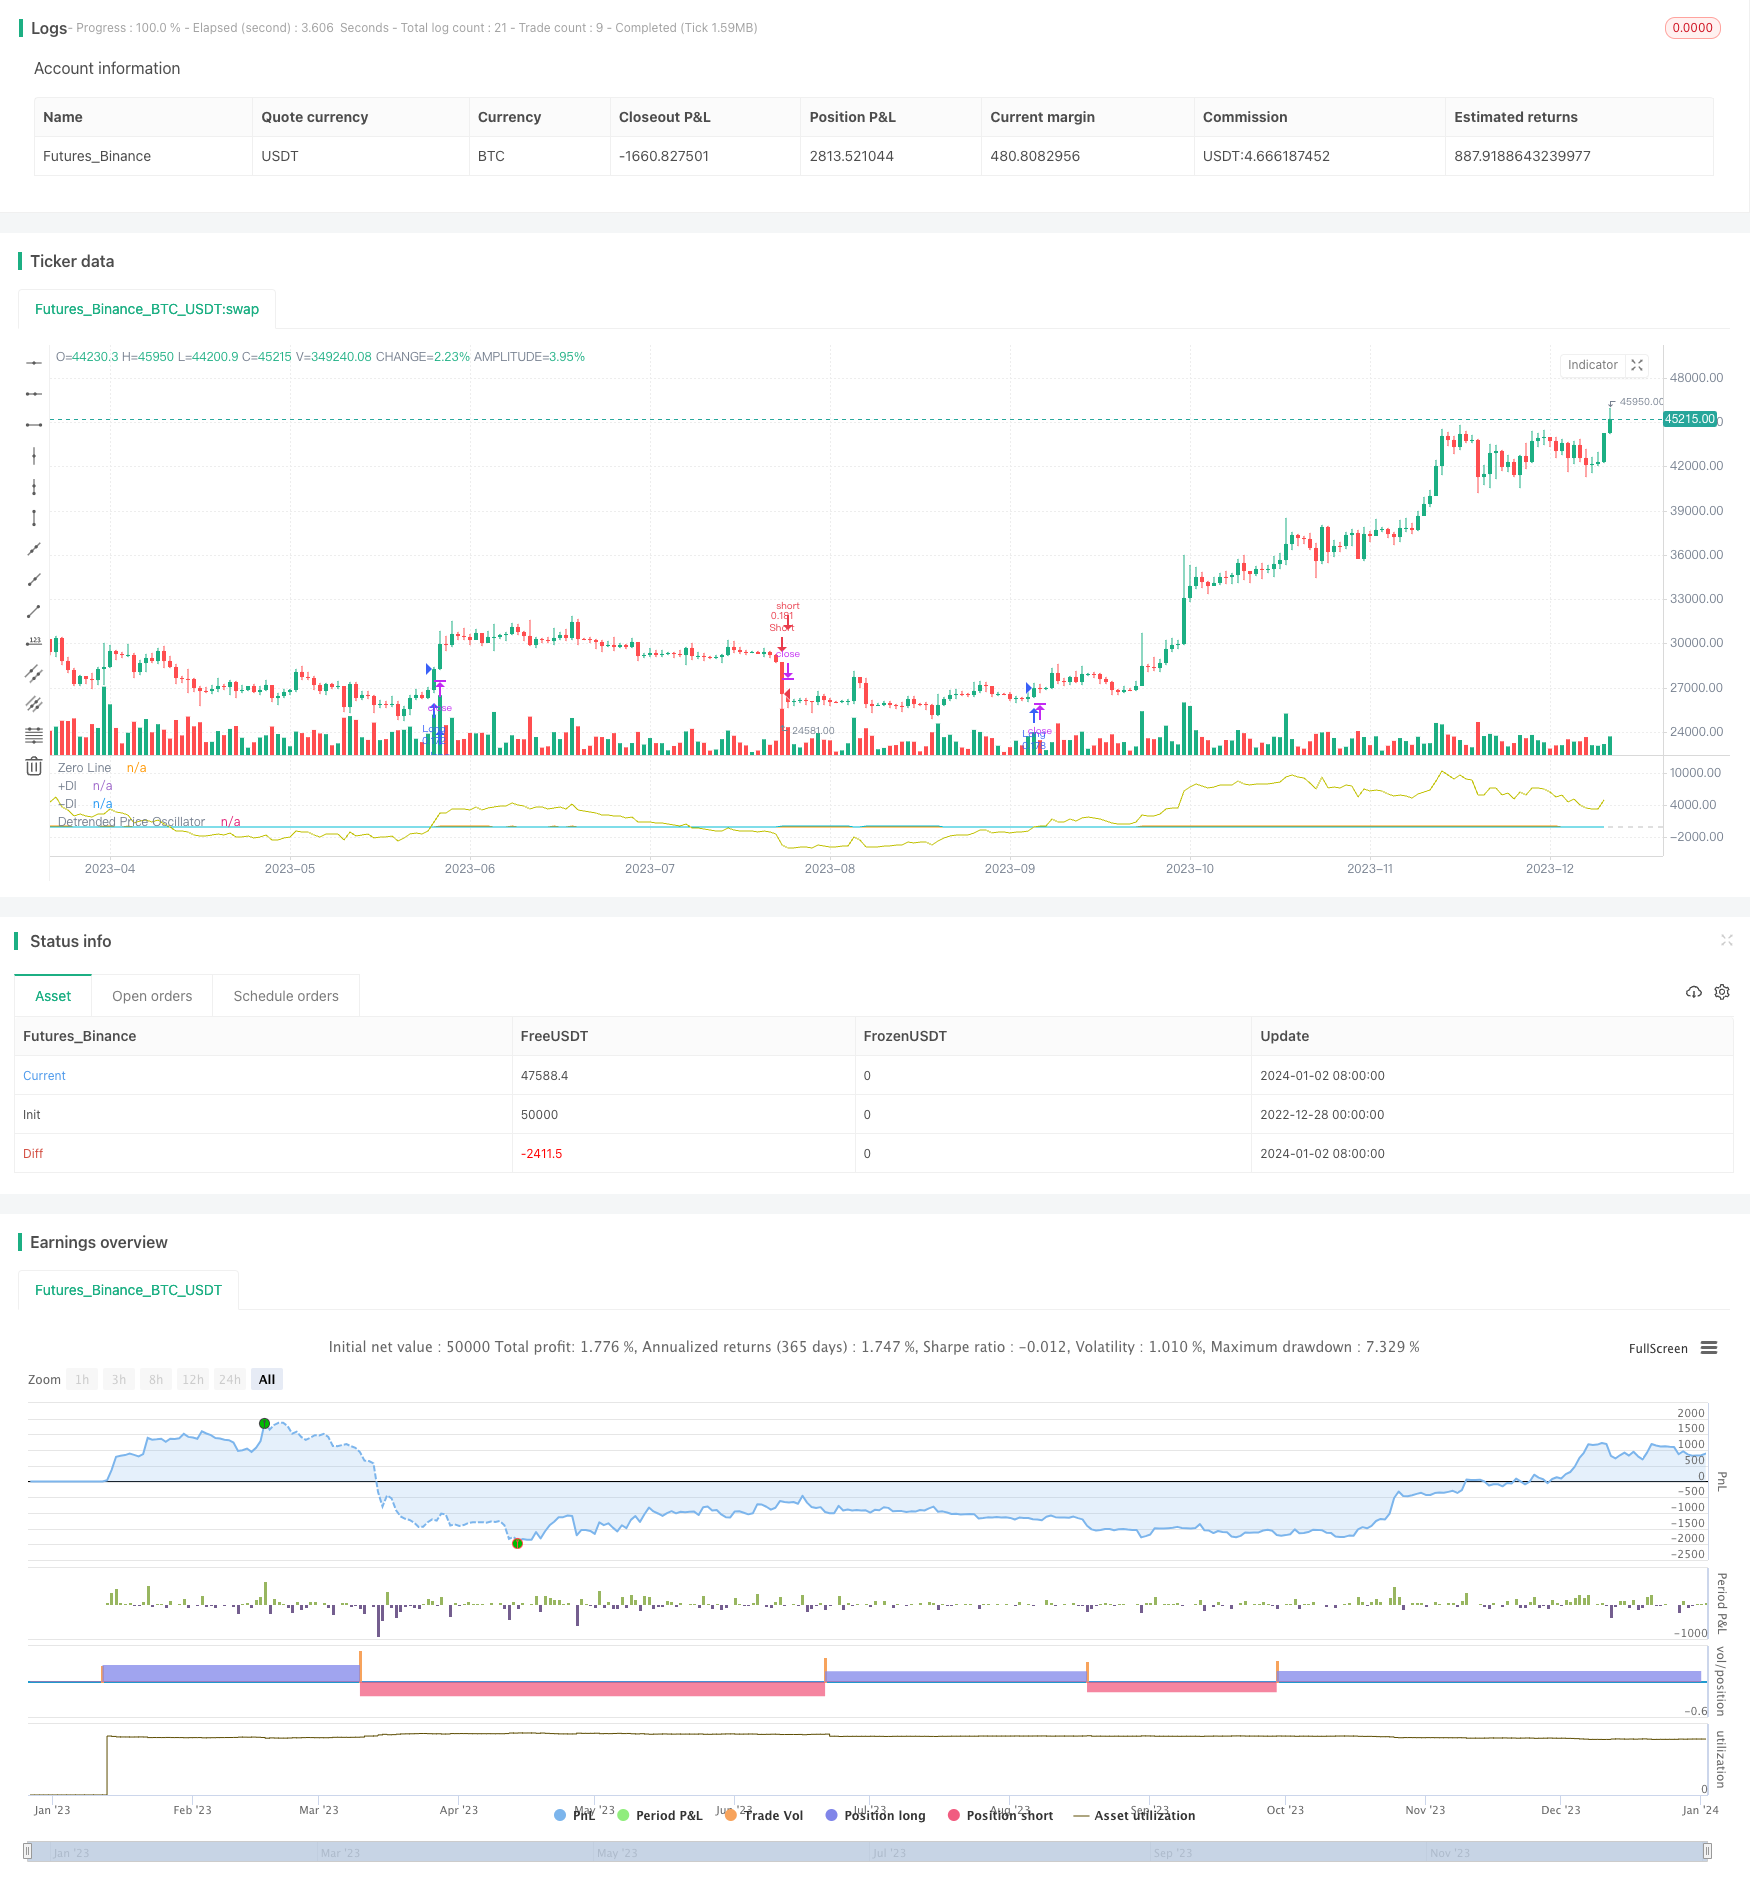
Overview
This strategy combines two powerful built-in indicators in TradingView - the Directional Movement Index (DMI) and the Detrended Price Oscillator (DPO) to form a reliable basis for trading decisions. The core logic of the strategy is to determine if the DPO value is greater than 0 when a DMI golden cross occurs, and generate a long signal if so; or to determine if the DPO value is less than 0 when a DMI dead cross occurs, and generate a short signal if so. This can effectively filter out a lot of false signals generated during range-bound oscillations in the market, thereby only generating trading signals when a trend is formed, avoiding repeated stop losses during oscillations.
Principle
This strategy mainly uses the DMI indicator to determine the trend direction and strength. The DMI indicator consists of three curves: +DI, -DI and ADX. +DI represents the strength of uptrend, -DI represents the strength of downtrend, and their crossover can determine the current trend direction; ADX represents the strength of the trend, the higher the value, the more obvious the trend. However, ADX is not good at identifying low volatility ranges, so this strategy removes the ADX determination and only uses the +DI and -DI crossovers to determine the trend direction.
In order to filter out the false signals generated in the range-bound oscillations, the DPO indicator is introduced for auxiliary judgment. The DPO indicator represents the degree of deviation of the price from its middle rail. When the price is above the middle rail, the DPO is positive, and when below, it is negative. This strategy uses the positivity and negativity of the DPO indicator to judge whether it is currently in a trend. If the DMI indicator crosses but the DPO indicator is close to the 0 level, it is determined to be an oscillation and no trading signal is generated.
Specifically, the judgment logic is:
When +DI crosses above -DI, it is a golden cross, indicating a bull market. At this time, if the DPO indicator is greater than 0, it confirms that it is currently in an upward trend, and a long signal is generated.
When -DI crosses below +DI, it is a dead cross, indicating a bear market. At this time, if the DPO indicator is less than 0, it confirms that it is currently in a downward trend, and a short signal is generated.
If +DI/-DI crosses but DPO indicator is close to 0, it is determined as oscillation and no signal is generated.
Advantage Analysis
The biggest advantage of this combined strategy is its high accuracy in identifying trends, generating trading signals only when real trend reversals occur, thus avoiding repeated losses in oscillating intervals. Its main advantages are:
Using the DMI indicator to determine the trend direction and strength, it is a mature and reliable technical indicator.
Filter out false signals in range-bound oscillations with the help of the DPO indicator, generate signals only when a trend is formed, avoiding losses.
Combining multiple indicators can serve as mutual verification and improve the reliability of signals.
The strategy logic is simple and easy to understand and implement, suitable for automated or manual trading.
Since it only trades in trends, it can obtain a relatively high risk reward ratio.
Risk Analysis
Although this is a highly reliable strategy, the following risks should be noted:
Sudden events may cause huge one-sided moves in the market, possibly missing such trend opportunities. This risk can be reduced by lowering the DPO parameters.
The DMI indicator itself may also generate wrong signals, and this risk cannot be completely avoided. Losses can be controlled by setting stops.
Improper parameter settings of the DPO indicator can also lead to misjudgments. The optimal parameters should be determined through repeated backtesting.
Trading costs will have a certain impact on profits, so the trading frequency should be controlled. Invalid trades can be reduced by optimizing parameters.
Optimization
There is still room for further optimization of this strategy:
Different parameter combinations can be tested to find the optimal parameters to reduce signal delay and increase profit rate.
Can be combined with other indicators such as KDJ, MACD, etc. for verification to improve signal accuracy.
Adaptive parameters can be set according to different varieties, cycles, etc. to make the strategy more adaptive.
Dynamic stops can be set to control single loss. Different stop loss amplitudes can also be set according to trend stages.
Machine learning methods can be used to optimize entry and exit timing for higher returns.
Summary
This strategy combines the advantages of the DMI and DPO indicators to have high accuracy in judging trend reversals, and can reliably identify the generation of trends. At the same time, the use of the DPO indicator effectively filters out the noise caused by range-bound oscillations, avoiding ineffective trades. This makes it an efficient strategy suitable for automated trading and manual adoption. Of course, there are still many details that can be further optimized for better strategy performance. But the idea of combining indicators has important reference significance for quantitative trading strategy design.
Parameters
| Name | Default | What it controls |
|---|---|---|
| v_input_1 | 34 | DI Lookback |
| v_input_2 | 34 | Length |
| v_input_3 | false | Centered |
Source Pine Script
/*backtest
start: 2022-12-28 00:00:00
end: 2024-01-03 00:00:00
period: 1d
basePeriod: 1h
exchanges: [{"eid":"Futures_Binance","currency":"BTC_USDT"}]
*/

//@version=4
strategy("DMI DPO Guard Strategy", calc_on_order_fills=true, initial_capital=100000, default_qty_type=strategy.percent_of_equity, default_qty_value=10, currency="USD", commission_type=strategy.commission.percent, commission_value=0.25)

///Tradingview's DMI indicator logic///
len = input(34, minval=1, title="DI Lookback")
up = change(high)
down = -change(low)
plusDM = na(up) ? na : (up > down and up > 0 ? up : 0)
minusDM = na(down) ? na : (down > up and down > 0 ? down : 0)
trur = rma(tr, len)
plus = fixnan(100 * rma(plusDM, len) / trur)
minus = fixnan(100 * rma(minusDM, len) / trur)

plot(plus, color=color.orange, title="+DI")
plot(minus, color=color.aqua, title="-DI")


period_ = input(34, title="Length", minval=1)
isCentered = input(false, title="Centered")
barsback = period_/2 + 1
ma = sma(close, period_)
dpo = isCentered ? close[barsback] - ma : close - ma[barsback]
plot(dpo, offset = isCentered ? -barsback : 0, title="Detrended Price Oscillator", color=#C0C000)
hline(0, title="Zero Line", color = #C0C0C0)

long = crossover(plus, minus) and (dpo > 0)
short = crossunder(plus, minus) and (dpo < 0)

strategy.entry("Long", strategy.long, when=long)
strategy.entry("Short", strategy.short, when=short)
Published by ChaoZhang on the FMZ strategy square · last modified 2024-01-04. Collected in the Quant Trading Vault. Unvalidated research: re-test with your own data and costs before trusting it.
Build this with AgenKit
A spec is not a trading system. Paste this into your coding agent and AgenKit runs a specialist team — architecture, test-first build, risk gates, review — with paper trading on by default.
/agenkit build a production-grade trading bot with a backtest engine, risk controls and paper trading by default from strategies/DMI-DPO-Guard-Strategy.md- npx agenkit install engineering-kit in your project
- Paste the command into your agent and approve each phase
- Get tests, backtest, risk controls and a paper-trading switch
Understand it first
Before you run this, read the lesson behind the idea and how to backtest it honestly. Specs like this one are the survivors of an unknown number of trials; deflate their results accordingly.
Related specs
- ADX MA and EMA Long Only Trend Tracking StrategyPine Script · Trend following · 1d
- Adaptive Risk Management Strategy Based on Dynamic ATR and Moving Average CrossoverPine Script · Trend following · 2h
- Bollinger Band Trend ChaserPine Script · Trend following · 1d
- Dynamic Re entry Buy only StrategyPine Script · Trend following · 1d
- EMA AROON ASHPine Script · Trend following · 3m
- EMA SMA Multi Indicator Comprehensive Trend Following StrategyPine Script · Trend following · 1h