Double Channel Breakthrough Turtle Strategy
The Double Channel Breakthrough Turtle Strategy is a breakout strategy that generates trading signals using the Donchian Channel indicator. The strategy establishes both fast and slow channels at the same time. The…
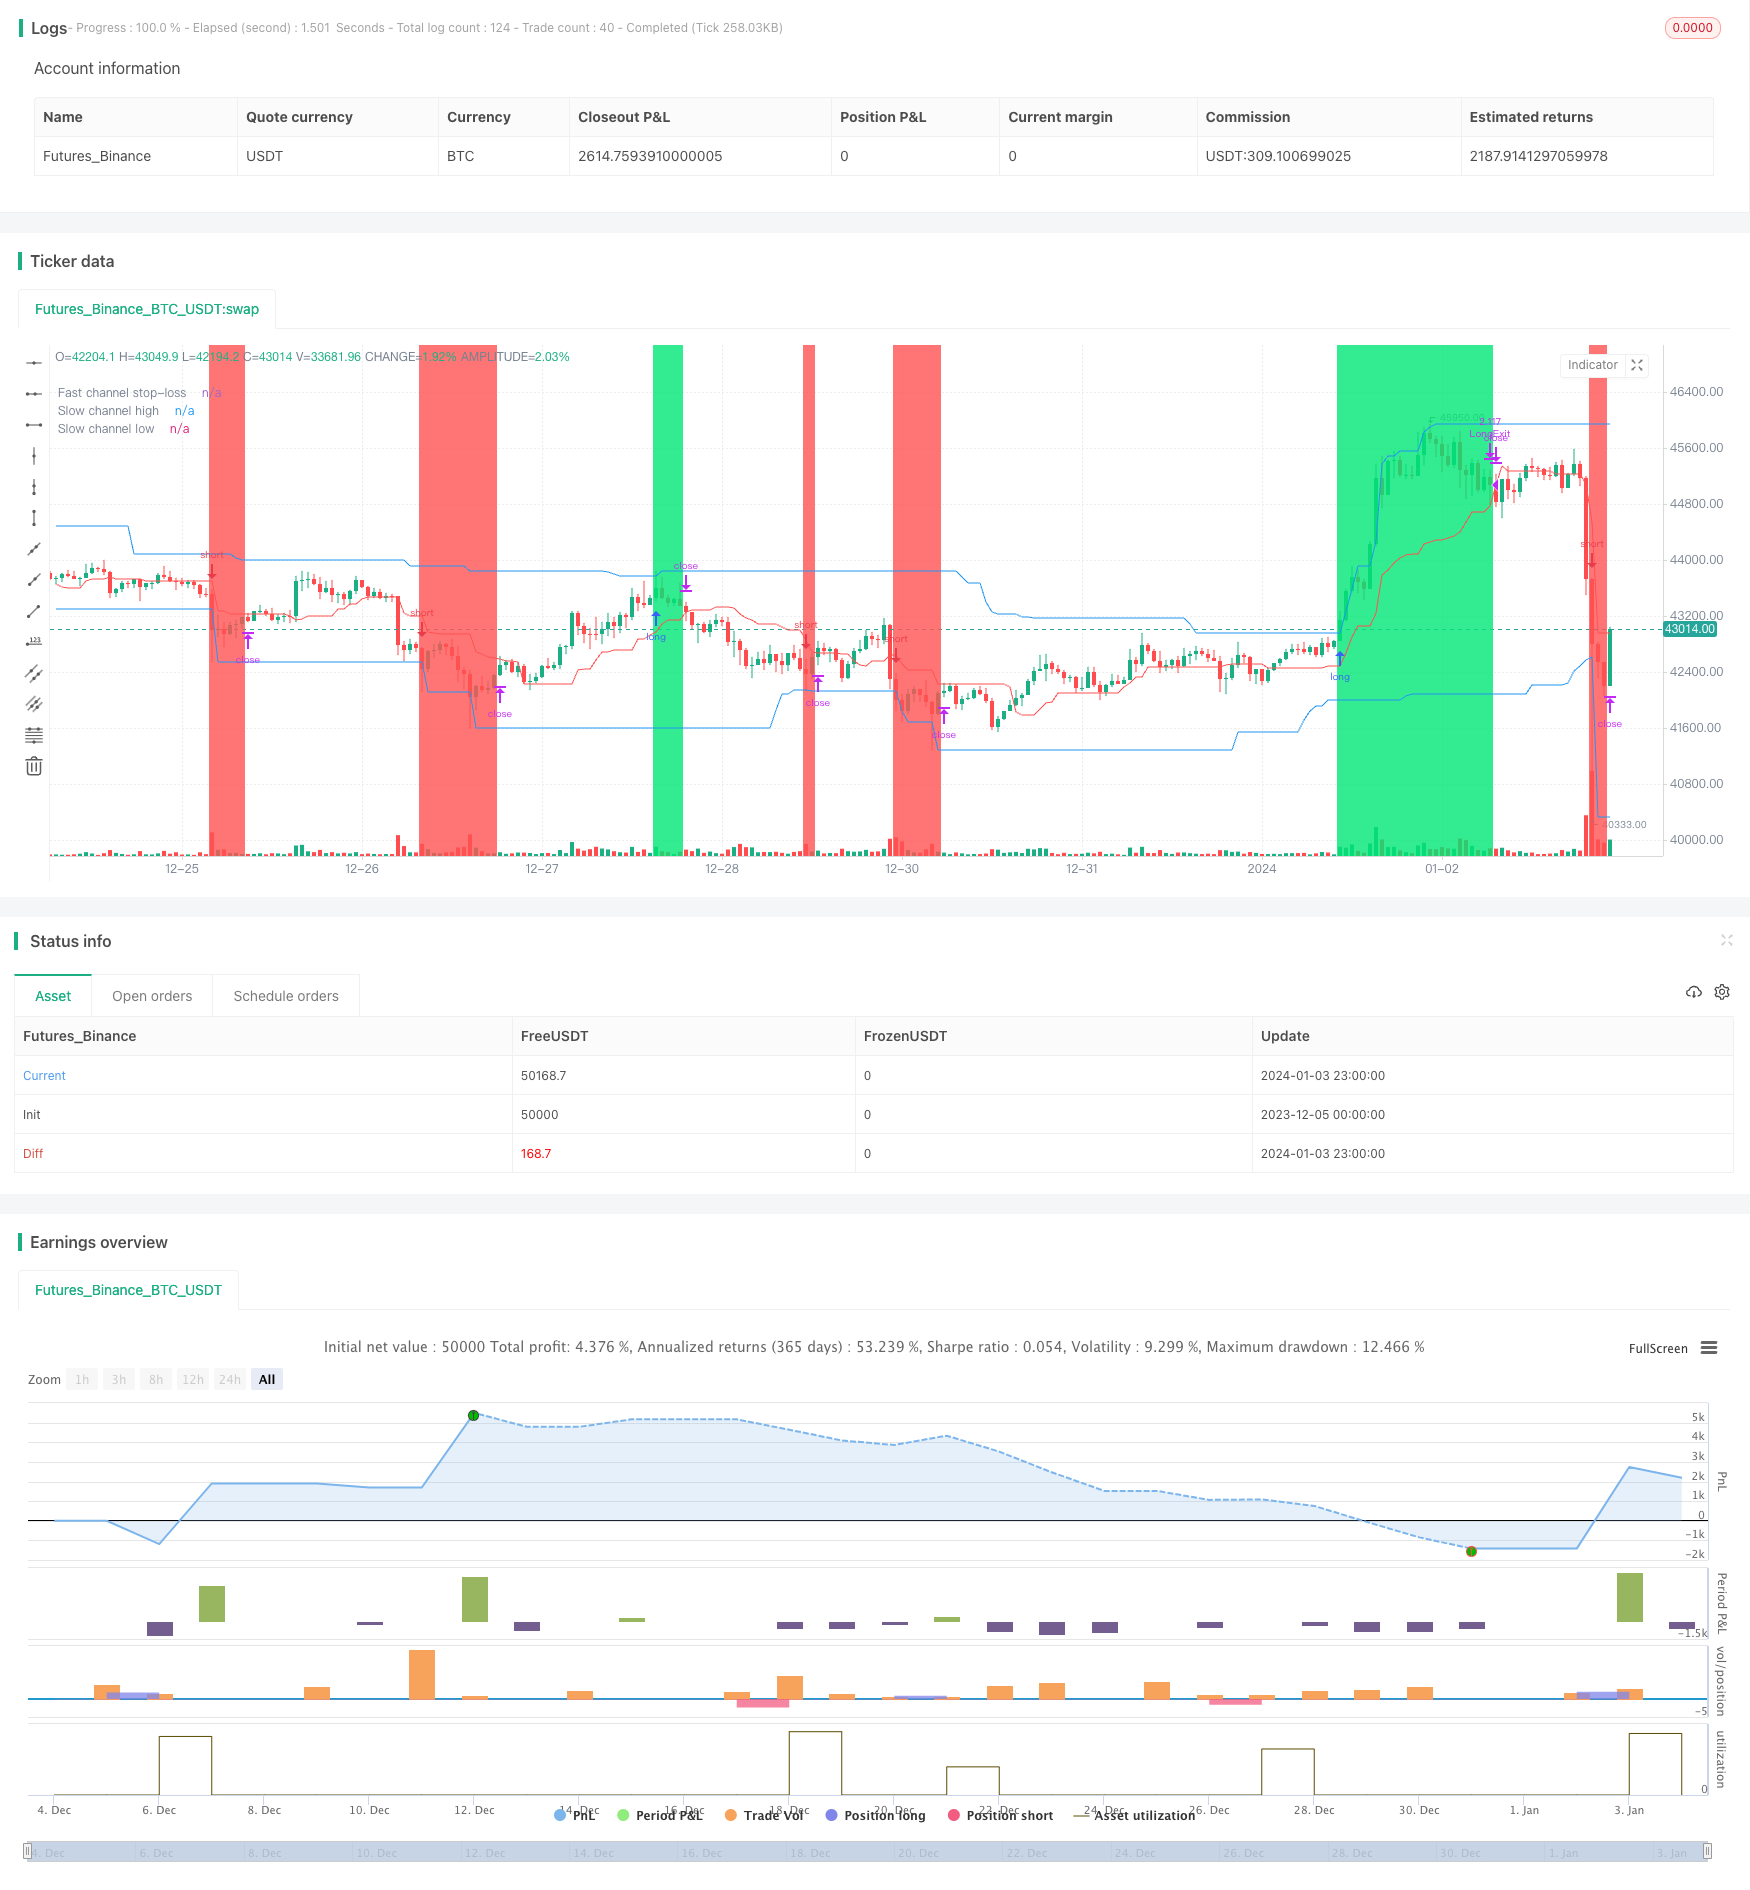
Overview
The Double Channel Breakthrough Turtle Strategy is a breakout strategy that generates trading signals using the Donchian Channel indicator. The strategy establishes both fast and slow channels at the same time. The fast channel is used to set stop loss prices, while the slow channel is used to generate opening and closing signals. When the price breaks through the upper rail of the slow channel, go long; when the price breaks through the lower rail, go short. This strategy has the characteristics of strong trend tracking and good drawdown control.
Principles
The core logic of the Double Channel Breakthrough Turtle Strategy is based on the Donchian Channel indicator. The Donchian Channel consists of upper rail, lower rail and middle rail calculated from highest high and lowest low prices. This strategy creates both fast and slow channels simultaneously, with parameters set by the user and default periods of 50 bars for the slow channel and 20 bars for the fast channel.
The upper and lower rails (blue lines) of the slow channel are used to generate trading signals. When the price breaks through the upper rail, go long; when the price breaks below the lower rail, go short. The middle rail (red line) of the fast channel is used for stop loss. The stop loss price for long positions is the middle rail of the fast channel; the stop loss price for short positions is also the middle rail of the fast channel.
Thus, the slow channel generates signals while the fast channel controls risks. Using double channels ensures both signal stability and risk control. Background colors indicate current position direction, with green for long and red for short.
In addition, the strategy also sets risk percentage and position sizing. Risk percentage defaults to 2%, and position sizes are calculated based on risk percentage and channel volatility. This effectively controls per trade risk and gradual position increase.
Advantages
The Double Channel Breakthrough Turtle Strategy has the following advantages:
Strong trend tracking ability. Using Donchian Channel to determine trends can effectively capture medium-to-long-term trends. The double channel design ensures that the strategy only tracks strong trending markets.
Good drawdown and risk control. The middle rail of the fast channel acts as a stop loss, so from upper to middle rail and lower to middle rail are risk zones. This ensures controllable loss per trade. The strategy also sets risk percentage to directly limit maximum account loss.
Stable trading signals. The large slow channel parameters require a relatively long time to form channels, avoiding excessive trading. While the fast channel stops loss and catches short-term corrections. The two complement each other to form stable trading signals.
Excellent position and risk management. The strategy uses Donchian channel volatility to calculate position sizing for risk exposure control. Gradual position increase also balances long and short positions.
Intuitive visualization. Double channels, stop loss lines, position background are all clearly plotted for easy strategy logic comprehension. Meanwhile maximum drawdown, maximum loss and other key metrics are also displayed.
Risks
The Double Channel Breakthrough Turtle Strategy also has some risks:
Unable to effectively utilize intraday prices. Turtle only opens positions on channel breakouts, unable to use more precise situation to increase positions. This can be improved through optimization.
Stop loss points are prone to hunting. Turtle's fixed middle rail stop loss can be easily hit in active markets. This requires dynamic adjustment of middle rail parameters.
Double channel parameters need fine tuning. Proper parameter settings are crucial for reasonable steady signals. Current fixed parameters cannot adapt to market changes, adaptive features need to be introduced.
Unable to utilize overnight and pre-market information. Currently the strategy only judges trends based on live market data, unable to inform trading decisions with overnight and pre-market price actions. This can be addressed by data adjustment.
Optimization Directions
The main optimization directions for the Double Channel Breakthrough Turtle Strategy are:
Use intraday prices to adjust positions. Positions can be adjusted based on price's distance from channel instead of just simple long/short.
Intelligent stop loss strategies. Change fixed middle rail stops to dynamic calculations to avoid fixed stop loss hunting.
Adaptive channel parameter optimization. Allow channel parameters to automatically adjust based on market conditions instead of manual fixed values.
Incorporate overnight and pre-market information. Consider not just live prices, but also overnight and pre-market prices when judging trends to obtain more complete market conditions.
Combine multiple stocks and indexes. Apply the strategy to multiple stocks, with inter-stock and index arbitrage opportunities for enhanced alpha.
Conclusion
In conclusion, the Double Channel Breakthrough Turtle Strategy is an overall stable, efficient trend following strategy with embedded risk control. The dual usage of fast and slow channels ensures both signal stability and risk management. In addition, the position background, maximum drawdown and position sizing also make this strategy easily manageable and optimizable. In general, this is a high quality quantitative strategy worth thorough research and application.
Parameters
| Name | Default | What it controls |
|---|---|---|
| v_input_1 | true | Long |
| v_input_2 | true | Short |
| v_input_3 | 2 | Risk size, % |
| v_input_4 | 20 | Fast channel (for stop-loss) |
| v_input_5 | 50 | Slow channel (for entries) |
| v_input_6 | true | Show offset |
| v_input_7 | true | Show lines |
| v_input_8 | true | Show label (drawdown) |
| v_input_9 | true | Show background |
| v_input_10 | 1900 | From Year |
| v_input_11 | 2100 | To Year |
| v_input_12 | true | From Month |
| v_input_13 | 12 | To Month |
| v_input_14 | true | From day |
| v_input_15 | 31 | To day |
Source Pine Script
/*backtest
start: 2023-12-05 00:00:00
end: 2024-01-04 00:00:00
period: 1h
basePeriod: 15m
exchanges: [{"eid":"Futures_Binance","currency":"BTC_USDT"}]
*/

//Noro
//2020

//@version=4
strategy("Noro's RiskTurtle Strategy", shorttitle = "RiskTurtle str", overlay = true, default_qty_type = strategy.percent_of_equity, initial_capital = 100, default_qty_value = 100, commission_value = 0.1)

//Settings
needlong  = input(true, defval = true, title = "Long")
needshort = input(true, defval = true, title = "Short")
risk      = input(2, minval = 0.1, maxval = 99, title = "Risk size, %")
fast      = input(20, minval = 1, title = "Fast channel (for stop-loss)")
slow      = input(50, minval = 1, title = "Slow channel (for entries)")
showof    = input(true, defval = true, title = "Show offset")
showll    = input(true, defval = true, title = "Show lines")
showdd    = input(true, defval = true, title = "Show label (drawdown)")
showbg    = input(true, defval = true, title = "Show background")
fromyear  = input(1900, defval = 1900, minval = 1900, maxval = 2100, title = "From Year")
toyear    = input(2100, defval = 2100, minval = 1900, maxval = 2100, title = "To Year")
frommonth = input(01, defval = 01, minval = 01, maxval = 12, title = "From Month")
tomonth   = input(12, defval = 12, minval = 01, maxval = 12, title = "To Month")
fromday   = input(01, defval = 01, minval = 01, maxval = 31, title = "From day")
today     = input(31, defval = 31, minval = 01, maxval = 31, title = "To day")

//Donchian price channel fast
hf = highest(high, fast)
lf = lowest(low, fast)
center = (hf + lf) / 2

//Donchian price chennal slow
hs = highest(high, slow)
ls = lowest(low, slow)

//Lines
colorpc = showll ? color.blue : na
colorsl = showll ? color.red : na
offset = showof ? 1 : 0
plot(hs, offset = offset, color = colorpc, title = "Slow channel high")
plot(ls, offset = offset, color = colorpc, title = "Slow channel low")
plot(center, offset = offset, color = colorsl, title = "Fast channel stop-loss")

//Background
size = strategy.position_size
colorbg = showbg == false ? na : size > 0 ? color.lime : size < 0 ? color.red : na
bgcolor(colorbg, transp = 70)

//Var
loss = 0.0
maxloss = 0.0
equity = 0.0
truetime = true

//Lot size
risksize = -1 * risk
risklong = ((center / hs) - 1) * 100
coeflong = abs(risksize / risklong)
lotlong = (strategy.equity / close) * coeflong
riskshort = ((center / ls) - 1) * 100
coefshort = abs(risksize / riskshort)
lotshort = (strategy.equity / close) * coefshort

//Orders
strategy.entry("Long", strategy.long, lotlong, stop = hs, when = needlong and strategy.position_size == 0 and hs > 0 and truetime)
strategy.entry("Short", strategy.short, lotshort, stop = ls, when = needshort and strategy.position_size == 0 and ls > 0 and truetime)
strategy.exit("LongExit", "Long", stop = center, when = needlong and strategy.position_size > 0)
strategy.exit("Short", stop = center, when = needshort and strategy.position_size < 0)
if time > timestamp(toyear, tomonth, today, 23, 59)
    strategy.close_all()
    strategy.cancel("Long")
    strategy.cancel("Short")

if showdd

    //Drawdown
    max = 0.0
    max := max(strategy.equity, nz(max[1]))
    dd = (strategy.equity / max - 1) * 100
    min = 100.0
    min := min(dd, nz(min[1]))

    //Max loss size
    equity := strategy.position_size == 0 ? strategy.equity : equity[1]
    loss := equity < equity[1] ? ((equity / equity[1]) - 1) * 100 : 0
    maxloss := min(nz(maxloss[1]), loss)

    //Label
    min := round(min * 100) / 100
    maxloss := round(maxloss * 100) / 100
    labeltext = "Drawdown: " + tostring(min) + "%" + "\nMax.loss " + tostring(maxloss) + "%"
    var label la = na
    label.delete(la)
    tc = min > -100 ? color.white : color.red
    osx = timenow + round(change(time)*10)
    osy = highest(100)
// la := label.new(x = osx, y = osy, text = labeltext, xloc = xloc.bar_time, yloc = yloc.price, color = color.black, style = label.style_labelup, textcolor = tc)Published by ChaoZhang on the FMZ strategy square · last modified 2024-01-05. Collected in the Quant Trading Vault. Unvalidated research: re-test with your own data and costs before trusting it.
Build this with AgenKit
A spec is not a trading system. Paste this into your coding agent and AgenKit runs a specialist team — architecture, test-first build, risk gates, review — with paper trading on by default.
/agenkit build a production-grade trading bot with a backtest engine, risk controls and paper trading by default from strategies/Double-Channel-Breakthrough-Turtle-Strategy.md- npx agenkit install engineering-kit in your project
- Paste the command into your agent and approve each phase
- Get tests, backtest, risk controls and a paper-trading switch
Understand it first
Before you run this, read the lesson behind the idea and how to backtest it honestly. Specs like this one are the survivors of an unknown number of trials; deflate their results accordingly.
Related specs
- Breakout Strategy Based on Turtle TradingPine Script · Breakout · 1d
- Contrarian Donchian Channel Touch Entry Strategy with Post Stop Loss Pause and Trailing Stop LossPine Script · Breakout · 1d
- Donchian Breakout Trading StrategyPine Script · Breakout · 1d
- Donchian Channel Breakout Strategy 426772Pine Script · Breakout · 2h
- Donchian Channel Breakout Strategy 427308Pine Script · Breakout · 3m
- Donchian Channel Breakout Strategy 440321Pine Script · Breakout · 4h