Dual Momentum Breakthrough Confirmation Quantitative Trading Strategy
This is a quantitative trading strategy based on dual momentum breakthrough confirmation using Williams %R and Relative Strength Index (RSI). The strategy identifies trading signals through the cross-breakthrough of…
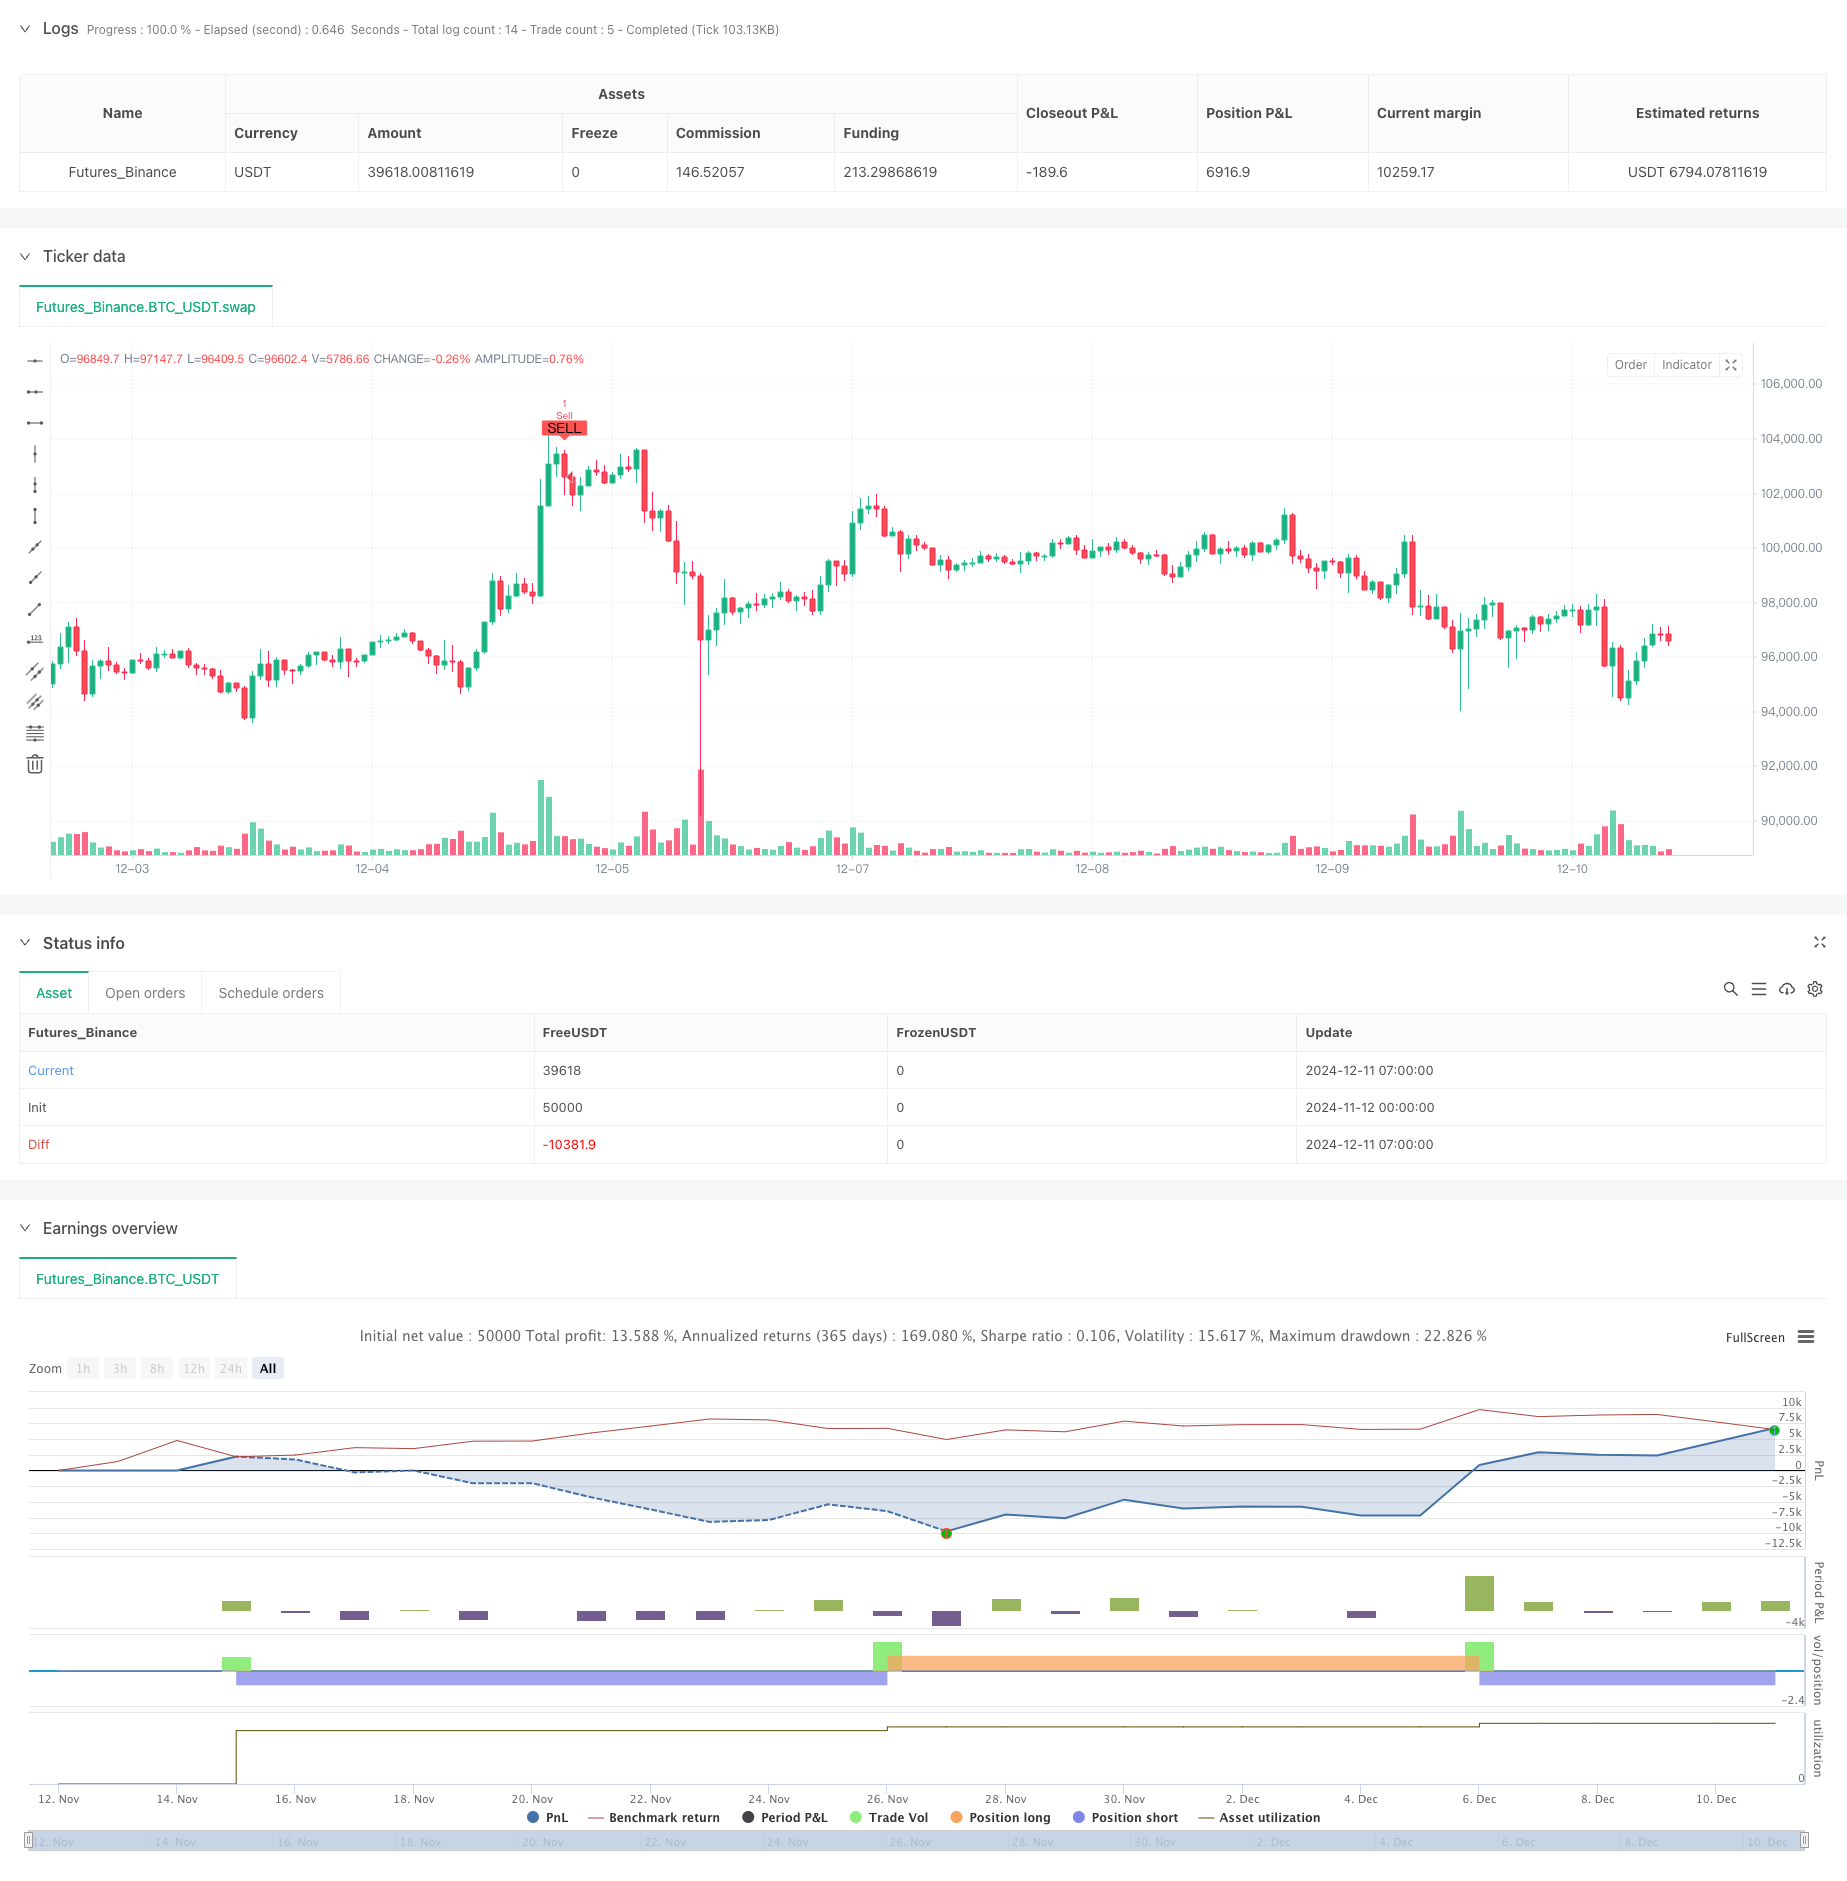
Overview
This is a quantitative trading strategy based on dual momentum breakthrough confirmation using Williams %R and Relative Strength Index (RSI). The strategy identifies trading signals through the cross-breakthrough of two momentum indicators, effectively reducing the risk of false breakouts. It seeks trading opportunities in overbought and oversold areas, improving trading accuracy through mutual confirmation of both indicators.
Strategy Principle
The strategy employs a 30-period Williams %R and 7-period RSI as primary indicators. A buy signal is triggered when Williams %R crosses above -80 and RSI simultaneously crosses above 20; a sell signal is generated when Williams %R crosses below -20 and RSI simultaneously crosses below 80. This dual confirmation mechanism effectively filters out potential false signals from single indicators. The strategy implements manual calculation of Williams %R by computing the highest and lowest prices within the period for more precise indicator values.
Strategy Advantages
- Dual confirmation mechanism significantly improves trading signal reliability
- Trading in overbought and oversold zones offers higher win rates and profit potential
- Indicator parameters can be flexibly adjusted for different market conditions
- Strategy logic is simple and clear, easy to understand and maintain
- Manual calculation of indicator values provides greater optimization potential
Strategy Risks
- May generate excessive trading signals in ranging markets
- Dual confirmation mechanism might lead to slightly delayed entry points
- Fixed overbought and oversold thresholds may need adjustment in different market environments
- Short-period RSI might be sensitive to price fluctuations
- Trading costs need to be considered for strategy profitability
Strategy Optimization Directions
- Introduce trend filters to avoid counter-trend trading in strong trend markets
- Add trailing stop-loss mechanisms to protect existing profits
- Develop adaptive overbought and oversold threshold calculation methods
- Optimize period parameter combinations for Williams %R and RSI
- Consider adding volume indicators as auxiliary confirmation signals
Summary
The strategy constructs a robust trading system through the synergy of Williams %R and RSI. The dual momentum confirmation mechanism effectively reduces false signal risks, while trading in overbought and oversold zones offers good profit potential. Through proper risk control and continuous optimization, the strategy can maintain stable performance across different market environments.
Source Pine Script
/*backtest
start: 2024-11-12 00:00:00
end: 2024-12-11 08:00:00
period: 1h
basePeriod: 1h
exchanges: [{"eid":"Futures_Binance","currency":"BTC_USDT"}]
*/

//@version=5
strategy("Williams %R + RSI Strategy", overlay=true)

// Inputs for Williams %R
wpr_length = input.int(30, title="Williams %R Length", minval=1)
wpr_upper = input.int(-20, title="Williams %R Upper Band", minval=-100, maxval=0)
wpr_lower = input.int(-80, title="Williams %R Lower Band", minval=-100, maxval=0)

// Inputs for RSI
rsi_length = input.int(7, title="RSI Length", minval=1)
rsi_upper = input.int(80, title="RSI Upper Band", minval=0, maxval=100)
rsi_lower = input.int(20, title="RSI Lower Band", minval=0, maxval=100)

// Calculate Williams %R Manually
highest_high = ta.highest(high, wpr_length)
lowest_low = ta.lowest(low, wpr_length)
wpr = ((highest_high - close) / (highest_high - lowest_low)) * -100

// Calculate RSI
rsi = ta.rsi(close, rsi_length)

// Entry and Exit Conditions
longCondition = ta.crossover(wpr, wpr_lower) and ta.crossover(rsi, rsi_lower)
shortCondition = ta.crossunder(wpr, wpr_upper) and ta.crossunder(rsi, rsi_upper)

// Plot Buy/Sell Signals
plotshape(series=longCondition, title="Buy Signal", location=location.belowbar, color=color.green, style=shape.labelup, text="BUY")
plotshape(series=shortCondition, title="Sell Signal", location=location.abovebar, color=color.red, style=shape.labeldown, text="SELL")

// Strategy Entry and Exit
if (longCondition)
    strategy.entry("Buy", strategy.long)

if (shortCondition)
    strategy.entry("Sell", strategy.short)
Published by ChaoZhang on the FMZ strategy square · last modified 2024-12-13. Collected in the Quant Trading Vault. Unvalidated research: re-test with your own data and costs before trusting it.
Build this with AgenKit
A spec is not a trading system. Paste this into your coding agent and AgenKit runs a specialist team — architecture, test-first build, risk gates, review — with paper trading on by default.
/agenkit build a production-grade trading bot with a backtest engine, risk controls and paper trading by default from strategies/Dual-Momentum-Breakthrough-Confirmation-Quantitative-Trading-Strategy.md- npx agenkit install engineering-kit in your project
- Paste the command into your agent and approve each phase
- Get tests, backtest, risk controls and a paper-trading switch
Understand it first
Before you run this, read the lesson behind the idea and how to backtest it honestly. Specs like this one are the survivors of an unknown number of trials; deflate their results accordingly.
Related specs
- Bollinger Band Channel Breakout Trading StrategyPine Script · Breakout · 1d
- Bollinger Bands Dynamic Breakout StrategyPine Script · Breakout · 1h
- Bull Market Tracking SystemPine Script · Breakout · 1h
- Cross boundary Dynamic Range Quantitative Trading Strategy Based on Bollinger BandsPine Script · Breakout · 3h
- Cross period Value Area Breakout StrategyPine Script · Breakout · 1d
- Darvas Box Breakout and Risk Management Strategy DarvasPine Script · Breakout · 1d