Strategy vault / Trend following
Dual Moving Average Cross Market Trading Strategy
This strategy combines the advantages of Hull moving average and T3 moving average to design a cross-market trading strategy. It can be used for both short-term trading and long-term trend tracking. By calculating…
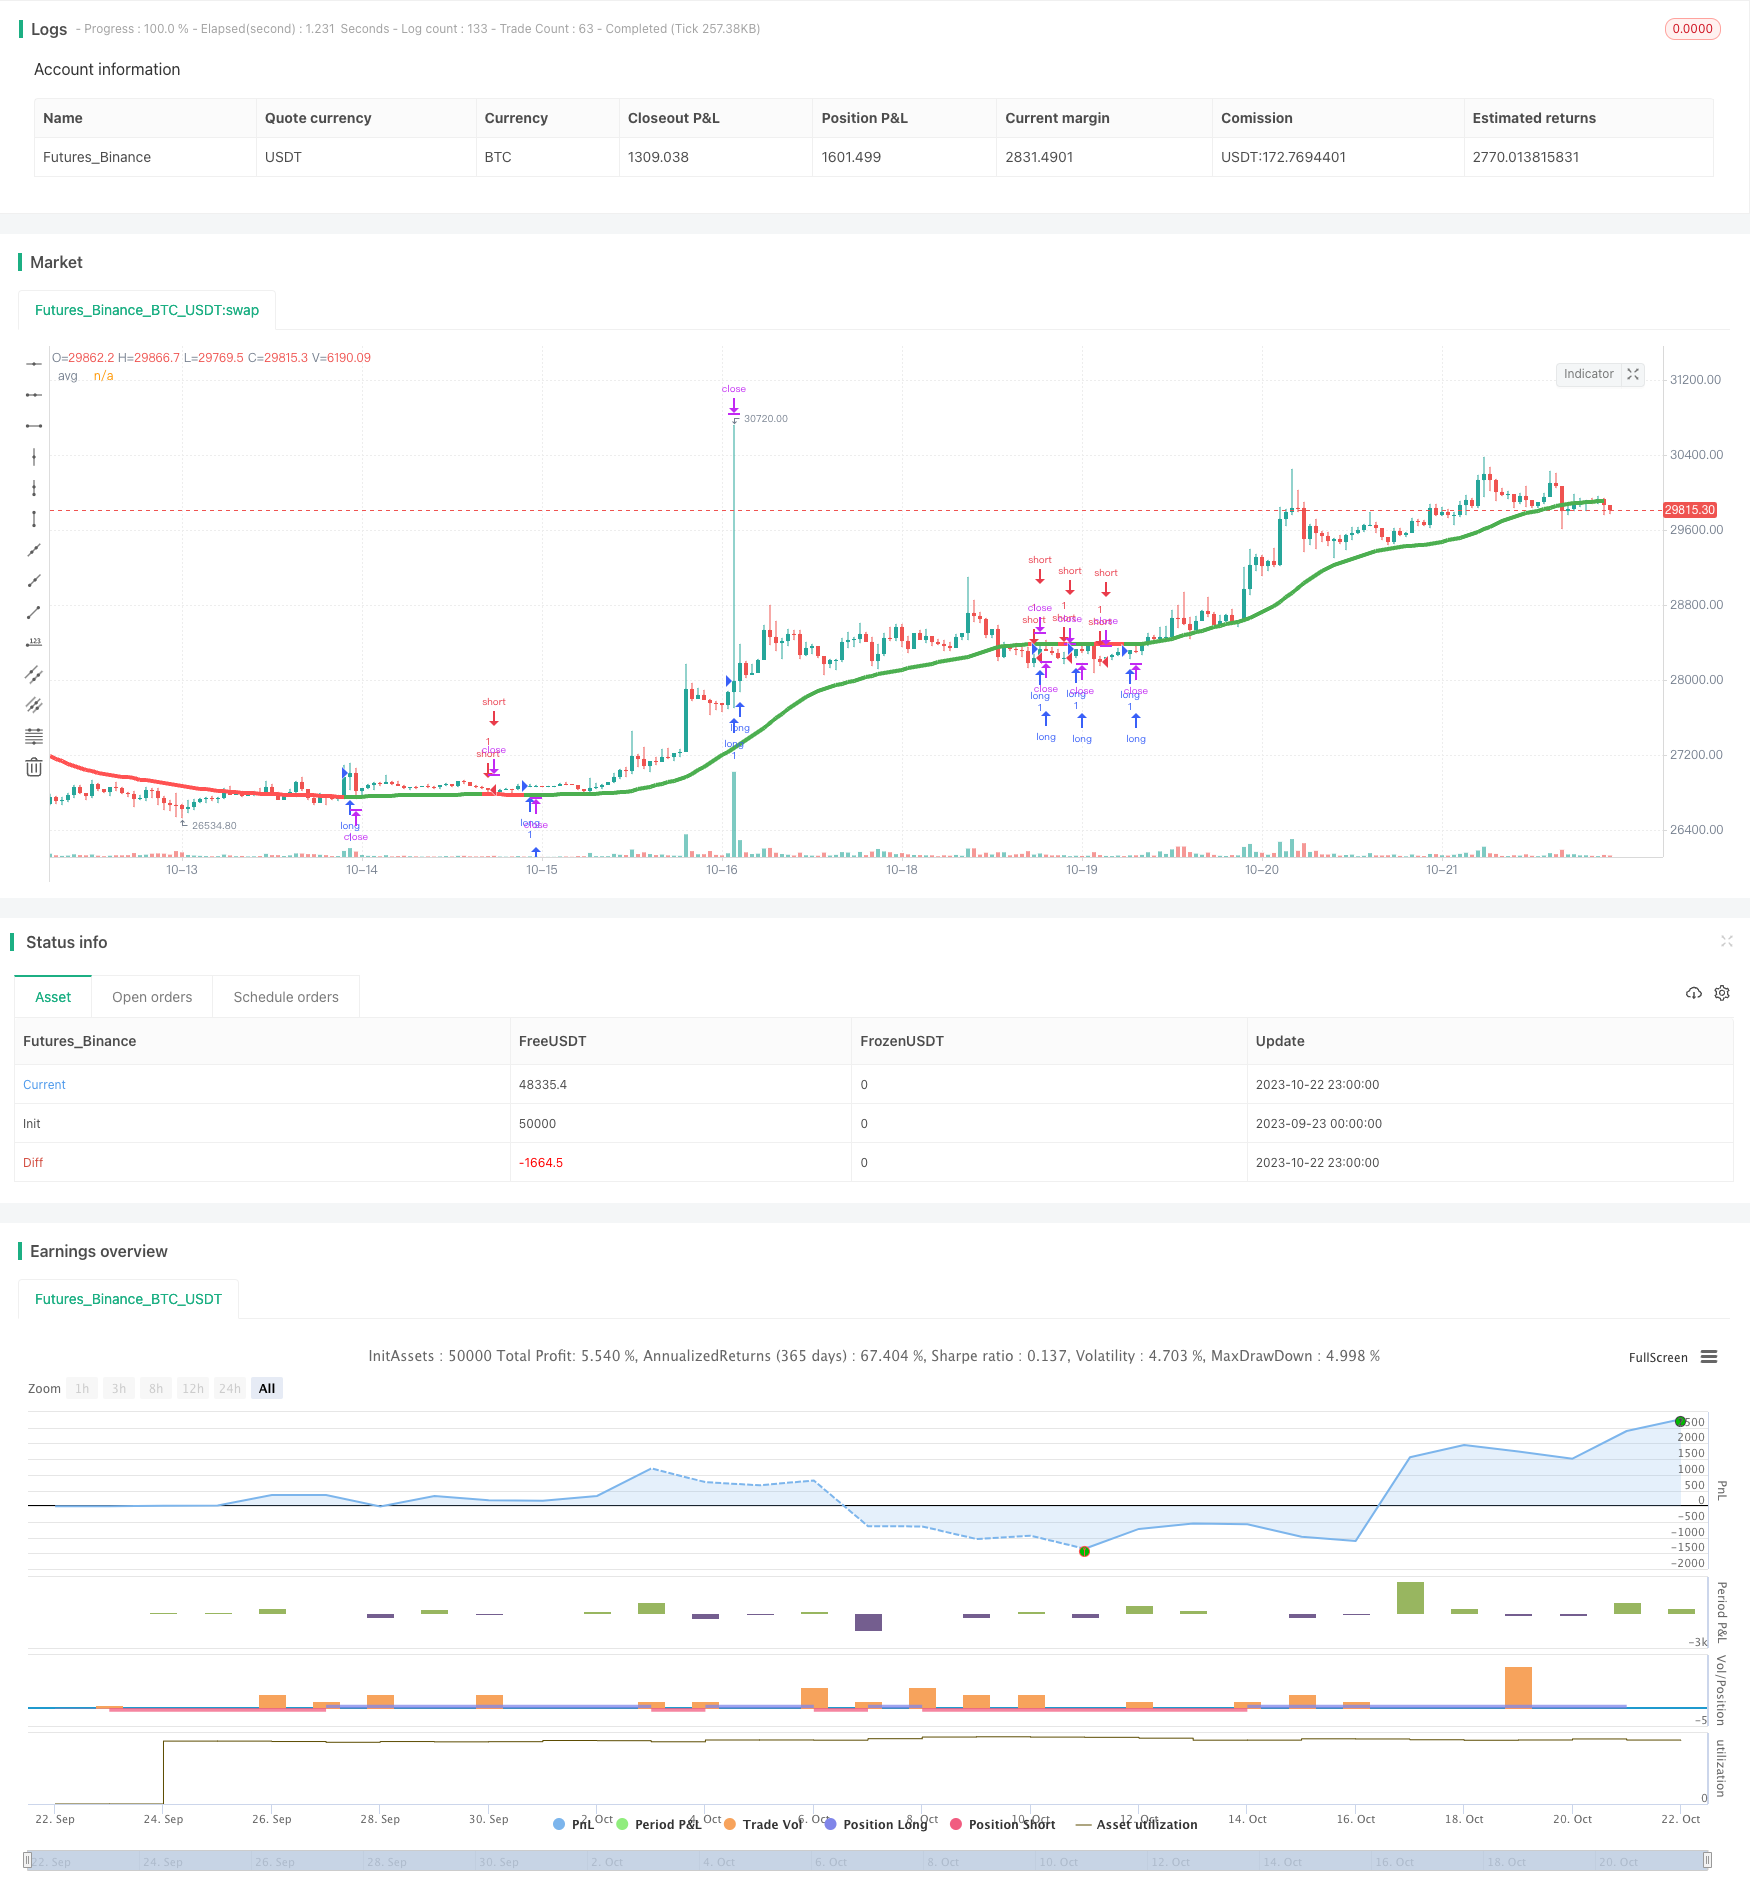
Overview
This strategy combines the advantages of Hull moving average and T3 moving average to design a cross-market trading strategy. It can be used for both short-term trading and long-term trend tracking. By calculating the mean value of Hull moving average and T3 moving average as the main trading signal line, it determines entry and exit points based on the directional changes.
Strategy Logic
The strategy is mainly based on the calculation of Hull moving average and T3 moving average.
The Hull Moving Average (HMA) uses a weighted moving average iterative calculation method to effectively filter out market noise and display a smooth price trend curve. It is more sensitive to price changes than simple moving averages and exponential moving averages, while also effectively suppressing false breakouts.
The T3 moving average responds faster to price changes while reducing lag by adjusting parameters. Through multiple exponential smoothing calculations, it can quickly respond to price changes.
This strategy takes the average of the two as the main trading indicator. It judges entry timing according to the direction of this average line: if the current period's average is higher than the previous period, it is a long entry signal; if lower, it is a short entry signal.
For exit rules, if the price breaks through the stop loss or take profit point, exit; also exit when the moving average direction changes.
Advantage Analysis
This strategy combines the advantages of Hull moving average and T3 moving average to generate a comprehensive indicator. Next, this strategy is suitable for both short-term and long-term trading by adjusting the cycle parameter. Also, it adopts dynamic stop loss and take profit to lock in profits and control risks.
Risk Analysis
The strategy relies mainly on the moving average indicator, which may generate multiple false signals in ranging trends. In addition, the lagging of moving averages may miss the best entry timing. The stop loss and take profit points need careful setting to avoid being too loose or too tight. Finally, parameters need optimization for different currencies and timeframes.
Optimization
Consider adding other indicators to verify the MA signal and filter out false signals. Test different MA combinations and weighting algorithms to optimize the MA signal. Add adaptive stop loss and trailing take profit to dynamically manage risks. Conduct backtesting optimization on different currencies and timeframes to find the optimal parameter sets.
Summary
This strategy integrates the strengths of Hull moving average and T3 moving average to form a comprehensive indicator for judging trend direction. Through parameter optimization, the strategy can be flexibly applied to different trading cycles. The strategy has certain advantages but also problems like lagging and false signals. By adding other indicators, optimizing parameters and dynamic stops, it can be continuously improved for better results.
Parameters
| Name | Default | What it controls |
|---|---|---|
| v_input_1 | true | From Day |
| v_input_2 | true | From Month |
| v_input_3 | 2000 | From Year |
| v_input_4 | 31 | To Day |
| v_input_5 | 12 | To Month |
| v_input_6 | 2021 | To Year |
| v_input_7 | 50 | Length MAs |
| v_input_8 | 0.08 | TP Long |
| v_input_9 | true | SL Long |
| v_input_10 | 0.03 | TP Short |
| v_input_11 | 0.06 | SL Short |
Source Pine Script
/*backtest
start: 2023-09-23 00:00:00
end: 2023-10-23 00:00:00
period: 1h
basePeriod: 15m
exchanges: [{"eid":"Futures_Binance","currency":"BTC_USDT"}]
*/

// This source code is subject to the terms of the Mozilla Public License 2.0 at https://mozilla.org/MPL/2.0/
// © exlux99

//@version=4


strategy(title="Swing HULL + T3 avg", shorttitle="Swing HULL T3 AVG", overlay=true)

fromDay = input(defval = 1, title = "From Day", minval = 1, maxval = 31)
fromMonth = input(defval = 1, title = "From Month", minval = 1, maxval = 12)
fromYear = input(defval = 2000, title = "From Year", minval = 1970)
 //monday and session
// To Date Inputs
toDay = input(defval = 31, title = "To Day", minval = 1, maxval = 31)
toMonth = input(defval = 12, title = "To Month", minval = 1, maxval = 12)
toYear = input(defval = 2021, title = "To Year", minval = 1970)

startDate = timestamp(fromYear, fromMonth, fromDay, 00, 00)
finishDate = timestamp(toYear, toMonth, toDay, 00, 00)
time_cond = true


////////////////////////////GENERAL INPUTS//////////////////////////////////////

length_Ma= input(defval=50, title="Length MAs", minval=1)

//==========HMA
getHULLMA(src, len) =>
    hullma = wma(2*wma(src, len/2)-wma(src, len), round(sqrt(len)))
    hullma

//==========T3
getT3(src, len, vFactor) =>
    ema1 = ema(src, len)
    ema2 = ema(ema1,len)
    ema3 = ema(ema2,len)
    ema4 = ema(ema3,len)
    ema5 = ema(ema4,len)
    ema6 = ema(ema5,len)
    c1 = -1 * pow(vFactor,3)
    c2 = 3*pow(vFactor,2) + 3*pow(vFactor,3)
    c3 = -6*pow(vFactor,2) - 3*vFactor - 3*pow(vFactor,3)
    c4 = 1 + 3*vFactor + pow(vFactor,3) + 3*pow(vFactor,2)
    T3 = c1*ema6 + c2*ema5 + c3*ema4 + c4*ema3
    T3


hullma = getHULLMA(close,length_Ma)

t3 = getT3(close,length_Ma,0.7)


avg = (hullma+t3) /2


////////////////////////////PLOTTING////////////////////////////////////////////


colorado = avg > avg[1]? color.green : color.red

plot(avg , title="avg", color=colorado, linewidth = 4)

long=avg>avg[1]
short=avg<avg[1]

tplong=input(0.08, title="TP Long", step=0.01)
sllong=input(1.0, title="SL Long", step=0.01)

tpshort=input(0.03, title="TP Short", step=0.01)
slshort=input(0.06, title="SL Short", step=0.01)


if(time_cond)
    strategy.entry("long",1,when=long)
    strategy.exit("closelong", "long" , profit = close * tplong / syminfo.mintick, loss = close * sllong / syminfo.mintick, alert_message = "closelong")

    strategy.entry("short",0,when=short)
    strategy.exit("closeshort", "short" , profit = close * tpshort / syminfo.mintick, loss = close * slshort / syminfo.mintick, alert_message = "closeshort")
Published by ChaoZhang on the FMZ strategy square · last modified 2023-10-24. Collected in the Quant Trading Vault. Unvalidated research: re-test with your own data and costs before trusting it.
Build this with AgenKit
A spec is not a trading system. Paste this into your coding agent and AgenKit runs a specialist team — architecture, test-first build, risk gates, review — with paper trading on by default.
/agenkit build a production-grade trading bot with a backtest engine, risk controls and paper trading by default from strategies/Dual-Moving-Average-Cross-Market-Trading-Strategy.md- npx agenkit install engineering-kit in your project
- Paste the command into your agent and approve each phase
- Get tests, backtest, risk controls and a paper-trading switch
Understand it first
Before you run this, read the lesson behind the idea and how to backtest it honestly. Specs like this one are the survivors of an unknown number of trials; deflate their results accordingly.
Related specs
- ADX MA and EMA Long Only Trend Tracking StrategyPine Script · Trend following · 1d
- ATR and Moving Average Crossover Hybrid StrategyPine Script · Trend following · 1h
- Bollinger Band Moving Average Crossover StrategyPine Script · Trend following · 1h
- Bollinger Bands and EMA Trend Following StrategyPine Script · Trend following · 1h
- Bollinger Bands and RSI Trend Following StrategyPine Script · Trend following · 1h
- Candlestick Pattern Trend Filter StrategyPine Script · Trend following · 1d