Strategy vault / Trend following
Dual Moving Average Crossover Algorithmic Trading Strategy
This strategy mainly utilizes the moving average crossover principle, combined with the RSI indicator reversal signals and a custom dual moving average crossover algorithm to implement trend trading. The strategy…
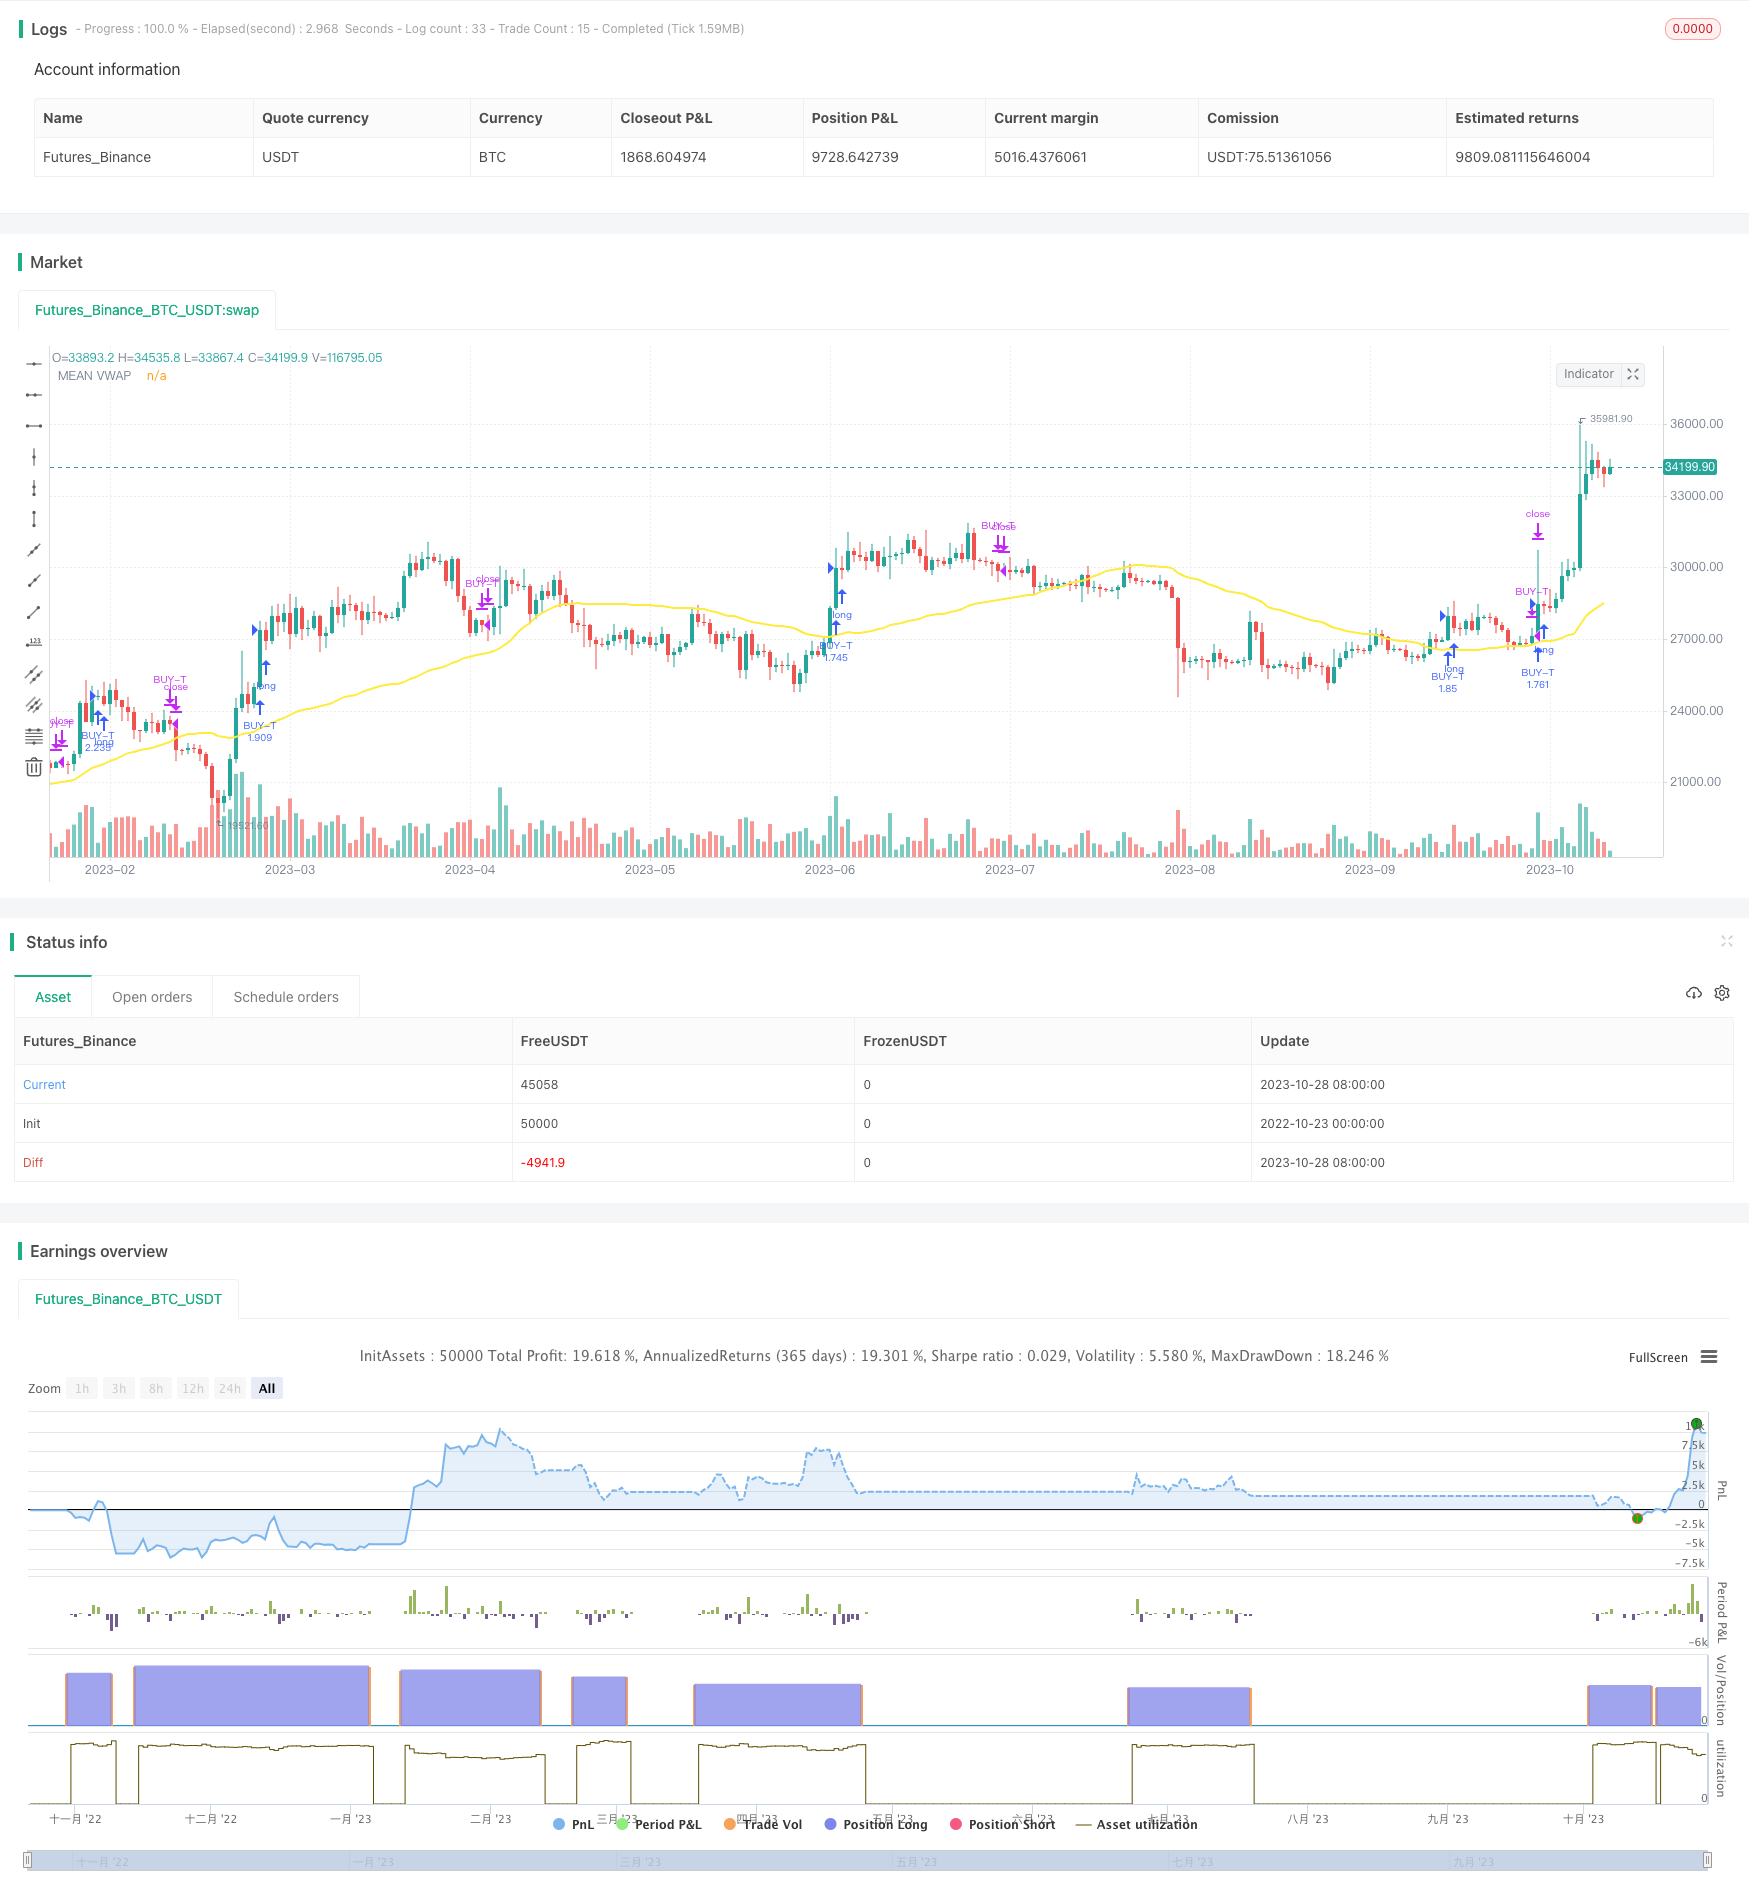
Overview
This strategy mainly utilizes the moving average crossover principle, combined with the RSI indicator reversal signals and a custom dual moving average crossover algorithm to implement trend trading. The strategy tracks two moving averages of different periods, with a faster MA tracking short-term trends and a slower MA tracking long-term trends. When the faster MA crosses over the slower MA upwards, it signals an upward trend and a chance to buy. When the faster MA crosses below the slower MA, it signals the end of the short-term trend and a chance to close positions.
Strategy Logic
Calculate two groups of VWAP moving averages with different parameters, representing long-term and short-term trends respectively.
- Slow Tenkansen and Kijunsen calculate long-term trend
- Fast Tenkansen and Kijunsen calculate short-term trend
Take the averages of Tenkansen and Kijunsen as slow and fast moving averages.
Calculate Bollinger Bands to identify consolidations and breakouts.
- Middle line is the average of fast and slow MAs
- Upper and lower bands are used to detect breakouts
Calculate TSV to determine volume energy
- TSV greater than 0 indicates bullish volume
- TSV greater than its EMA indicates strengthening momentum
Calculate RSI to identify overbought and oversold conditions
- RSI below 30 is oversold zone for buying
- RSI above 70 is overbought zone for selling
Entry conditions:
- Fast MA crosses over slow MA
- Close crosses above Upper Bollinger Band
- TSV greater than 0 and EMA
- RSI below 30
Exit conditions:
- Fast MA crosses below slow MA
- RSI greater than 70
Advantage Analysis
Dual moving average system captures both long and short term trends
RSI avoids buying overbought zones and selling oversold zones
TSV ensures sufficient volume supporting the trend
Bollinger Bands identify key breakout points
Combination of indicators helps filter false breakouts
Risk Analysis
MA systems prone to false signals, needs filtering with other indicators
RSI parameters need optimization, may otherwise miss buy/sell points
TSV also very sensitive to parameters, requires careful testing
Breaking BB upper band may be false breakout, needs verification
Difficult to optimize many indicators, risks overfitting
Insufficient train/test data may cause curve fitting
Optimization Directions
Test more periods to find best parameter combinations
Try other indicators like MACD, KD to replace or combine with RSI
Utilize walk forward analysis for parameter optimization
Add stop loss to control single trade loss
Consider machine learning models to aid signal prediction
Adjust parameters for different markets, don't overfit to single parameter set
Conclusion
This strategy captures long and short term trends using dual moving averages, and filters signals with RSI, TSV, Bollinger Bands and more. The advantage is trading in line with long-term upward momentum. But it also carries false signal risks, requiring further parameter tuning and stop losses to reduce risks. Overall, combining trend following and mean reversion yields good results in long-term uptrends, but parameters need adjustment for different markets.
Parameters
| Name | Default | What it controls |
|---|---|---|
| v_input_1_close | 0 | (?Mean Reversion Strategy Inputs)Source: close | high | low | open | hl2 | hlc3 | hlcc4 | ohlc4 |
| v_input_2 | 8 | Small VWAP |
| v_input_3 | 10 | Big VWAP |
| v_input_4 | 50 | Mean VWAP |
| v_input_5 | 2 | Percent below to buy % |
| v_input_6 | 2 | Rsi Period |
| v_input_7 | 5 | Rsi Ema Period |
| v_input_8 | 30 | Maximum Rsi Level for Buy |
| v_input_9 | 9 | (?Trend Hunter Strategy Inputs)Slow Tenkan Sen VWAP Line Length |
| v_input_10 | 13 | Slow Kijun Sen VWAP Line Length |
| v_input_11 | 3 | Fast Tenkan Sen VWAP Line Length |
| v_input_12 | 7 | Fast Kijun Sen VWAP Line Length |
| v_input_13 | 20 | Bollinger Band Length |
| v_input_14 | 2 | Bollinger Band StdDev |
| v_input_15 | 20 | TSV Length |
| v_input_16 | 7 | TSV Ema Length |
| v_input_17 | 20 | Vidya Length |
| v_input_18_hl2 | 0 | Vidya Source: hl2 | high | low | open | close | hlc3 | hlcc4 | ohlc4 |
| v_input_19 | true | (?Strategy Date Range)Start Date |
| v_input_20 | true | Start Month |
| v_input_21 | 2000 | Start Year |
| v_input_22 | 31 | End Date |
| v_input_23 | 12 | End Month |
| v_input_24 | 2021 | End Year |
Source Pine Script
/*backtest
start: 2022-10-23 00:00:00
end: 2023-10-29 00:00:00
period: 1d
basePeriod: 1h
exchanges: [{"eid":"Futures_Binance","currency":"BTC_USDT"}]
*/

// @version=4

// Credits

// "Vwap with period" code which used in this strategy to calculate the leadLine was written by "neolao" active on https://tr.tradingview.com/u/neolao/
// "TSV" code which used in this strategy was written by "liw0" active on https://www.tradingview.com/u/liw0. The code is corrected by "vitelot" December 2018.
// "Vidya" code which used in this strategy was written by "everget" active on https://tr.tradingview.com/u/everget/

strategy("HYE Combo Market [Strategy] (Vwap Mean Reversion + Trend Hunter)", overlay = true, initial_capital = 1000, default_qty_value = 100, default_qty_type = strategy.percent_of_equity, commission_value = 0.025)

//Strategy inputs

source = input(title = "Source", defval = close, group = "Mean Reversion Strategy Inputs")
smallcumulativePeriod = input(title = "Small VWAP", defval = 8, group = "Mean Reversion Strategy Inputs")
bigcumulativePeriod = input(title = "Big VWAP", defval = 10, group = "Mean Reversion Strategy Inputs")
meancumulativePeriod = input(title = "Mean VWAP", defval = 50, group = "Mean Reversion Strategy Inputs")
percentBelowToBuy = input(title = "Percent below to buy %", defval = 2, group = "Mean Reversion Strategy Inputs")
rsiPeriod = input(title = "Rsi Period", defval = 2, group = "Mean Reversion Strategy Inputs")
rsiEmaPeriod = input(title = "Rsi Ema Period", defval = 5, group = "Mean Reversion Strategy Inputs")
rsiLevelforBuy = input(title = "Maximum Rsi Level for Buy", defval = 30, group = "Mean Reversion Strategy Inputs")
slowtenkansenPeriod = input(9, minval=1, title="Slow Tenkan Sen VWAP Line Length", group = "Trend Hunter Strategy Inputs")
slowkijunsenPeriod = input(13, minval=1, title="Slow Kijun Sen VWAP Line Length", group = "Trend Hunter Strategy Inputs")
fasttenkansenPeriod = input(3, minval=1, title="Fast Tenkan Sen VWAP Line Length", group = "Trend Hunter Strategy Inputs")
fastkijunsenPeriod = input(7, minval=1, title="Fast Kijun Sen VWAP Line Length", group = "Trend Hunter Strategy Inputs")
BBlength = input(20, minval=1, title= "Bollinger Band Length", group = "Trend Hunter Strategy Inputs")
BBmult = input(2.0, minval=0.001, maxval=50, title="Bollinger Band StdDev", group = "Trend Hunter Strategy Inputs")
tsvlength  = input(20, minval=1, title="TSV Length", group = "Trend Hunter Strategy Inputs")
tsvemaperiod = input(7, minval=1, title="TSV Ema Length", group = "Trend Hunter Strategy Inputs")
length = input(title="Vidya Length", type=input.integer, defval=20, group = "Trend Hunter Strategy Inputs")
src = input(title="Vidya Source", type=input.source, defval= hl2 , group = "Trend Hunter Strategy Inputs")

// Vidya Calculation

getCMO(src, length) =>
    mom = change(src)
    upSum = sum(max(mom, 0), length)
    downSum = sum(-min(mom, 0), length)
    out = (upSum - downSum) / (upSum + downSum)
    out

cmo = abs(getCMO(src, length))

alpha = 2 / (length + 1)

vidya = 0.0
vidya := src * alpha * cmo + nz(vidya[1]) * (1 - alpha * cmo)

// Make input options that configure backtest date range

startDate = input(title="Start Date", type=input.integer,
     defval=1, minval=1, maxval=31, group = "Strategy Date Range")
startMonth = input(title="Start Month", type=input.integer,
     defval=1, minval=1, maxval=12, group = "Strategy Date Range")
startYear = input(title="Start Year", type=input.integer,
     defval=2000, minval=1800, maxval=2100, group = "Strategy Date Range")

endDate = input(title="End Date", type=input.integer,
     defval=31, minval=1, maxval=31, group = "Strategy Date Range")
endMonth = input(title="End Month", type=input.integer,
     defval=12, minval=1, maxval=12, group = "Strategy Date Range")
endYear = input(title="End Year", type=input.integer,
     defval=2021, minval=1800, maxval=2100, group = "Strategy Date Range")

inDateRange = true
// Mean Reversion Strategy Calculation

typicalPriceS = (high + low + close) / 3
typicalPriceVolumeS = typicalPriceS * volume
cumulativeTypicalPriceVolumeS = sum(typicalPriceVolumeS, smallcumulativePeriod)
cumulativeVolumeS = sum(volume, smallcumulativePeriod)
smallvwapValue = cumulativeTypicalPriceVolumeS / cumulativeVolumeS

typicalPriceB = (high + low + close) / 3
typicalPriceVolumeB = typicalPriceB * volume
cumulativeTypicalPriceVolumeB = sum(typicalPriceVolumeB, bigcumulativePeriod)
cumulativeVolumeB = sum(volume, bigcumulativePeriod)
bigvwapValue = cumulativeTypicalPriceVolumeB / cumulativeVolumeB

typicalPriceM = (high + low + close) / 3
typicalPriceVolumeM = typicalPriceM * volume
cumulativeTypicalPriceVolumeM = sum(typicalPriceVolumeM, meancumulativePeriod)
cumulativeVolumeM = sum(volume, meancumulativePeriod)
meanvwapValue = cumulativeTypicalPriceVolumeM / cumulativeVolumeM

rsiValue = rsi(source, rsiPeriod)
rsiEMA   = ema(rsiValue, rsiEmaPeriod)
buyMA = ((100 - percentBelowToBuy) / 100) * bigvwapValue[0]

inTrade = strategy.position_size > 0
notInTrade = strategy.position_size <= 0

if(crossunder(smallvwapValue, buyMA) and rsiEMA < rsiLevelforBuy and close < meanvwapValue and inDateRange and notInTrade)
    strategy.entry("BUY-M", strategy.long)

if(close > meanvwapValue or not inDateRange)
    strategy.close("BUY-M")

// Trend Hunter Strategy Calculation

// Slow Tenkan Sen Calculation

typicalPriceTS = (high + low + close) / 3
typicalPriceVolumeTS = typicalPriceTS * volume
cumulativeTypicalPriceVolumeTS = sum(typicalPriceVolumeTS, slowtenkansenPeriod)
cumulativeVolumeTS = sum(volume, slowtenkansenPeriod)
slowtenkansenvwapValue = cumulativeTypicalPriceVolumeTS / cumulativeVolumeTS

// Slow Kijun Sen Calculation

typicalPriceKS = (high + low + close) / 3
typicalPriceVolumeKS = typicalPriceKS * volume
cumulativeTypicalPriceVolumeKS = sum(typicalPriceVolumeKS, slowkijunsenPeriod)
cumulativeVolumeKS = sum(volume, slowkijunsenPeriod)
slowkijunsenvwapValue = cumulativeTypicalPriceVolumeKS / cumulativeVolumeKS

// Fast Tenkan Sen Calculation

typicalPriceTF = (high + low + close) / 3
typicalPriceVolumeTF = typicalPriceTF * volume
cumulativeTypicalPriceVolumeTF = sum(typicalPriceVolumeTF, fasttenkansenPeriod)
cumulativeVolumeTF = sum(volume, fasttenkansenPeriod)
fasttenkansenvwapValue = cumulativeTypicalPriceVolumeTF / cumulativeVolumeTF

// Fast Kijun Sen Calculation

typicalPriceKF = (high + low + close) / 3
typicalPriceVolumeKF = typicalPriceKS * volume
cumulativeTypicalPriceVolumeKF = sum(typicalPriceVolumeKF, fastkijunsenPeriod)
cumulativeVolumeKF = sum(volume, fastkijunsenPeriod)
fastkijunsenvwapValue = cumulativeTypicalPriceVolumeKF / cumulativeVolumeKF

// Slow LeadLine Calculation

lowesttenkansen_s = lowest(slowtenkansenvwapValue, slowtenkansenPeriod)
highesttenkansen_s = highest(slowtenkansenvwapValue, slowtenkansenPeriod)

lowestkijunsen_s = lowest(slowkijunsenvwapValue, slowkijunsenPeriod)
highestkijunsen_s = highest(slowkijunsenvwapValue, slowkijunsenPeriod)

slowtenkansen = avg(lowesttenkansen_s, highesttenkansen_s)
slowkijunsen = avg(lowestkijunsen_s, highestkijunsen_s)
slowleadLine = avg(slowtenkansen, slowkijunsen)

// Fast LeadLine Calculation

lowesttenkansen_f = lowest(fasttenkansenvwapValue, fasttenkansenPeriod)
highesttenkansen_f = highest(fasttenkansenvwapValue, fasttenkansenPeriod)

lowestkijunsen_f = lowest(fastkijunsenvwapValue, fastkijunsenPeriod)
highestkijunsen_f = highest(fastkijunsenvwapValue, fastkijunsenPeriod)

fasttenkansen = avg(lowesttenkansen_f, highesttenkansen_f)
fastkijunsen = avg(lowestkijunsen_f, highestkijunsen_f)
fastleadLine = avg(fasttenkansen, fastkijunsen)

// BBleadLine Calculation

BBleadLine = avg(fastleadLine, slowleadLine)

// Bollinger Band Calculation

basis = sma(BBleadLine, BBlength)
dev = BBmult * stdev(BBleadLine, BBlength)
upper = basis + dev
lower = basis - dev

// TSV Calculation

tsv = sum(close>close[1]?volume*(close-close[1]):close<close[1]?volume*(close-close[1]):0,tsvlength)
tsvema = ema(tsv, tsvemaperiod)

// Rules for Entry & Exit

if(fastleadLine > fastleadLine[1] and slowleadLine > slowleadLine[1] and tsv > 0 and tsv > tsvema and close > upper and close > vidya and inDateRange and notInTrade)
    strategy.entry("BUY-T", strategy.long)

if((fastleadLine < fastleadLine[1] and slowleadLine < slowleadLine[1]) or not inDateRange)
    strategy.close("BUY-T")

// Plots

plot(meanvwapValue, title="MEAN VWAP", linewidth=2, color=color.yellow)

//plot(vidya, title="VIDYA", linewidth=2, color=color.green)

//colorsettingS = input(title="Solid Color Slow Leadline", defval=false, type=input.bool)
//plot(slowleadLine, title = "Slow LeadLine", color = colorsettingS ? color.aqua : slowleadLine > slowleadLine[1] ? color.green : color.red, linewidth=3)

//colorsettingF = input(title="Solid Color Fast Leadline", defval=false, type=input.bool)
//plot(fastleadLine, title = "Fast LeadLine", color = colorsettingF ? color.orange : fastleadLine > fastleadLine[1] ? color.green : color.red, linewidth=3)

//p1 = plot(upper, "Upper BB", color=#2962FF)
//p2 = plot(lower, "Lower BB", color=#2962FF)
//fill(p1, p2, title = "Background", color=color.blue)

//plot(smallvwapValue, color=#13C425, linewidth=2)
//plot(bigvwapValue, color=#CA1435, linewidth=2)
Published by ChaoZhang on the FMZ strategy square · last modified 2023-10-30. Collected in the Quant Trading Vault. Unvalidated research: re-test with your own data and costs before trusting it.
Build this with AgenKit
A spec is not a trading system. Paste this into your coding agent and AgenKit runs a specialist team — architecture, test-first build, risk gates, review — with paper trading on by default.
/agenkit build a production-grade trading bot with a backtest engine, risk controls and paper trading by default from strategies/Dual-Moving-Average-Crossover-Algorithmic-Trading-Strategy.md- npx agenkit install engineering-kit in your project
- Paste the command into your agent and approve each phase
- Get tests, backtest, risk controls and a paper-trading switch
Understand it first
Before you run this, read the lesson behind the idea and how to backtest it honestly. Specs like this one are the survivors of an unknown number of trials; deflate their results accordingly.
Related specs
- Indicator Verification Automated Trading StrategyPine Script · Trend following · 10m
- Bollinger Bands and RSI Trend Following StrategyPine Script · Trend following · 1h
- EMA and RSI Trend Trading StrategyPine Script · Trend following · 1d
- Fixed Range Volume Profile And Anchored VWAP Trend Identification Strategy With Dynamic Stop LossPine Script · Trend following · 1h
- Multi Indicator Trend Following Strategy with Dynamic Risk ManagementPine Script · Trend following · 2h
- Dynamic Moving Average Trend Crossover StrategyPine Script · Trend following · 1d