Strategy vault / Trend following
Dual Moving Average Crossover Strategy 442921
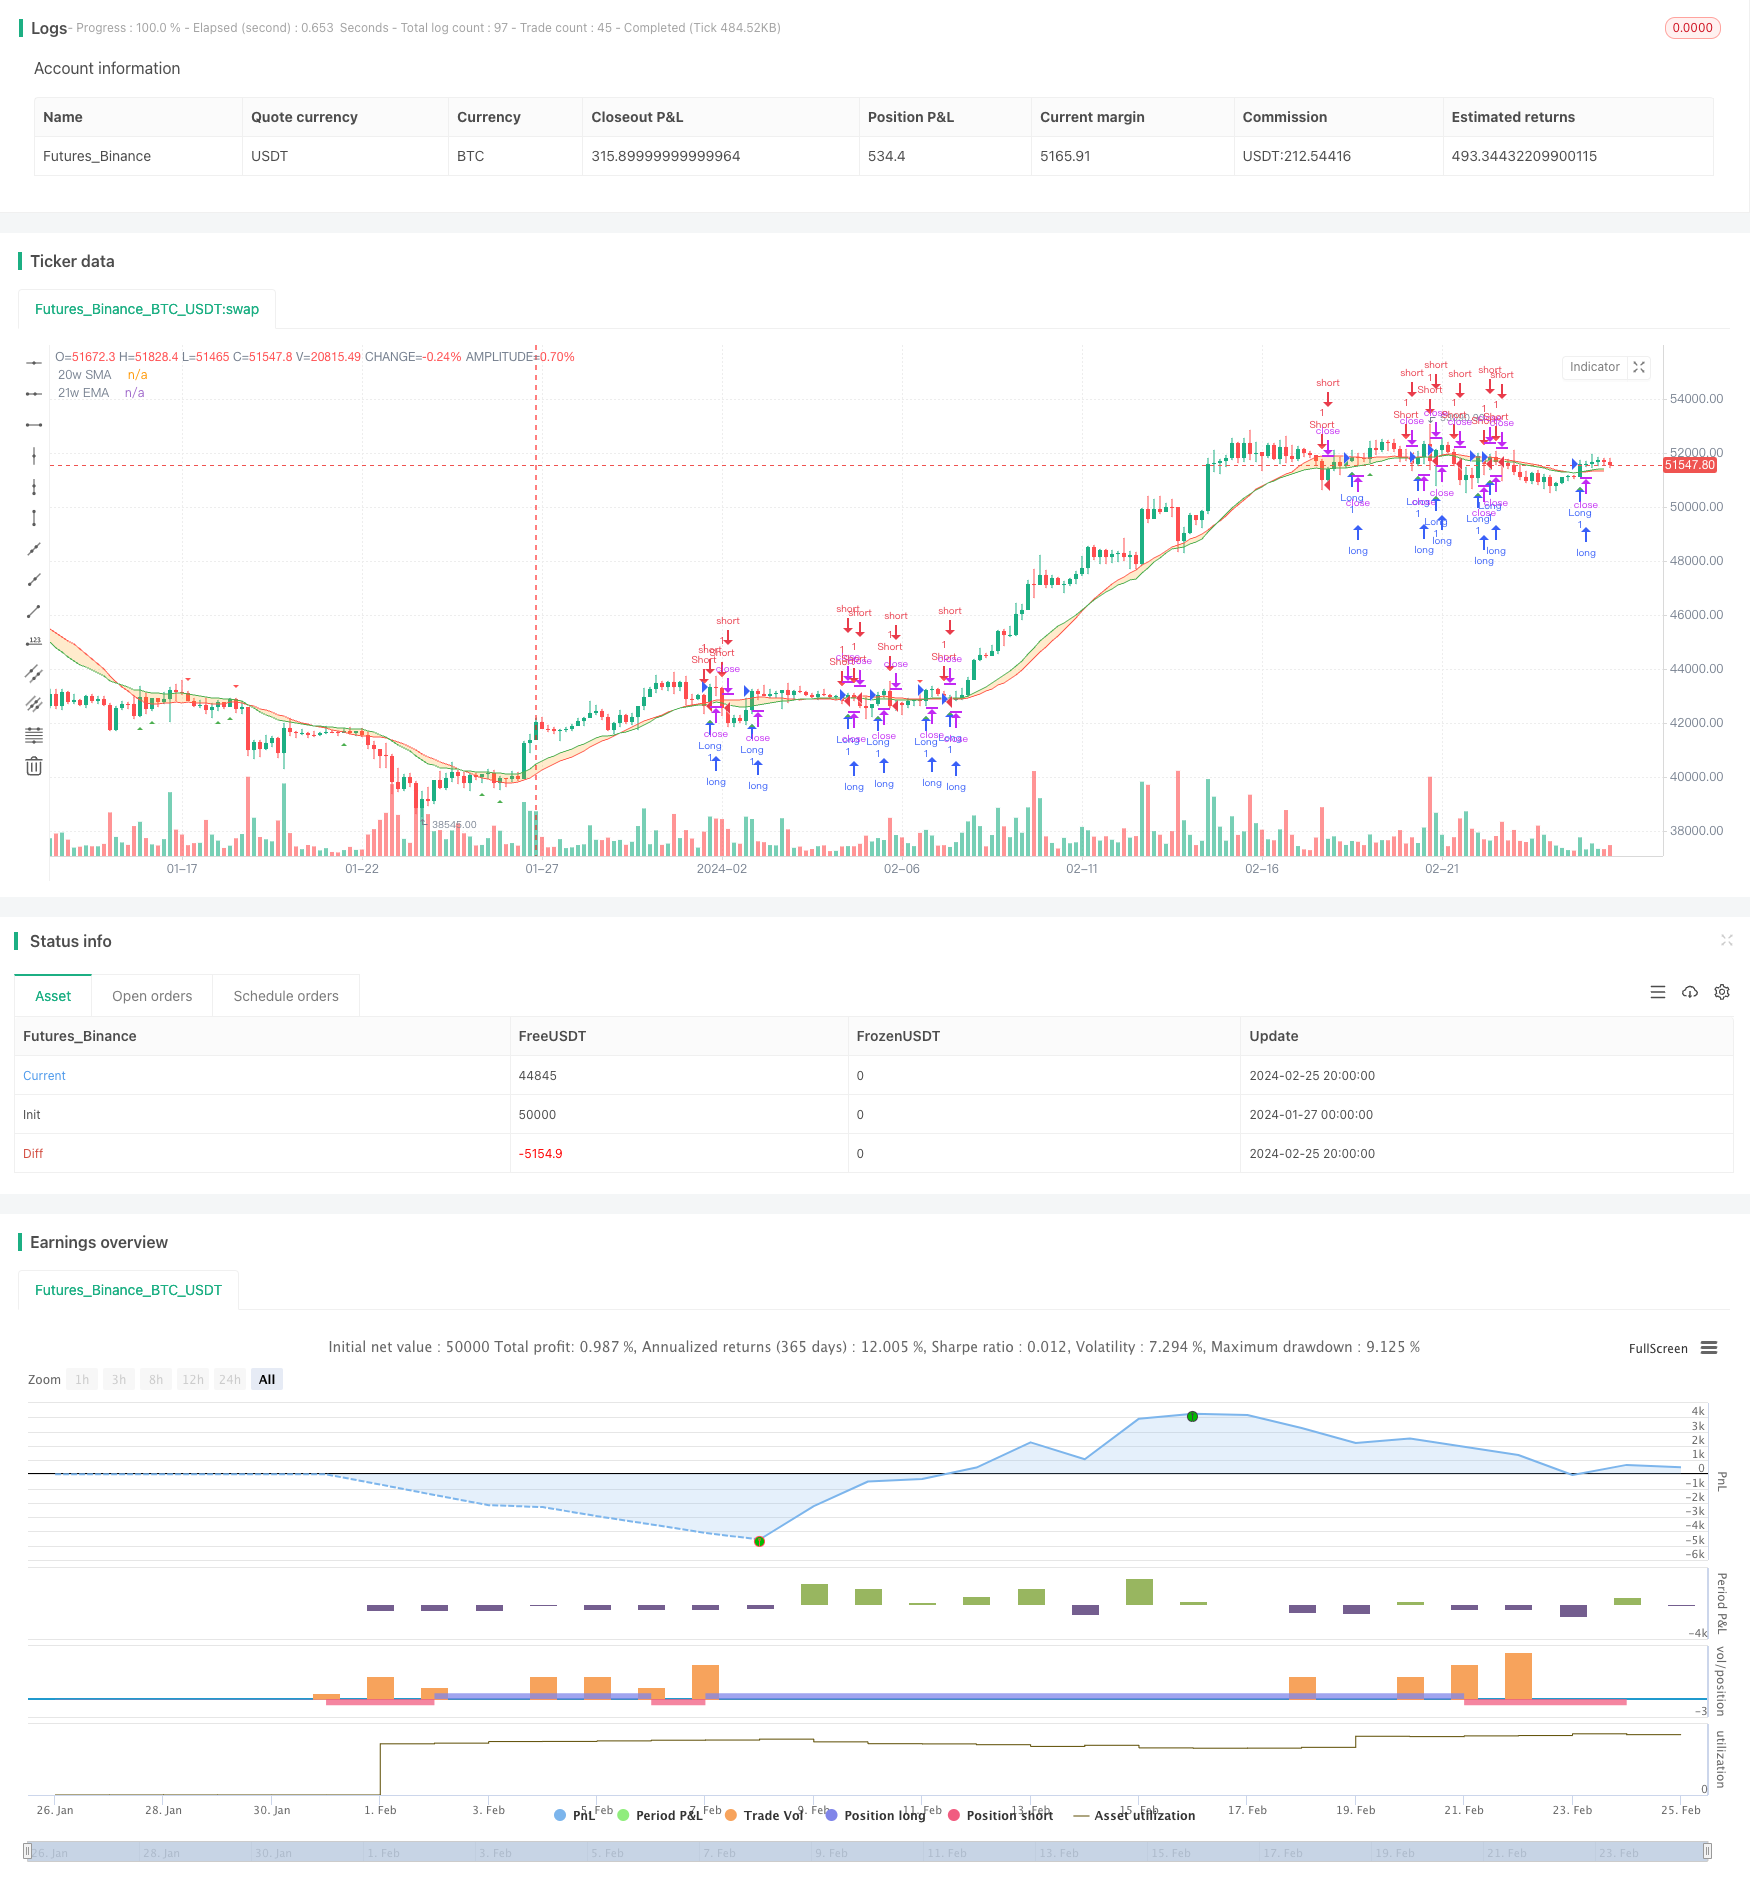
This strategy calculates and plots the 20-period simple moving average (SMA) and 21-period exponential moving average (EMA), fills the color between them to visualize the price fluctuation zone. It generates buy…
Overview
This strategy calculates and plots the 20-period simple moving average (SMA) and 21-period exponential moving average (EMA), fills the color between them to visualize the price fluctuation zone. It generates buy signals when the price crosses above the 20-period SMA and sell signals when the price crosses below the 21-period EMA. The strategy also has trailing stop loss and take profit functions.
Strategy Logic
The core idea of the dual moving average crossover strategy is to use the crossovers between fast and slow moving averages as trading signals. The 20-period SMA responds faster to price changes while the 21-period EMA is slightly lagging but smoother. When the short-term and long-term trends are consistent, i.e. the two moving averages crossover up or down, it indicates the trend is strengthening and the trading decisions made will likely be more profitable.
Specifically, when the closing price crosses above the 20-period SMA, it indicates that both short-term and long-term are in uptrends, so go long. When the closing price crosses below the 21-period EMA, it indicates that both short-term and long-term are in downtrends, so go short. The exit signals are opposite of the entry signals. For example, when price drops below the 20-period SMA, close long positions. When price crosses back above the 21-period EMA, close short positions.
The fill technique is also used to fill color between the two moving averages to form a visual indicator to aid in judging market trends.
Advantages
The dual moving average crossover strategy has the following advantages:
- Simple logic and easy to understand and implement;
- Crossovers of the two moving averages reliably indicate changes in trend direction;
- Visual indicator intuitively displays price fluctuation levels;
- Trailing stop loss and take profit locks in profits and reduces risks;
- High extensibility for various optimizations based on this strategy.
Risks
There are also some risks with this strategy:
- Prone to whipsaws and generating false signals during range-bound periods;
- Improper stop loss and take profit settings may lead to losses or reduced profits;
- Inadequate parameter tuning (e.g. period lengths) may adversely affect strategy performance;
- Automated trading may trigger consecutive losses.
The following measures can be adopted to address the above risks:
- Add filters to avoid entering during choppy periods;
- Optimize stop loss and take profit parameters to balance risk-return;
- Test parameter robustness and select appropriate parameters for the market;
- Manually intervene during exceptional circumstances to prevent enlarged losses.
Enhancement Opportunities
The strategy can be improved in the following aspects:
- Add other technical indicator filters, such as volume and volatility, to avoid false breakouts;
- Dynamically optimize moving average parameters based on machine learning;
- Incorporate sentiment and news analytics to improve decisions;
- Build in adaptive stop loss mechanism to adjust stop loss scale based on market conditions.
Summary
This strategy identifies trend changes using crossovers between fast and slow moving averages, and makes corresponding long and short decisions. It has advantages like simplicity, intuitiveness and ease of implementation, but also bears some risks. The risks can be reduced and performance improved via parameter optimization, adding filters, manual oversight etc. The strategy has great extensibility and is worth in-depth research and application.
Source Pine Script
/*backtest
start: 2024-01-27 00:00:00
end: 2024-02-26 00:00:00
period: 4h
basePeriod: 15m
exchanges: [{"eid":"Futures_Binance","currency":"BTC_USDT"}]
*/

//@version=5
strategy("BMSB Breakout Strategy", shorttitle="BMSB Breakout", overlay=true)

source = close
smaLength = 20
emaLength = 21

sma = ta.sma(source, smaLength)
ema = ta.ema(source, emaLength)

outSma = request.security(syminfo.tickerid, timeframe.period, sma)
outEma = request.security(syminfo.tickerid, timeframe.period, ema)

smaPlot = plot(outSma, color=color.new(color.red, 0), title='20w SMA')
emaPlot = plot(outEma, color=color.new(color.green, 0), title='21w EMA')

fill(smaPlot, emaPlot, color=color.new(color.orange, 75), fillgaps=true)

// Definir condiciones para la estrategia de compra y venta
buyCondition = ta.crossover(close, outSma)
sellCondition = ta.crossunder(close, outEma)

// Entrada larga (compra) y salida corta
strategy.entry("Long", strategy.long, when=buyCondition and not na(sellCondition))
strategy.close("Short", when=buyCondition)

// Entrada corta (venta) y salida larga
strategy.entry("Short", strategy.short, when=sellCondition and not na(buyCondition))
strategy.close("Long", when=sellCondition)

// Puedes ajustar la configuración de la estrategia y los valores predeterminados según tus preferencias

plotshape(series=buyCondition, location=location.belowbar, color=color.green, style=shape.triangleup, title="Buy Signal")
plotshape(series=sellCondition, location=location.abovebar, color=color.red, style=shape.triangledown, title="Sell Signal")
Published by ChaoZhang on the FMZ strategy square · last modified 2024-02-27. Collected in the Quant Trading Vault. Unvalidated research: re-test with your own data and costs before trusting it.
Build this with AgenKit
A spec is not a trading system. Paste this into your coding agent and AgenKit runs a specialist team — architecture, test-first build, risk gates, review — with paper trading on by default.
/agenkit build a production-grade trading bot with a backtest engine, risk controls and paper trading by default from strategies/Dual-Moving-Average-Crossover-Strategy-442921.md- npx agenkit install engineering-kit in your project
- Paste the command into your agent and approve each phase
- Get tests, backtest, risk controls and a paper-trading switch
Understand it first
Before you run this, read the lesson behind the idea and how to backtest it honestly. Specs like this one are the survivors of an unknown number of trials; deflate their results accordingly.
Related specs
- ADX MA and EMA Long Only Trend Tracking StrategyPine Script · Trend following · 1d
- ATR and Moving Average Crossover Hybrid StrategyPine Script · Trend following · 1h
- Bollinger Band Moving Average Crossover StrategyPine Script · Trend following · 1h
- Bollinger Bands and EMA Trend Following StrategyPine Script · Trend following · 1h
- Bollinger Bands and RSI Trend Following StrategyPine Script · Trend following · 1h
- Candlestick Pattern Trend Filter StrategyPine Script · Trend following · 1d