Strategy vault / Trend following
Dual Moving Average Crossover Trend Strategy 432917
The Dual Moving Average Crossover Trend Strategy is a trend following strategy that generates buy and sell signals when fast and slow moving average lines cross. It incorporates multiple indicators like MACD and RSI…
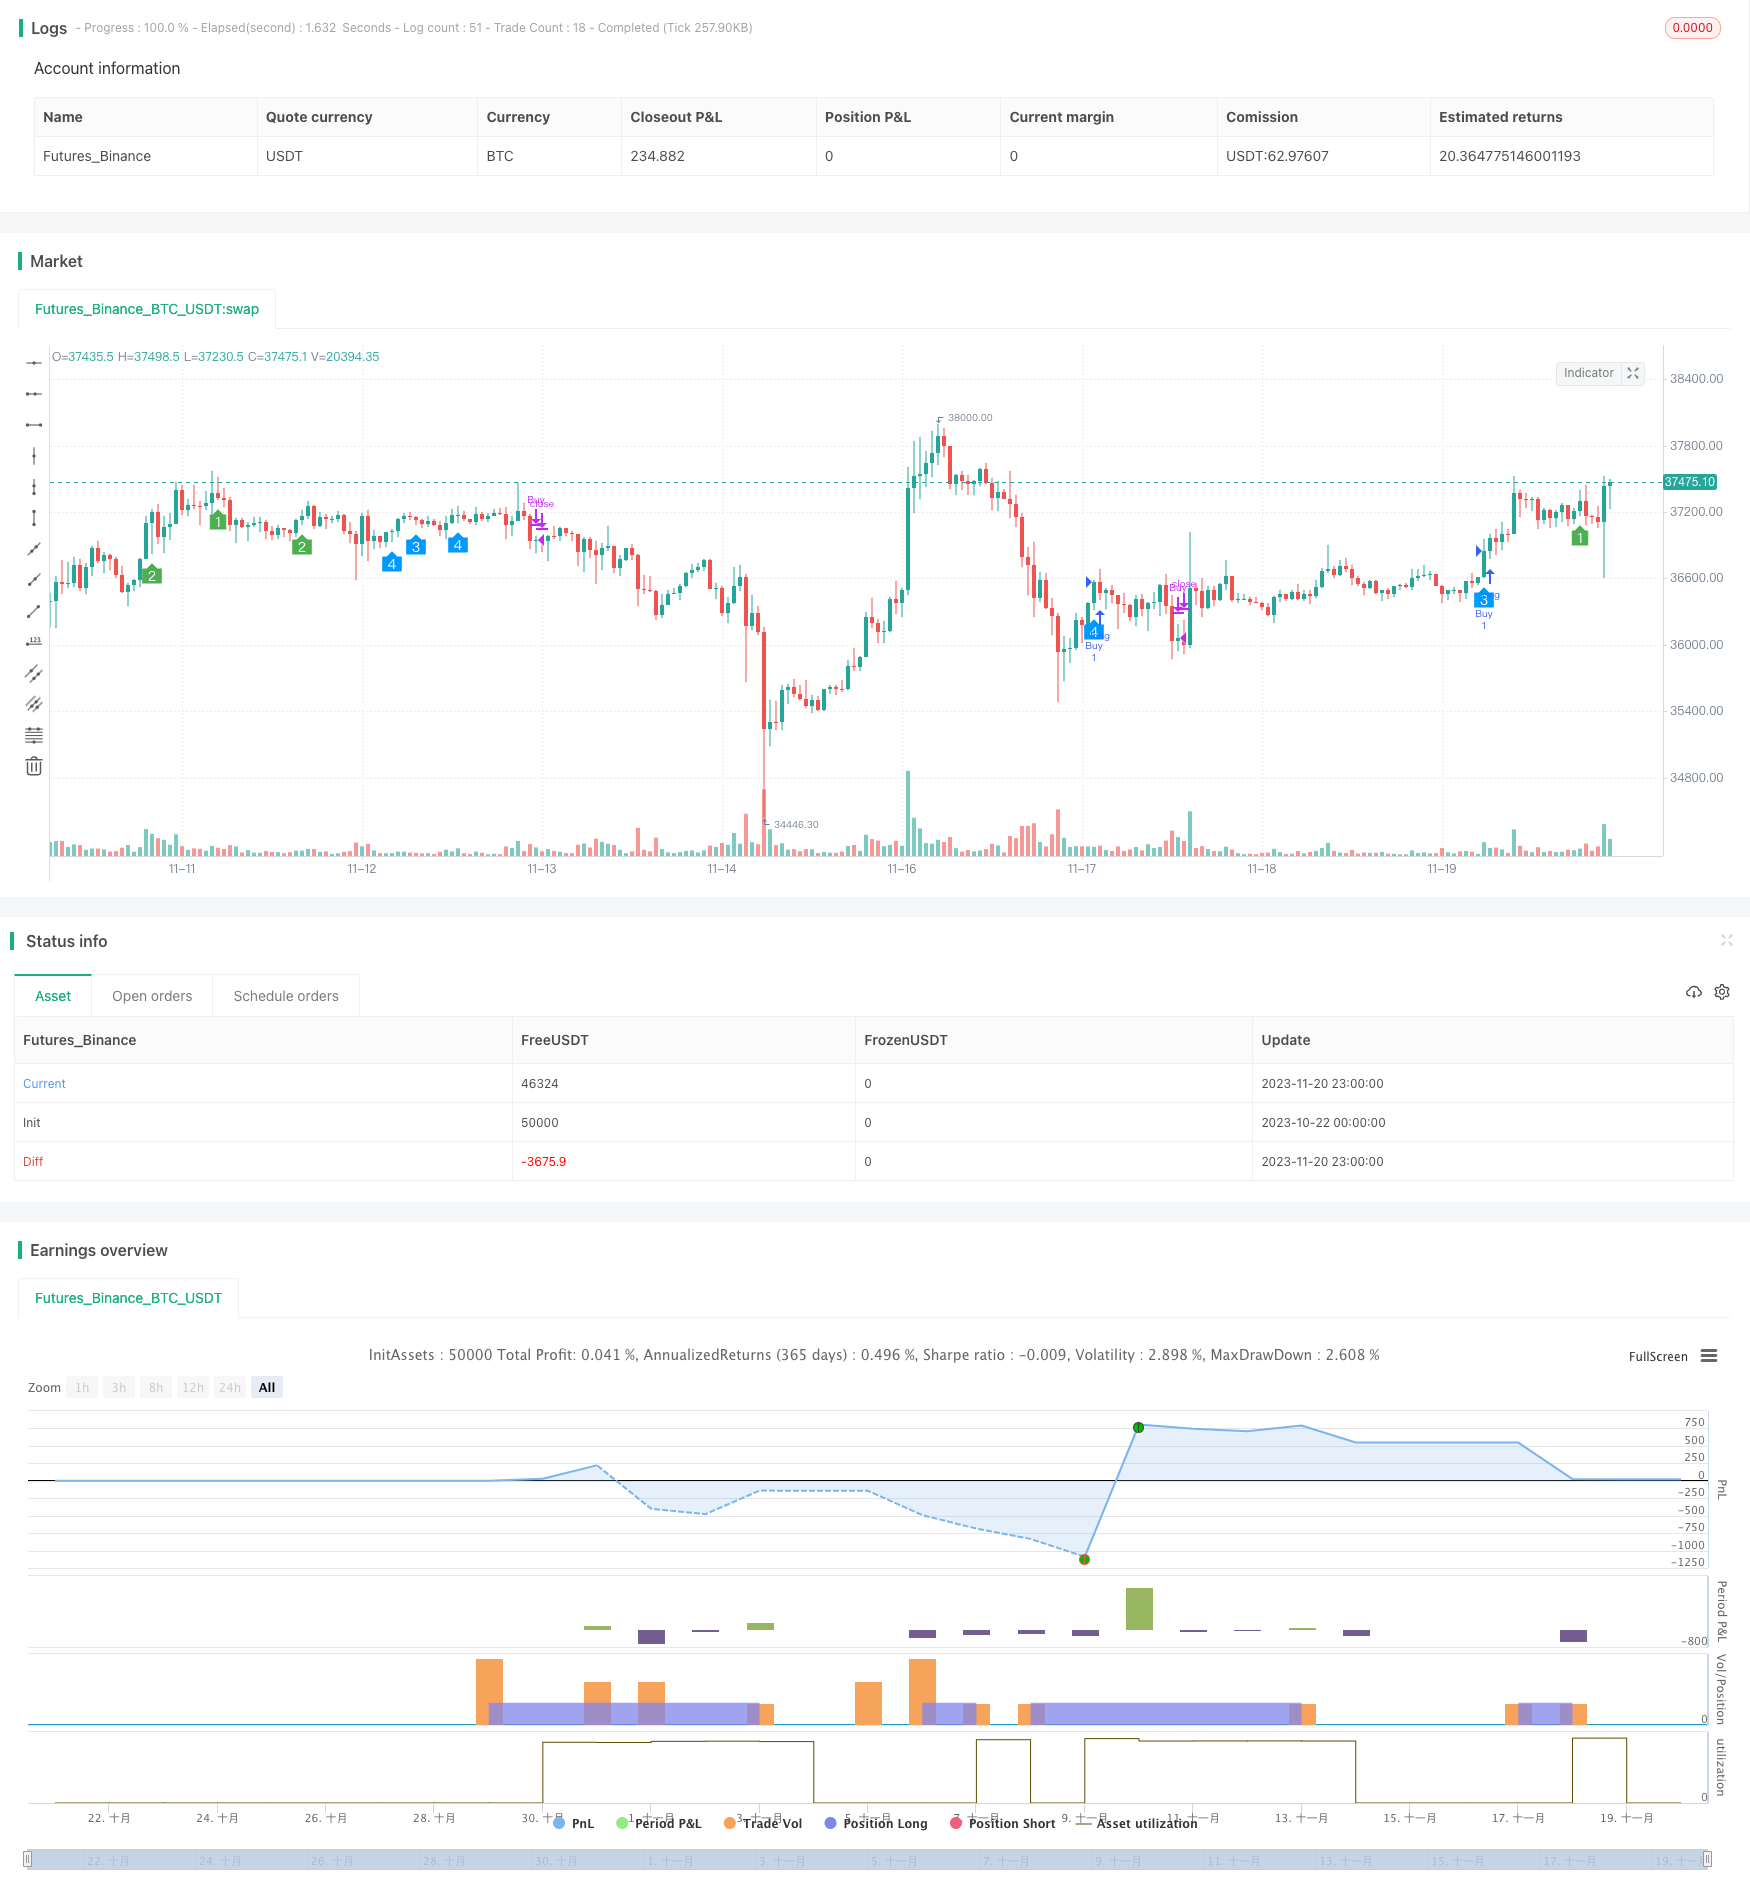
Overview
The Dual Moving Average Crossover Trend Strategy is a trend following strategy that generates buy and sell signals when fast and slow moving average lines cross. It incorporates multiple indicators like MACD and RSI to determine the trend direction and has strong trend tracking capability.
Strategy Logic
The strategy mainly uses the following indicators for judgment:
Fast and slow moving average lines: golden cross for buy signal, death cross for sell signal.
MACD: MACD line above Signal line and rising MACD lowest for bullish signal.
RSI: RSI above 50 for bullish, below 50 for bearish.
Awesome Oscillator (AO): AO crossing above 0 line for buy, crossing below for sell.
Three daily moving averages: shorter period daily MA crossing above longer period daily MA as buy signal.
The strategy combines multiple timeframes and indicators to generate buy and sell logic. It produces buy orders when multiple indicators show bullish signals at the same time, and sell orders when bearish signals emerge, to track the trend.
Advantage Analysis
The strategy has the following advantages:
Multi-indicator combo reduces false signals and improves accuracy.
Incorporating multiple timeframes identifies larger trend direction.
Parameter tuning provides good profitability.
Adopts moving stop loss to control risk and limit losses.
Automated trend tracking without manual intervention, reducing costs.
Risk Analysis
It also has some risks:
More whipsaws may happen in range-bound markets. Optimize parameters to reduce invalid signals.
Black swan events could cause sharp drawdown. Set up moving stop loss to limit losses.
Complex buy/sell logic relies on large historical data to find optimal parameters.
Inappropriate stop loss setting leads to premature exit. Repeatedly backtest to find best parameters.
Optimization Directions
The strategy can be improved from the following aspects:
Test more indicator combinations for more steady and accurate signals, like volatility index, OBV etc.
Optimize indicator parameters with machine learning and genetic algorithms to reduce overtrading.
Introduce model ensemble techniques to integrate signals from multiple independent strategy models, improving robustness.
Enter trade on higher timeframe, exit on lower timeframe. Reduces holding drawdown risk.
Build quantitative risk control module with strict limits on per trade stop loss percentage, max drawdown etc.
Summary
The Dual Moving Average Crossover Trend strategy uses fast and slow MA crosses as trading signals, together with MACD, RSI to judge trend direction for automated trend tracking. Significant optimization space exists by incorporating more indicators, parameters tuning, model ensembles etc for better strategy efficacy.
Parameters
| Name | Default | What it controls |
|---|---|---|
| v_input_1 | 12 | macd_fast_length |
| v_input_2 | 26 | macd_slow_length |
| v_input_3 | 9 | macd_signal_length |
| v_input_int_1 | 14 | rsiLengthInput |
| v_input_int_3 | 5 | len1 |
| v_input_int_4 | 10 | len2 |
| v_input_int_5 | 20 | len3 |
| v_input_4_close | 0 | src: close | high | low | open | hl2 | hlc3 | hlcc4 | ohlc4 |
| v_input_source_1_close | 0 | (?RSI Settings)Source: close | high | low | open | hl2 | hlc3 | hlcc4 | ohlc4 |
| v_input_string_1 | 0 | (?MA Settings)MA Type: SMA | Bollinger Bands | EMA | SMMA (RMA) | WMA | VWMA |
| v_input_int_2 | 14 | MA Length |
| v_input_float_1 | 2 | BB StdDev |
Source Pine Script
/*backtest
start: 2023-10-22 00:00:00
end: 2023-11-21 00:00:00
period: 1h
basePeriod: 15m
exchanges: [{"eid":"Futures_Binance","currency":"BTC_USDT"}]
*/

//@version=5
strategy('SteffVans', shorttitle='SteffVans strategy', overlay=true, process_orders_on_close = true)

// Input settings
macd_fast_length = input(12)
macd_slow_length = input(26)
macd_signal_length = input(9)

// Calculate MACD values
[macd_line, signal_line, _] = ta.macd(close, macd_fast_length, macd_slow_length, macd_signal_length)
mg = ta.lowest(signal_line, 30) >= -0

// RSI
ma(source, length, type) =>
    switch type
        "SMA" => ta.sma(source, length)
        "Bollinger Bands" => ta.sma(source, length)
        "EMA" => ta.ema(source, length)
        "SMMA (RMA)" => ta.rma(source, length)
        "WMA" => ta.wma(source, length)
        "VWMA" => ta.vwma(source, length)

rsiLengthInput = input.int(14, minval=1)
rsiSourceInput = input.source(close, "Source", group="RSI Settings")
maTypeInput = input.string("SMA", title="MA Type", options=["SMA", "Bollinger Bands", "EMA", "SMMA (RMA)", "WMA", "VWMA"], group="MA Settings")
maLengthInput = input.int(14, title="MA Length", group="MA Settings")
bbMultInput = input.float(2.0, minval=0.001, maxval=50, title="BB StdDev", group="MA Settings")

up = ta.rma(math.max(ta.change(rsiSourceInput), 0), rsiLengthInput)
down = ta.rma(-math.min(ta.change(rsiSourceInput), 0), rsiLengthInput)
RSI = down == 0 ? 100 : up == 0 ? 0 : 100 - (100 / (1 + up / down))


//  AO
AO = ta.sma((high + low) / 2, 5) - ta.sma((high + low) / 2, 34)
crossaosell = AO < AO[1] and AO[1] < AO[2] and AO[2] > AO[3]  and ta.lowest(low,3)

// Uptrend sma
len1 = input.int(5, minval=1)
len2 = input.int(10, minval=1)
len3 = input.int(20, minval=1)
src = input(close)

out1 = ta.sma(src, len1)
out2 = ta.sma(src, len2)
out3 = ta.sma(src, len3)


// Timeframe
macdl60 = request.security(syminfo.tickerid, "60", signal_line,lookahead = barmerge.lookahead_on)
ao = request.security(syminfo.tickerid, "60", AO,lookahead = barmerge.lookahead_on)
rsi = request.security(syminfo.tickerid, "60", RSI,lookahead = barmerge.lookahead_on)
good = request.security(syminfo.tickerid, "60", mg,lookahead = barmerge.lookahead_on)
bad = request.security(syminfo.tickerid, "60", crossaosell,lookahead = barmerge.lookahead_on)

ma1 = request.security(syminfo.tickerid, "D", out1,lookahead = barmerge.lookahead_on)
ma2 = request.security(syminfo.tickerid, "D", out2, lookahead = barmerge.lookahead_on)
ma3 = request.security(syminfo.tickerid, "D", out3, lookahead = barmerge.lookahead_on)


// Kriteria BUY and SELL
uptrend1 =  request.security(syminfo.tickerid, "D", close,lookahead = barmerge.lookahead_on) > ma1 and ma1 > ma3 and ma2 > ma3
uptrend2 = ta.lowest(ma1,12) > ta.lowest(ma3,12) and ta.lowest(ma2,12) > ta.lowest(ma3,12)


// Triger BUY and SELL
cross1 = ao > ao[1] and ao[1] < ao[2] and ao > 0 and good and rsi >= 60 and uptrend1
cross2 = ao > 0 and ao[1] < 0 and good and rsi >=50 and uptrend1
cross3 =  ao > 0 and ao[1] < 0 and not good and uptrend2 and uptrend1
cross4 =  ao > ao[1] and ao[1] > ao[2] and ao[2] < ao[3] and ao[3] < ao[4]  and not good and uptrend2 and uptrend1

s1 = ao < ao[1] and ao[1] < ao[2] and ao[2] < ao[3] and ao > 0 and rsi < 50 and request.security(syminfo.tickerid, "D", close,lookahead = barmerge.lookahead_on) < ma1
s2 =  ao < 0 and ao < ao[2] and rsi < 50 and request.security(syminfo.tickerid, "D", close,lookahead = barmerge.lookahead_on) < ma1

// Variabel Buy dan Sell
buySignal = false
sellSignal = false

// Syarat masuk Buy
buyCondition =  cross1 or cross2 or cross3 or cross4
if buyCondition
    buySignal := true

// Syarat masuk Sell
sellCondition = s1 or s2
if sellCondition
    sellSignal := true

// Reset sinyal jika ada sinyal berulang
if buySignal and sellSignal
    sellSignal := false
if sellSignal and buySignal
    buySignal := false

// Logika perdagangan
if buySignal
    strategy.entry("Buy", strategy.long, comment = "BUY")
if sellSignal
    strategy.close("Buy")


plotshape(cross1,title = "Stefkuy1", style = shape.labelup, location = location.belowbar, color = color.green,text = "1", textcolor = color.white,size = size.small)
plotshape(cross2,title = "Stefkuy2", style = shape.labelup, location = location.belowbar, color = color.green, text = "2", textcolor= color.white, size = size.small)
plotshape(cross3,title = "StefVan1", style = shape.labelup, location = location.belowbar, color = color.rgb(0, 153, 255), text = "3", textcolor= color.white,size = size.small)
plotshape(cross4,title = "StefVan2", style = shape.labelup, location = location.belowbar, color = color.rgb(0, 153, 255), text = "4", textcolor= color.white,size = size.small)
Published by ChaoZhang on the FMZ strategy square · last modified 2023-11-22. Collected in the Quant Trading Vault. Unvalidated research: re-test with your own data and costs before trusting it.
Build this with AgenKit
A spec is not a trading system. Paste this into your coding agent and AgenKit runs a specialist team — architecture, test-first build, risk gates, review — with paper trading on by default.
/agenkit build a production-grade trading bot with a backtest engine, risk controls and paper trading by default from strategies/Dual-Moving-Average-Crossover-Trend-Strategy-432917.md- npx agenkit install engineering-kit in your project
- Paste the command into your agent and approve each phase
- Get tests, backtest, risk controls and a paper-trading switch
Understand it first
Before you run this, read the lesson behind the idea and how to backtest it honestly. Specs like this one are the survivors of an unknown number of trials; deflate their results accordingly.
Related specs
- Quantitative Trend Tracking StrategyPine Script · Trend following · 5h
- Bollinger Bands and RSI Trend Following StrategyPine Script · Trend following · 1h
- EMA and RSI Trend Trading StrategyPine Script · Trend following · 1d
- Multi Indicator Trend Following Strategy with Dynamic Risk ManagementPine Script · Trend following · 2h
- Dynamic Moving Average Trend Crossover StrategyPine Script · Trend following · 1d
- Five Minute Triple Confirmation Trend Trading Strategy with Risk Management SystemPine Script · Trend following · 1m