Strategy vault / Trend following
Dual Moving Average Crossover with RSI Strength Filter Trading Strategy
This strategy is a trading system that combines dual moving average crossover with RSI indicator filtering. It uses a 5-period Exponential Moving Average (EMA5) and a 10-period Simple Moving Average (SMA10) as…
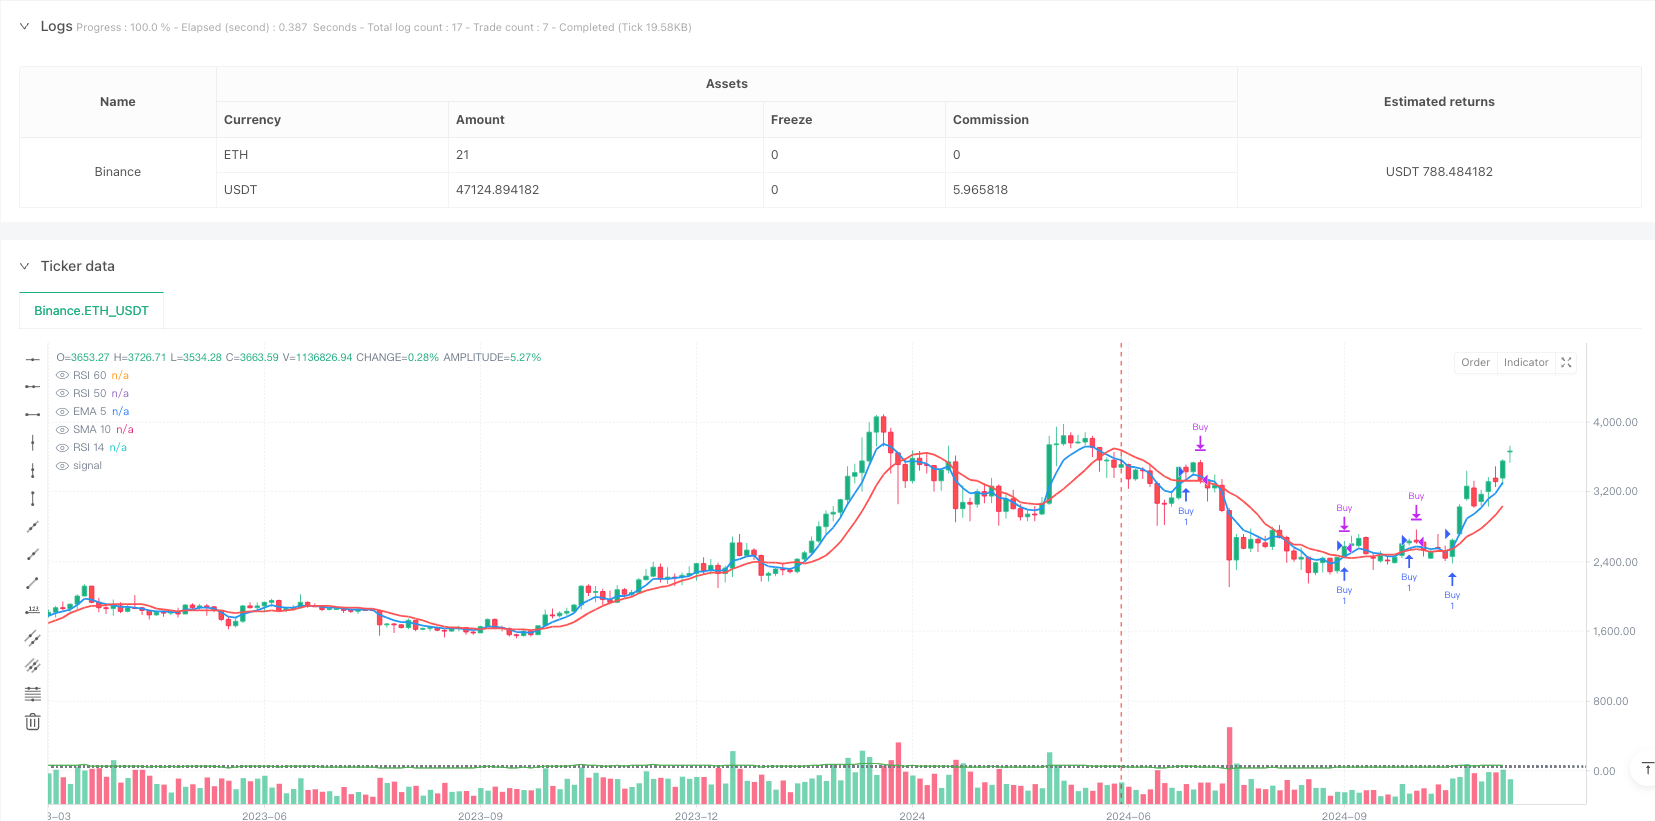
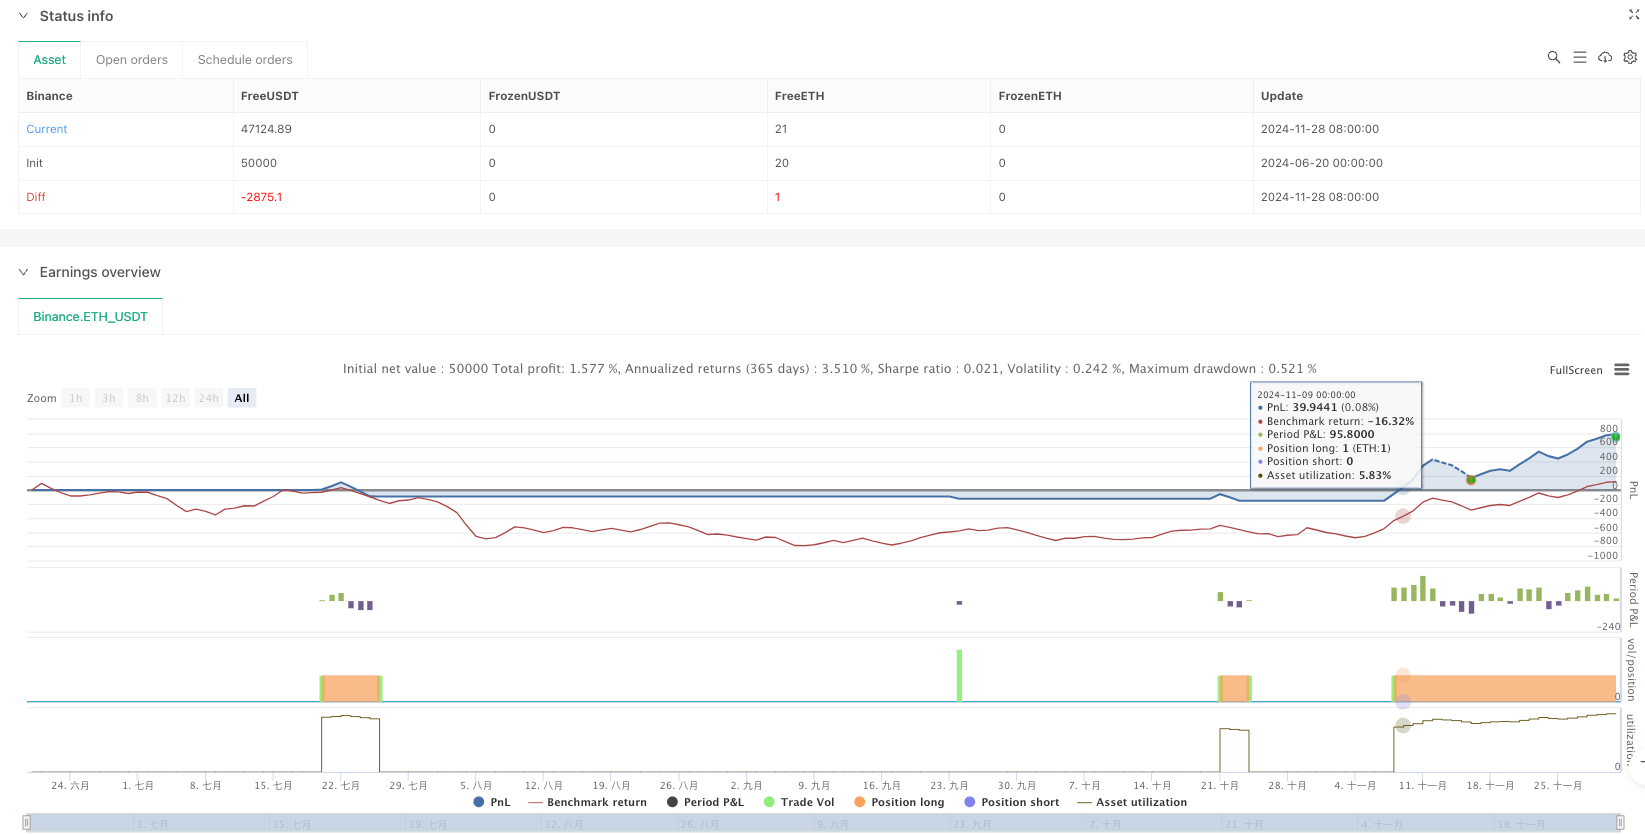
Double moving average crossover combined with RSI strength filtering trading strategy | Dual Moving Average Crossover with RSI Strength Filter Trading Strategy
Overview
This strategy is a trading system that combines dual moving average crossover with RSI indicator filtering. It uses a 5-period Exponential Moving Average (EMA5) and a 10-period Simple Moving Average (SMA10) as primary trend identification tools, while incorporating a 14-period Relative Strength Index (RSI14) as a trade signal filter to enhance trading accuracy through strict entry and exit conditions.
Strategy Principles
The strategy's core logic is based on the combination of two key technical indicators:
- Dual Moving Average System: EMA5 and SMA10 crossovers for trend change detection
- Buy signal when EMA5 crosses above SMA10
- Sell signal when EMA5 crosses below SMA10
- RSI Filtering System:
- Long positions require RSI14 value above 60
- Short positions require RSI14 value below 50
- Price must break through corresponding RSI levels to confirm trading signals
Strategy Advantages
Comprehensive Signal Confirmation
- Initial signals provided by moving average crossovers
- Secondary confirmation through RSI filter
- Final confirmation requires price breakthrough of RSI key levels
Effective Risk Control
- Clear entry and exit conditions
- Automatic position closure on reverse signals
- RSI indicator filters out potential false signals
Clear Strategy Logic
- Simple and understandable indicator combination
- Specific trading rules
- Easy to adjust and optimize
Strategy Risks
Sideways Market Risk
- Frequent moving average crossovers may lead to overtrading
- Misleading signals in ranging markets
- Recommended for use in clear trends
Lag Risk
- Moving averages have inherent lag
- RSI confirmation may miss part of price movements
- Need to balance timeliness and accuracy
Parameter Sensitivity
- Moving average periods affect signal frequency
- RSI threshold settings impact filtering effectiveness
- Different market conditions may require different parameters
Strategy Optimization Directions
Introduce Trend Strength Filtering
- Add ADX indicator for trend strength assessment
- Use looser RSI filtering conditions in strong trends
- Increase filtering stringency in weak trends
Optimize Parameter Adaptability
- Dynamically adjust moving average periods based on market volatility
- Automatically adjust RSI thresholds based on market conditions
- Implement adaptive algorithms for parameter selection
Enhance Risk Management
- Add stop-loss and take-profit mechanisms
- Implement position sizing functionality
- Include trading cost considerations
Summary
This strategy constructs a relatively complete trading system by combining dual moving average crossover with RSI filtering. Its main advantages lie in its signal confirmation mechanism and risk control measures, though it does have some inherent limitations. Through the suggested optimization directions, the strategy has the potential to achieve better performance in actual trading. It may perform particularly well in markets with clear trends.
Source Pine Script
/*backtest
start: 2024-06-20 00:00:00
end: 2024-12-01 00:00:00
period: 3d
basePeriod: 3d
exchanges: [{"eid":"Binance","currency":"ETH_USDT"}]
*/

//@version=5
strategy("EMA and SMA Crossover with RSI14 Filtering", overlay=true)

// Define parameters for EMA, SMA, and RSI
ema5_length = 5
sma10_length = 10
rsi14_length = 14
rsi60_level = 60
rsi50_level = 50

// Calculate EMAs, SMAs, and RSI
ema5 = ta.ema(close, ema5_length)
sma10 = ta.sma(close, sma10_length)
rsi14 = ta.rsi(close, rsi14_length)

// Define Crossover Conditions
positive_crossover = ta.crossover(ema5, sma10)
negative_crossover = ta.crossunder(ema5, sma10)

// Define RSI filter conditions
rsi_above_60 = rsi14 > rsi60_level
rsi_below_50 = rsi14 < rsi50_level

// Condition: price below 60 on RSI 14 and later crosses above for Buy
price_below_rsi60 = close < rsi14
price_above_rsi60 = close > rsi14

// Condition: price above 50 on RSI 14 and later crosses below for Sell
price_above_rsi50 = close > rsi14
price_below_rsi50 = close < rsi14

// Trading logic
var bool active_buy_trade = false
var bool active_sell_trade = false

// Buy Condition: EMA 5 crosses above SMA 10 and RSI 14 crosses above 60
if (positive_crossover and not active_buy_trade)
    if (price_below_rsi60)
        // Wait for price to cross above RSI 60
        if (price_above_rsi60)
            strategy.entry("Buy", strategy.long)
            active_buy_trade := true
    else
        strategy.entry("Buy", strategy.long)
        active_buy_trade := true

// Sell Condition: EMA 5 crosses below SMA 10 and RSI 14 crosses below 50
if (negative_crossover and not active_sell_trade)
    if (price_above_rsi50)
        // Wait for price to cross below RSI 50
        if (price_below_rsi50)
            strategy.entry("Sell", strategy.short)
            active_sell_trade := true
    else
        strategy.entry("Sell", strategy.short)
        active_sell_trade := true

// Exit Buy Condition: Reverse Signal (EMA crosses below SMA or RSI crosses below 50)
if (active_buy_trade and (negative_crossover or rsi14 < rsi50_level))
    strategy.close("Buy")
    active_buy_trade := false

// Exit Sell Condition: Reverse Signal (EMA crosses above SMA or RSI crosses above 60)
if (active_sell_trade and (positive_crossover or rsi14 > rsi60_level))
    strategy.close("Sell")
    active_sell_trade := false

// Plotting EMAs, SMAs, and RSI 14 on the chart
plot(ema5, color=color.blue, linewidth=2, title="EMA 5")
plot(sma10, color=color.red, linewidth=2, title="SMA 10")
hline(rsi60_level, "RSI 60", color=color.gray, linestyle=hline.style_dotted)
hline(rsi50_level, "RSI 50", color=color.gray, linestyle=hline.style_dotted)
plot(rsi14, color=color.green, linewidth=1, title="RSI 14")Published by ianzeng123 on the FMZ strategy square · last modified 2025-02-20. Collected in the Quant Trading Vault. Unvalidated research: re-test with your own data and costs before trusting it.
Build this with AgenKit
A spec is not a trading system. Paste this into your coding agent and AgenKit runs a specialist team — architecture, test-first build, risk gates, review — with paper trading on by default.
/agenkit build a production-grade trading bot with a backtest engine, risk controls and paper trading by default from strategies/Dual-Moving-Average-Crossover-with-RSI-Strength-Filter-Trading-Strategy.md- npx agenkit install engineering-kit in your project
- Paste the command into your agent and approve each phase
- Get tests, backtest, risk controls and a paper-trading switch
Understand it first
Before you run this, read the lesson behind the idea and how to backtest it honestly. Specs like this one are the survivors of an unknown number of trials; deflate their results accordingly.
Related specs
- EMA AROON ASHPine Script · Trend following · 3m
- EMA SMA Multi Indicator Comprehensive Trend Following StrategyPine Script · Trend following · 1h
- Multi Trend StrategyPine Script · Trend following · 1m
- Trend Tracking and Short term Trading Strategy Based on ADX IndicatorPine Script · Trend following · 1d
- ADX Dynamic Trend StrategyPine Script · Trend following · 10m
- Multi Period Trend Confirmation Dynamic Risk Control Quantitative Trading StrategyPine Script · Trend following · 1h