Dual Moving Average RSI Momentum Strategy Based on EMA and Trendline Breakouts
This strategy utilizes the crossover of a fast moving average (EMA) and a slow moving average (EMA), combined with the Relative Strength Index (RSI) and trendline breakouts to capture trending trading opportunities…
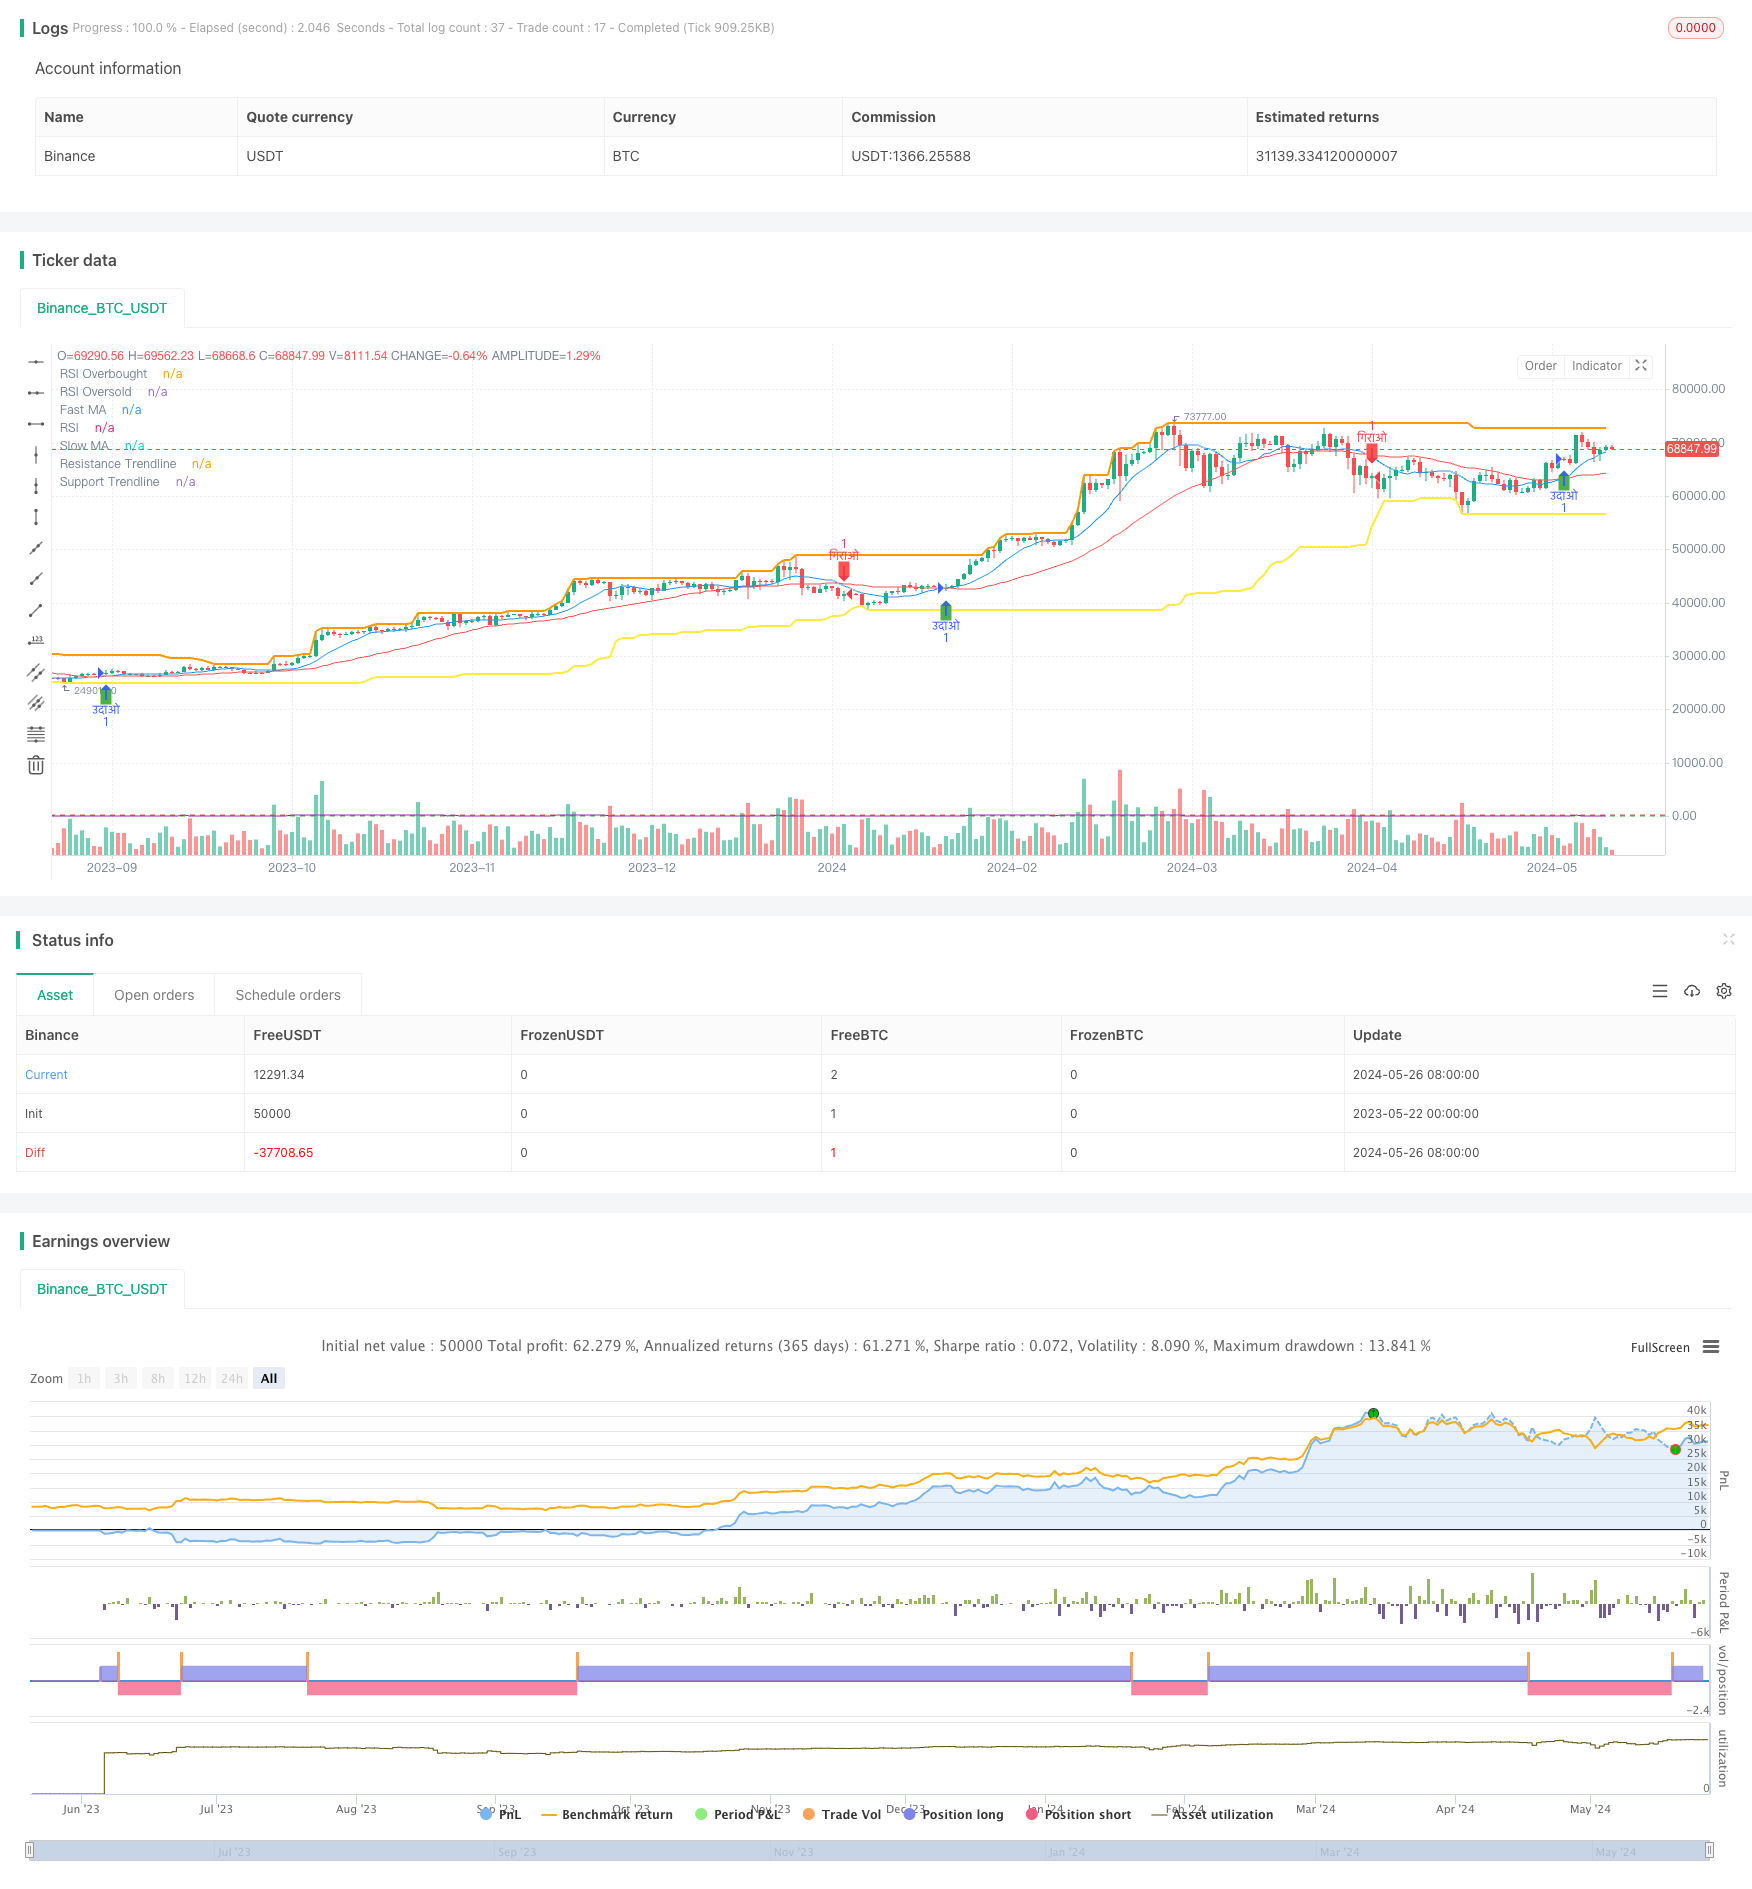
Overview
This strategy utilizes the crossover of a fast moving average (EMA) and a slow moving average (EMA), combined with the Relative Strength Index (RSI) and trendline breakouts to capture trending trading opportunities. When the fast EMA crosses above the slow EMA or the price breaks above an upward trendline, and the RSI is below the overbought level, the strategy generates a long signal. Conversely, when the fast EMA crosses below the slow EMA or the price breaks below a downward trendline, and the RSI is above the oversold level, the strategy generates a short signal. This approach of combining moving averages, RSI, and trendline breakouts can effectively capture trending markets while avoiding premature entries in choppy conditions.
Strategy Principle
- Calculate the fast EMA and slow EMA with default periods of 10 and 30, respectively.
- Calculate the RSI indicator with a default period of 14, and set the overbought and oversold levels, defaulting to 70 and 30.
- Determine trendline breakouts by comparing the current closing price with the highest high and lowest low of the past 50 periods.
- Generate a long signal when the fast EMA crosses above the slow EMA or the price breaks above an upward trendline, and the RSI is below the overbought level.
- Generate a short signal when the fast EMA crosses below the slow EMA or the price breaks below a downward trendline, and the RSI is above the oversold level.
- Plot the fast EMA, slow EMA, RSI, overbought/oversold levels, and trendline breakout levels on the chart, and mark the long and short signals.
Advantage Analysis
- By combining moving averages and the RSI indicator, the strategy can more accurately determine the trend direction and momentum strength.
- The inclusion of trendline breakouts helps better capture the starting points of trends, avoiding premature entries in choppy markets.
- Using RSI overbought and oversold levels as a filter can reduce losing trades caused by false breakouts.
- The parameters are adjustable, making the strategy suitable for different market conditions and trading styles.
Risk Analysis
- During periods of uncertain trends or high market volatility, the strategy may generate a higher number of false signals.
- The strategy relies on historical data and may become ineffective when significant market changes or black swan events occur.
- Without stop-loss and take-profit conditions, the strategy may face the risk of excessive losses in a single trade.
- Improper parameter settings may lead to poor strategy performance, requiring optimization based on market characteristics and personal risk preferences.
Optimization Directions
- Introduce additional technical indicators, such as MACD, Bollinger Bands, etc., to improve signal accuracy.
- Set dynamic stop-loss and take-profit conditions, such as trailing stops or ATR-based stops, to better manage risk.
- Optimize parameters using methods like genetic algorithms or grid search to find the best parameter combination.
- Incorporate fundamental analysis, such as economic data and policy changes, to more comprehensively grasp market trends.
Summary
By combining EMA, RSI, and trendline breakouts, this strategy can effectively capture trending trading opportunities. However, it also involves certain risks, such as false signals and dependence on historical data. Therefore, in practical application, appropriate optimization and improvements should be made based on market characteristics and personal risk preferences, such as introducing more indicators, setting dynamic stop-loss and take-profit, optimizing parameters, etc. Additionally, incorporating fundamental analysis can provide a more comprehensive understanding of market trends, enhancing the strategy's robustness and profitability.
Source Pine Script
/*backtest
start: 2023-05-22 00:00:00
end: 2024-05-27 00:00:00
period: 1d
basePeriod: 1h
exchanges: [{"eid":"Binance","currency":"BTC_USDT"}]
*/

//@version=5
strategy("Gold Trading Strategy 15 min", overlay=true)

// Input parameters
fast_ma_length = input.int(10, title="Fast MA Length")
slow_ma_length = input.int(30, title="Slow MA Length")
rsi_length = input.int(14, title="RSI Length")
rsi_overbought = input.int(70, title="RSI Overbought Level")
rsi_oversold = input.int(30, title="RSI Oversold Level")
lookback = input.int(50, title="Trendline Lookback Period")

// Indicators
fast_ma = ta.sma(close, fast_ma_length)
slow_ma = ta.sma(close, slow_ma_length)
rsi = ta.rsi(close, rsi_length)

// Trendline breakout detection
highs = ta.highest(high, lookback)
lows = ta.lowest(low, lookback)

trendline_breakout_up = ta.crossover(close, highs)
trendline_breakout_down = ta.crossunder(close, lows)

// Entry conditions
udao_condition = (ta.crossover(fast_ma, slow_ma) or trendline_breakout_up) and rsi < rsi_overbought
girao_condition = (ta.crossunder(fast_ma, slow_ma) or trendline_breakout_down) and rsi > rsi_oversold

// Strategy execution
if (udao_condition)
    strategy.entry("उदाओ", strategy.long)
if (girao_condition)
    strategy.entry("गिराओ", strategy.short)

// Plotting
plot(fast_ma, color=color.blue, title="Fast MA")
plot(slow_ma, color=color.red, title="Slow MA")

hline(rsi_overbought, "RSI Overbought", color=color.red)
hline(rsi_oversold, "RSI Oversold", color=color.green)
plot(rsi, color=color.purple, title="RSI")

plotshape(series=udao_condition, location=location.belowbar, color=color.green, style=shape.labelup, title="उदाओ Signal")
plotshape(series=girao_condition, location=location.abovebar, color=color.red, style=shape.labeldown, title="गिराओ Signal")

// Plot trendline breakout levels
plot(highs, color=color.orange, linewidth=2, title="Resistance Trendline")
plot(lows, color=color.yellow, linewidth=2, title="Support Trendline")
Published by ChaoZhang on the FMZ strategy square · last modified 2024-05-28. Collected in the Quant Trading Vault. Unvalidated research: re-test with your own data and costs before trusting it.
Build this with AgenKit
A spec is not a trading system. Paste this into your coding agent and AgenKit runs a specialist team — architecture, test-first build, risk gates, review — with paper trading on by default.
/agenkit build a production-grade trading bot with a backtest engine, risk controls and paper trading by default from strategies/Dual-Moving-Average-RSI-Momentum-Strategy-Based-on-EMA-and-Trendline-Breakouts.md- npx agenkit install engineering-kit in your project
- Paste the command into your agent and approve each phase
- Get tests, backtest, risk controls and a paper-trading switch
Understand it first
Before you run this, read the lesson behind the idea and how to backtest it honestly. Specs like this one are the survivors of an unknown number of trials; deflate their results accordingly.
Related specs
- Bull Market Tracking SystemPine Script · Breakout · 1h
- Dual MA Momentum Breakout StrategyPine Script · Breakout · 1h
- EMA and Bollinger Bands Breakout StrategyPine Script · Breakout · 1h
- Exponential Moving Average Candle Stop Trading StrategyPine Script · Breakout · 1d
- Momentum Breakout Moving Average StrategyPine Script · Breakout · 1d
- Momentum Breakout Trading Strategy 440964Pine Script · Breakout · 5m