Strategy vault / Mean reversion
Dual Moving Average RSI Synergy Options Quantitative Trading Strategy
This strategy is a quantitative trading system based on moving average crossovers and RSI indicators, primarily designed for options market trading. The strategy utilizes fast and slow moving average crossover…
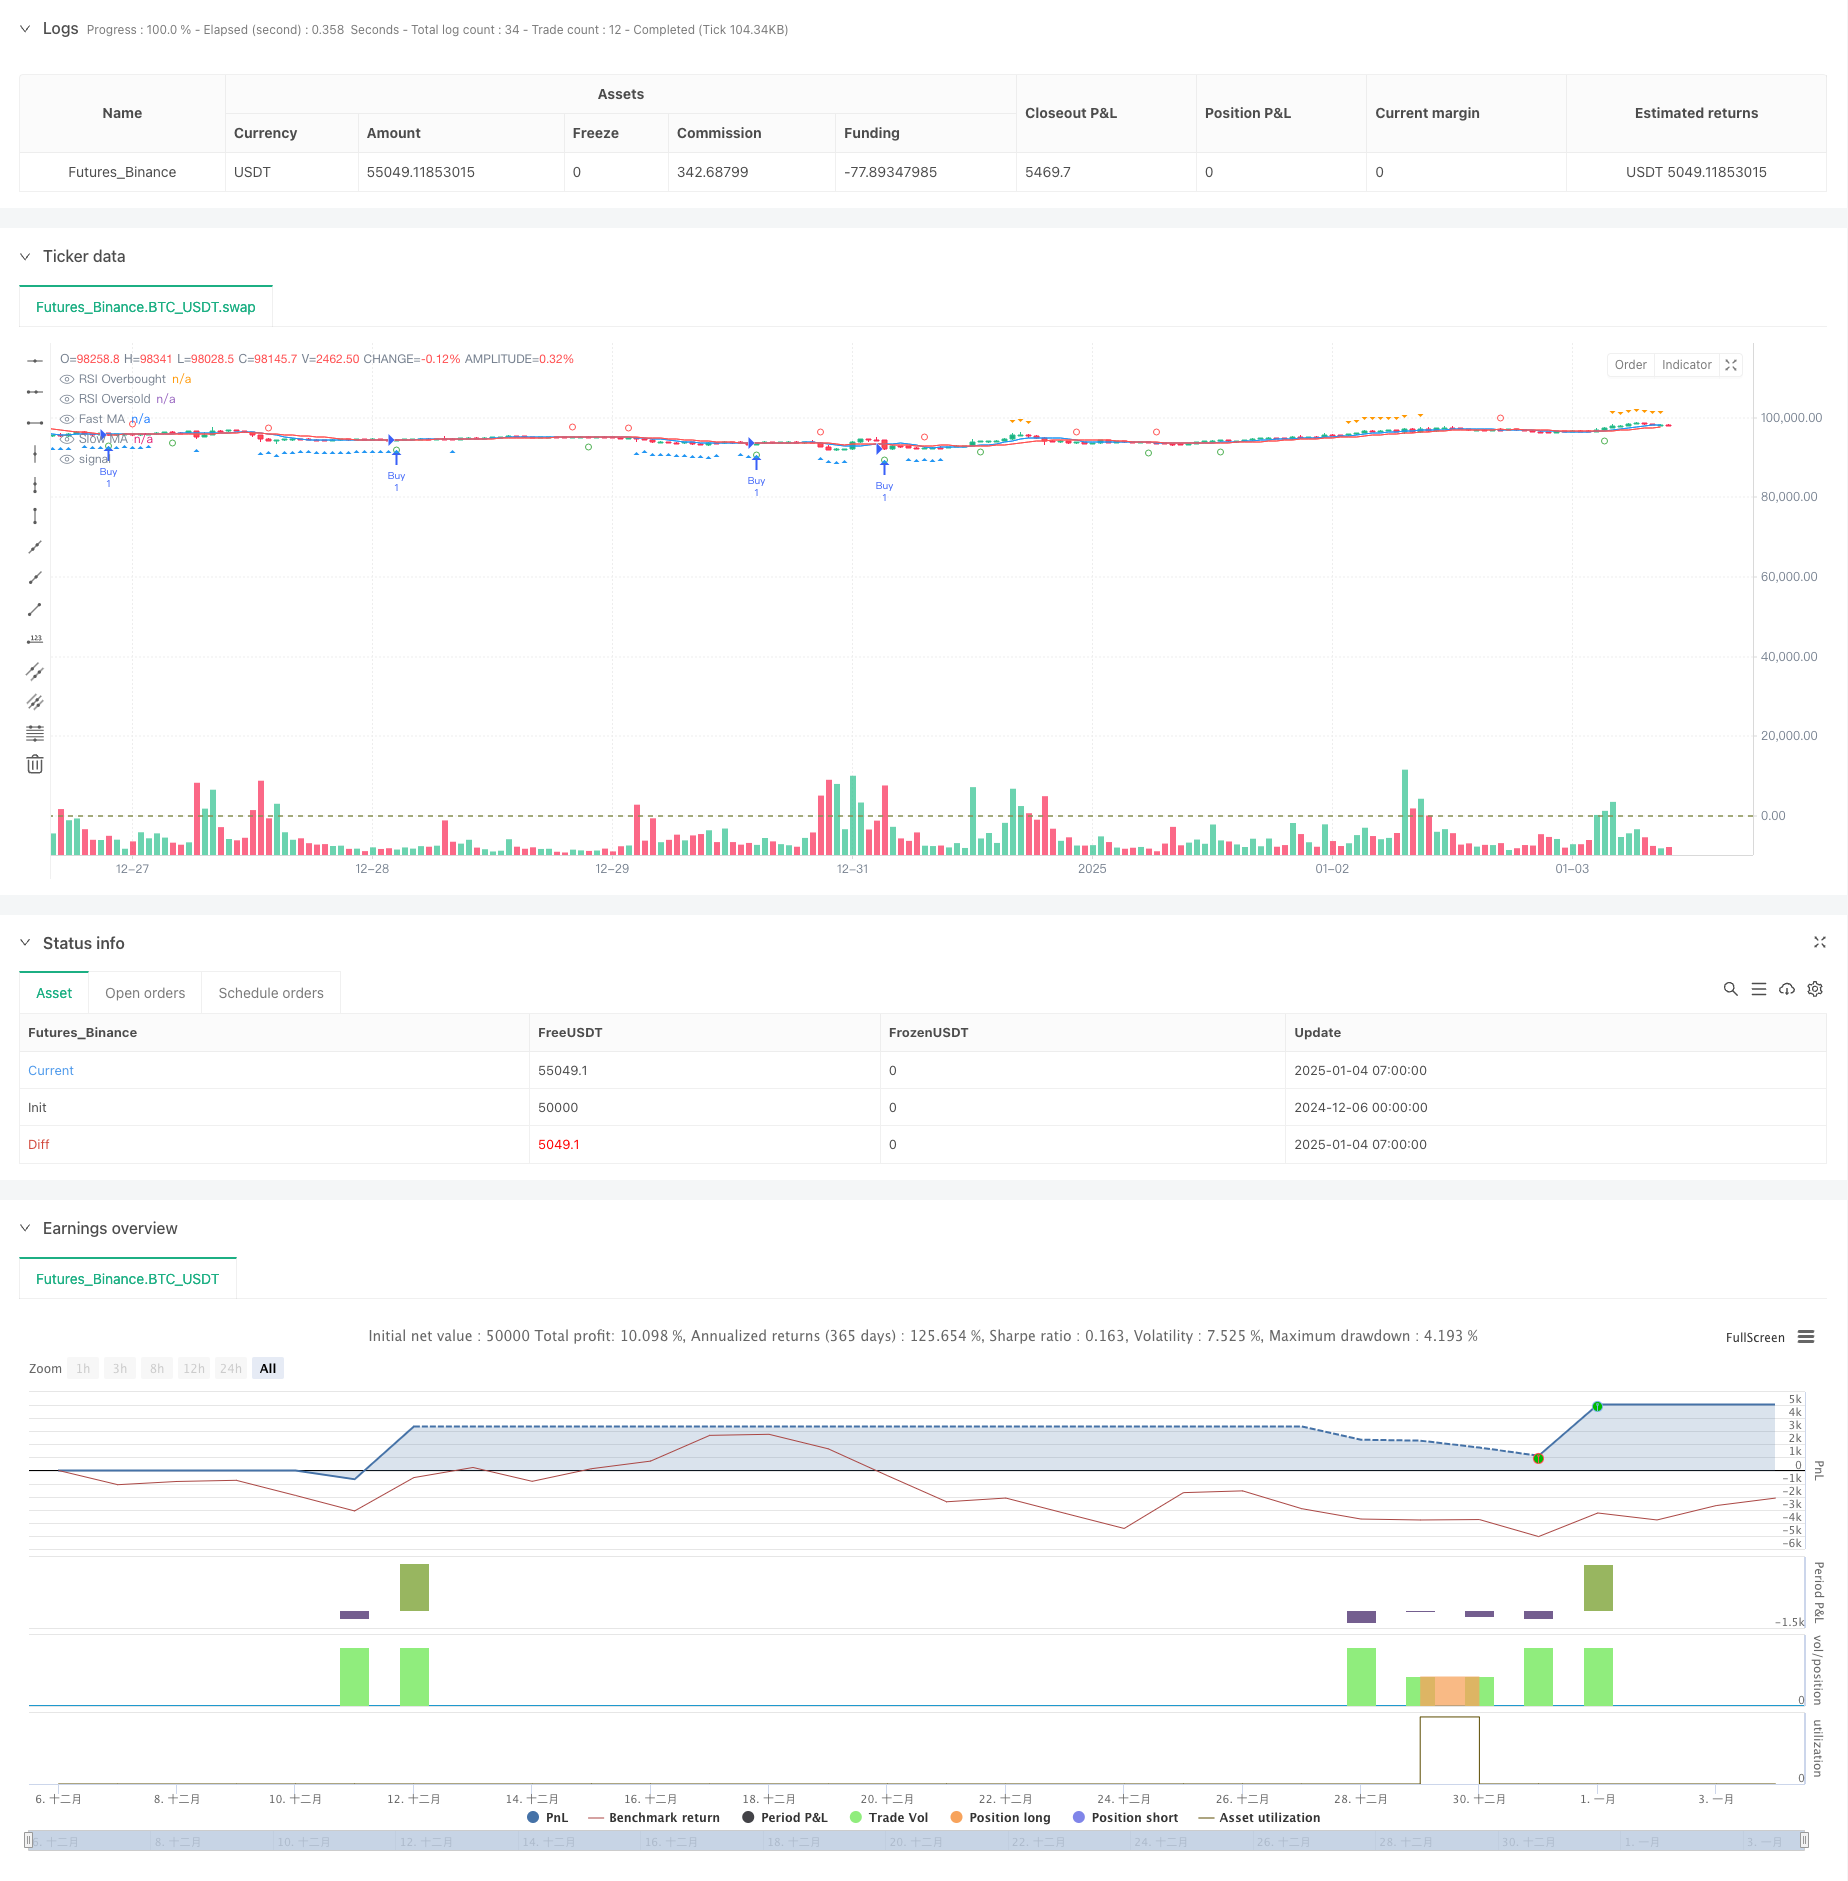
Overview
This strategy is a quantitative trading system based on moving average crossovers and RSI indicators, primarily designed for options market trading. The strategy utilizes fast and slow moving average crossover signals combined with RSI overbought/oversold levels to determine trading opportunities, while implementing take-profit and stop-loss mechanisms for risk control. The strategy is optimized for 5-minute timeframe trading.
Strategy Principles
The strategy employs two key technical indicators: Moving Averages (MA) and Relative Strength Index (RSI). Specifically:
- Uses 7-period and 13-period Simple Moving Averages (SMA) to capture price trends
- Employs 17-period RSI to identify overbought/oversold conditions
- Generates long signals when fast MA crosses above slow MA and RSI is below 43
- Generates short signals when fast MA crosses below slow MA and RSI is above 64
- Implements 4% take-profit and 0.5% stop-loss for risk management
Strategy Advantages
- Multiple confirmation mechanism: Combines MA crossovers and RSI indicators for more reliable trading signals
- Comprehensive risk management: Fixed percentage take-profit and stop-loss effectively control risk
- High adaptability: Parameters can be flexibly adjusted for different market conditions
- Visual support: Strategy provides clear graphical indicators for better market understanding
- Clear operational rules: Explicit entry and exit conditions reduce subjective judgment interference
Strategy Risks
- Choppy market risk: May generate frequent false signals in range-bound markets
- Slippage risk: Potential significant slippage in low liquidity options markets
- Parameter sensitivity: Strategy performance is sensitive to parameter settings, requiring continuous optimization
- Market environment dependence: Stop-loss might not be timely in highly volatile market conditions
- Systemic risk: Stop-loss may fail during market gaps or major events
Strategy Optimization Directions
- Incorporate volatility indicators: Consider adding ATR or Bollinger Bands to the decision system
- Optimize parameter adaptation: Develop dynamic parameter adjustment mechanisms based on market states
- Add market sentiment filtering: Integrate volume indicators to filter false signals
- Improve stop-loss mechanism: Consider implementing trailing stops for better risk management
- Add time filtering: Incorporate trading time windows to avoid inefficient trading periods
Summary
The strategy constructs a relatively complete trading system by combining MA crossovers and RSI indicators. Its strengths lie in multiple signal confirmation and comprehensive risk management, while attention must be paid to the impact of market conditions on strategy performance. Through continuous optimization and improvement, the strategy shows promise for stable performance in options markets. Traders are advised to conduct thorough backtesting and parameter optimization before live implementation.
Source Pine Script
/*backtest
start: 2024-12-06 00:00:00
end: 2025-01-04 08:00:00
period: 1h
basePeriod: 1h
exchanges: [{"eid":"Futures_Binance","currency":"BTC_USDT"}]
*/

//@version=5
strategy("MA Crossover with RSI Debugging", overlay=true)

// Inputs
fastLength = input.int(7, title="Fast MA Length", minval=1)
slowLength = input.int(13, title="Slow MA Length", minval=1)
rsiLength = input.int(17, title="RSI Length", minval=1)
rsiOverbought = input.int(64, title="RSI Overbought Level", minval=50, maxval=100)
rsiOversold = input.int(43, title="RSI Oversold Level", minval=0, maxval=50)
takeProfitPerc = input.float(4, title="Take Profit (%)", minval=0.1)
stopLossPerc = input.float(0.5, title="Stop Loss (%)", minval=0.1)

// Moving Averages
fastMA = ta.sma(close, fastLength)
slowMA = ta.sma(close, slowLength)

// RSI
rsi = ta.rsi(close, rsiLength)

// Entry Conditions
longCondition = ta.crossover(fastMA, slowMA) and rsi < rsiOversold
shortCondition = ta.crossunder(fastMA, slowMA) and rsi > rsiOverbought

// Plot Debugging Shapes
plotshape(ta.crossover(fastMA, slowMA), color=color.green, style=shape.circle, location=location.belowbar, title="Fast MA Crossover")
plotshape(ta.crossunder(fastMA, slowMA), color=color.red, style=shape.circle, location=location.abovebar, title="Fast MA Crossunder")

plotshape(rsi < rsiOversold, color=color.blue, style=shape.triangleup, location=location.belowbar, title="RSI Oversold")
plotshape(rsi > rsiOverbought, color=color.orange, style=shape.triangledown, location=location.abovebar, title="RSI Overbought")

// Entry and Exit Execution
if (longCondition)
    strategy.entry("Buy", strategy.long)

if (shortCondition)
    strategy.entry("Sell", strategy.short)

takeProfitPrice = strategy.position_avg_price * (1 + takeProfitPerc / 100)
stopLossPrice = strategy.position_avg_price * (1 - stopLossPerc / 100)

if (strategy.position_size > 0)
    strategy.exit("Exit Buy", from_entry="Buy", limit=takeProfitPrice, stop=stopLossPrice)

if (strategy.position_size < 0)
    strategy.exit("Exit Sell", from_entry="Sell", limit=takeProfitPrice, stop=stopLossPrice)

// Plot Moving Averages
plot(fastMA, color=color.blue, title="Fast MA")
plot(slowMA, color=color.red, title="Slow MA")

// RSI Levels
hline(rsiOverbought, "RSI Overbought", color=color.red)
hline(rsiOversold, "RSI Oversold", color=color.green)
Published by ChaoZhang on the FMZ strategy square · last modified 2025-01-06. Collected in the Quant Trading Vault. Unvalidated research: re-test with your own data and costs before trusting it.
Build this with AgenKit
A spec is not a trading system. Paste this into your coding agent and AgenKit runs a specialist team — architecture, test-first build, risk gates, review — with paper trading on by default.
/agenkit build a production-grade trading bot with a backtest engine, risk controls and paper trading by default from strategies/Dual-Moving-Average-RSI-Synergy-Options-Quantitative-Trading-Strategy.md- npx agenkit install engineering-kit in your project
- Paste the command into your agent and approve each phase
- Get tests, backtest, risk controls and a paper-trading switch
Understand it first
Before you run this, read the lesson behind the idea and how to backtest it honestly. Specs like this one are the survivors of an unknown number of trials; deflate their results accordingly.
Related specs
- Multi Indicator Reversal Point Capture Trading StrategyPine Script · Mean reversion · 1d
- Multi Timeframe Adaptive Mean Reversion with Volume Analysis StrategyPine Script · Mean reversion · 1h
- Reversal Trading Strategy with Bollinger Bands RSI ADX and ATRPine Script · Mean reversion · 1h
- CCTBBO Reversal Tracking StrategyPine Script · Mean reversion · 45m
- Multi Timeframe Gold Reversal Tracking StrategyPine Script · Mean reversion · 2h
- Bollinger Bands Trend Reversal StrategyPine Script · Mean reversion · 10m